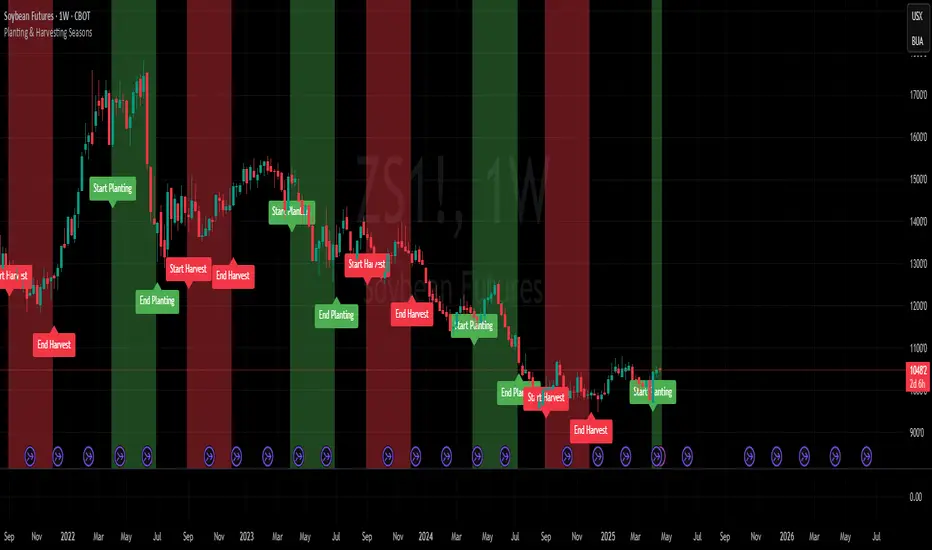
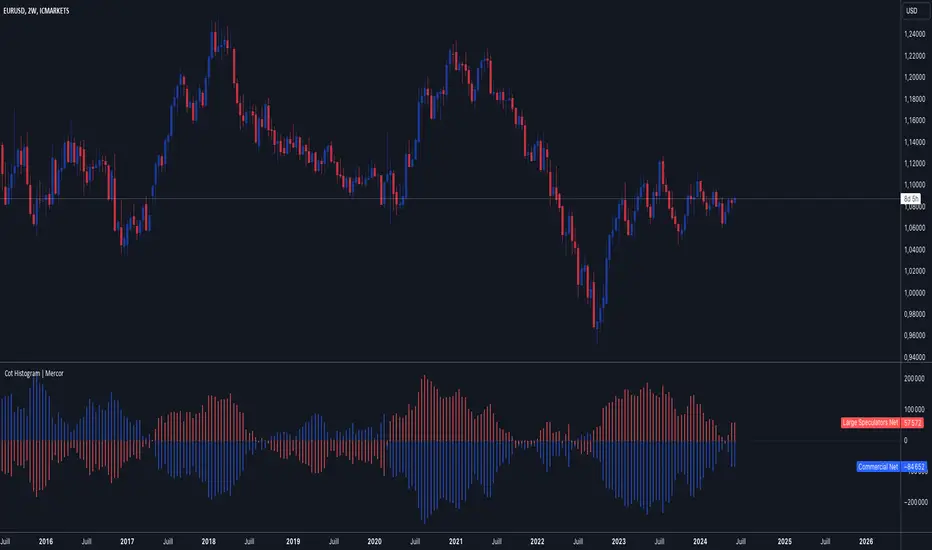
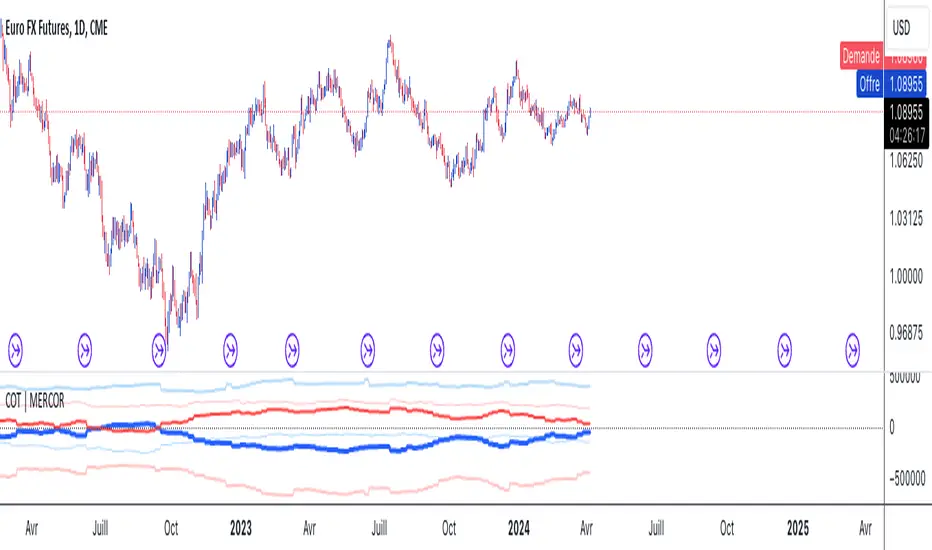
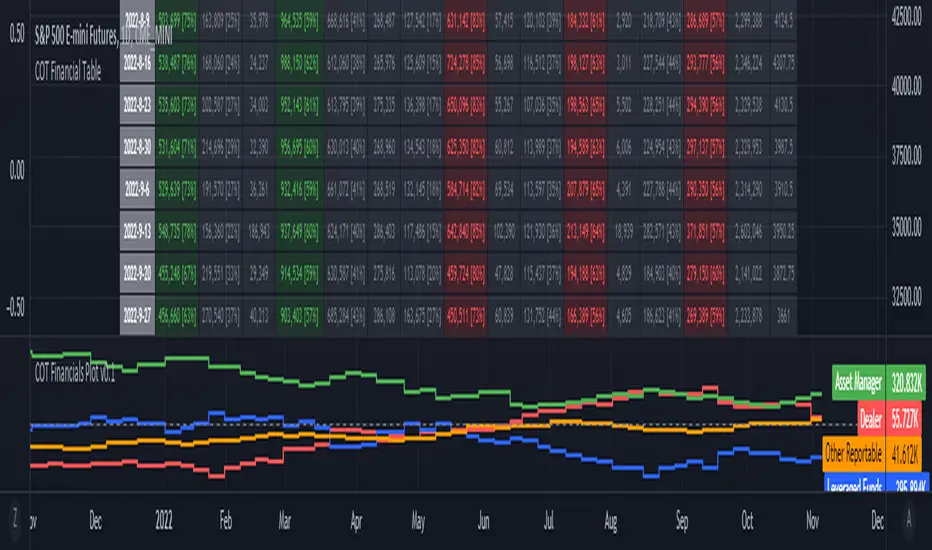
Indicatore Pine Script®
Commitment of Traders (COT)
xLevTrading AI SMC Algo v.0.6The xLevTrading AI Smart Money Concept Indicator is a significantly expanded and independently developed institutional trading framework based on LuxAlgo’s Smart Money Concept source code. While the script builds upon established Smart Money Concept principles such as market structure, liquidity analysis, order blocks, and fair value gaps, the internal logic, filtering systems, visual prioritization, and execution tools have been heavily redesigned and extended to create a more adaptive and context-aware analytical environment.
The primary objective of this indicator is not to generate excessive signals, but to help traders better understand how price interacts with liquidity, imbalance, and structural shifts in real market conditions. Instead of treating Smart Money Concepts as isolated visual tools, the indicator combines multiple layers of analysis into a unified framework where each component contributes contextual information to the others. This allows traders to evaluate not only where price currently is, but also why certain areas may become important during future market movement.
At the core of the system is the Adaptive Market Structure Engine, which acts as the foundation for all higher-level calculations. This engine continuously evaluates swing highs, swing lows, internal structure transitions, and external break-of-structure events in order to determine directional context across changing market conditions.
Unlike simplified structure indicators that only label highs and lows, the system distinguishes between internal market behavior and broader external trend development. This distinction allows traders to identify whether price action is currently impulsive, corrective, ranging, or transitioning into a potential reversal phase.
The structure engine also serves as a contextual filter for all other modules. Order blocks, fair value gaps, liquidity sweeps, and entry confirmations are evaluated relative to active structural conditions. This prevents isolated signals from appearing without broader market confirmation and helps traders focus on areas where multiple concepts align simultaneously.
One of the major components of the framework is the enhanced Order Block Engine. Traditional Smart Money Concept implementations often display large amounts of order blocks regardless of quality or contextual relevance, which can quickly overcrowd charts and reduce clarity. In this script, the order block system was redesigned to prioritize quality, structural alignment, and reaction probability instead of quantity.
The engine analyzes several contextual variables before validating a zone, including displacement strength, mitigation behavior, structural positioning, surrounding liquidity conditions, and overall market alignment. Zones that do not meet minimum contextual requirements are filtered out in order to reduce noise and improve readability.
This process creates a cleaner chart environment where institutional-style supply and demand zones become easier to interpret. The goal is not simply to identify historical candles, but to highlight areas where market participants may still have unfilled interest or where future reactions could become more likely.
To further improve usability, the indicator introduces Dynamic Fill Technology across both order blocks and fair value gaps. Instead of displaying every zone with equal visual weight, transparency levels dynamically adapt according to the internal scoring and contextual relevance of each area.
This visual hierarchy helps traders quickly distinguish stronger zones from weaker ones without manually analyzing every individual structure. Higher-confidence zones appear more visually dominant, while weaker areas fade into the background. The intention behind this system is to transform complex structural information into an intuitive visual workflow that supports faster decision-making during live market conditions.
Another major feature is the Dual Fair Value Gap Engine. Fair value gaps represent areas where price moved aggressively, creating temporary inefficiencies in the market. These imbalances often become important reaction zones as price later revisits them in an attempt to rebalance liquidity and restore market efficiency.
The Dual FVG system was specifically developed to identify strong imbalances across both lower timeframes (LTF) and higher timeframes (HTF) simultaneously. This allows traders to observe not only short-term inefficiencies, but also broader institutional imbalances that may influence market behavior over extended periods.
One of the key advantages of this approach is the ability to identify overlapping imbalances between different timeframe structures. When lower-timeframe and higher-timeframe fair value gaps align within similar price regions, these areas can represent stronger institutional interest and potentially more precise market impulses.
This multi-timeframe imbalance framework helps traders better understand where price may accelerate, react, or seek liquidity. By combining local execution zones with broader macro inefficiencies, traders gain additional context for identifying higher-probability entries and continuation opportunities.
The Liquidity Engine represents another central pillar of the framework. Liquidity behavior is one of the most important concepts in institutional trading because price often seeks areas where stop-loss orders, breakout traders, and resting liquidity are concentrated.
Instead of relying solely on static support and resistance levels, the liquidity system actively identifies equal highs, equal lows, liquidity pools, sweep conditions, and engineered liquidity grabs in real time. These events are then evaluated relative to structure and directional context.
This allows traders to better understand potential market intent rather than simply reacting to price movement after it has already occurred. For example, a liquidity sweep occurring against higher-timeframe directional bias may indicate temporary stop-hunting behavior rather than genuine reversal strength.
The interaction between liquidity and structure becomes especially important when combined with order blocks and fair value gaps. Areas where liquidity sweeps occur directly into structurally aligned imbalance zones can often provide significantly stronger contextual setups than isolated technical signals.
To further support directional analysis, the indicator also incorporates a Multi-Timeframe Moving Average Module. This feature provides optional trend filtering and directional confirmation by allowing traders to compare lower-timeframe execution against higher-timeframe trend conditions.
The moving average framework is not intended as a standalone signal generator, but rather as an additional contextual layer that helps traders avoid counter-trend positioning during strongly directional environments. This can be particularly useful when combining liquidity sweeps with continuation structures.
One of the newest additions to the framework is the Entry Finder Module, which is currently in Beta development. The purpose of the Entry Finder is not to replace discretionary trading decisions, but to assist traders in locating areas where multiple forms of confirmation align simultaneously.
The Entry Finder analyzes the relationship between structure direction, liquidity interaction, order block positioning, fair value gap alignment, and market momentum in order to identify potential execution zones. The system attempts to detect moments where price may be transitioning from liquidity collection into directional continuation.
For example, during bullish market conditions, the Entry Finder may identify a scenario where downside liquidity is swept below recent lows before price re-enters a bullish order block or bullish fair value gap that aligns with higher-timeframe structure. In bearish environments, the same logic can apply inversely after upside liquidity has been collected.
The purpose of this process is to help traders avoid emotional momentum entries and instead focus on structurally supported retracement opportunities where institutional participation may become more probable.
The Entry Finder can also assist traders by improving timing during volatile conditions. Many traders correctly identify directional bias but struggle with execution precision. By highlighting areas where liquidity, imbalance, and structure align simultaneously, the system attempts to improve entry location and reduce unnecessary chasing behavior.
Because the Entry Finder remains in Beta, its filtering logic and confirmation models are still being refined. Current versions should be viewed as execution assistance tools rather than fully automated signal systems. Traders are encouraged to combine the Entry Finder with their own risk management and market interpretation.
In addition to its analytical capabilities, the overall design philosophy of the indicator focuses heavily on chart readability and workflow efficiency. One of the common challenges with Smart Money Concept tools is visual overload caused by excessive labels, overlapping zones, and unnecessary calculations appearing simultaneously.
This framework was designed to reduce that issue through selective filtering, contextual prioritization, and dynamic visual weighting. Rather than attempting to display every possible technical event, the indicator focuses on highlighting areas where multiple concepts converge.
The result is a cleaner trading environment that allows users to focus more effectively on liquidity behavior, structural shifts, and execution planning without becoming overwhelmed by chart clutter.
The xLevTrading AI Smart Money Concept Indicator should be viewed as a professional-grade analytical framework designed for discretionary traders who want a deeper understanding of institutional price behavior. By combining enhanced Smart Money Concept principles with proprietary filtering systems, dynamic visualization methods, liquidity analysis, and multi-timeframe contextual alignment, the script aims to transform complex market behavior into a more structured and actionable decision-making process.
This indicator does not guarantee profitable trades and should not be interpreted as financial advice. It is intended as a decision-support and market-structure analysis tool that assists traders in interpreting price action, identifying contextual confluence, and improving overall market awareness across different trading environments.
Chart Visualization & Color Structure
To improve chart readability and help traders quickly distinguish between different market concepts, the indicator uses a structured color hierarchy across all major components. The visual system was intentionally designed to reduce confusion during live analysis and to make the interaction between liquidity, structure, order blocks, and fair value gaps easier to interpret.
Bearish higher-timeframe order blocks are displayed in purple. These zones represent institutional-style supply areas that align with broader bearish market structure and may act as potential reaction or continuation zones during retracements.
Bearish higher-timeframe fair value gaps (HTF FVGs) are displayed in orange. These imbalance zones represent aggressive bearish displacement on higher timeframes and are intended to highlight areas where price inefficiencies may still attract future reactions or rebalancing behavior.
Bearish chart timeframe fair value gaps are displayed in red. These zones reflect local bearish imbalances directly on the active chart timeframe and are primarily used for short-term execution analysis and momentum continuation setups.
Bullish chart timeframe fair value gaps are displayed in green. These indicate local bullish inefficiencies where price moved aggressively to the upside, potentially leaving behind imbalance zones that may later provide support during retracements.
Bullish higher-timeframe fair value gaps are displayed in turquoise. These zones represent larger bullish imbalances from higher timeframe price action and are intended to provide macro directional context and stronger institutional reaction areas.
The interaction between these colors and zones is an important part of the overall framework. Traders can use overlapping higher-timeframe and lower-timeframe imbalances to identify areas where multiple forms of market inefficiency align simultaneously. For example, when a lower-timeframe bullish fair value gap develops inside a higher-timeframe bullish imbalance zone, this may indicate stronger continuation potential and improved structural confluence.
The chart layout shown in the publication intentionally focuses only on the indicator’s own analytical components without unnecessary overlays or unrelated tools. This cleaner presentation is designed to help traders clearly identify how the different modules interact with one another in real market conditions.
Labels such as Break of Structure (BOS), Change of Character (CHoCH), liquidity sweeps, moving averages, order blocks, and fair value gaps are displayed directly within their relevant market context to support visual interpretation and execution planning.
Indicatore Pine Script®
COT IndexCOT Index — Managed Money / Large Spec / Commercials
Short tagline:
Three-line COT Index (0–100) for futures: Large Spec, Managed Money, Commercials. Min-max normalized over a configurable rolling weekly window.
---
Description:
The COT Index plots three trader-group positioning gauges on a single 0–100 scale, derived directly from the CFTC's weekly Commitments of Traders reports. Useful for spotting positioning extremes, divergences between speculator and
commercial flow, and contrarian setups.
# What it shows
Three colored lines:
- 🔵 **Large Speculator** — Managed Money + Other Reportable (combined non-commercial positioning)
- 🟣 **Managed Money** — Managed Money only (Disaggregated) or Leveraged Funds (Financial / TFF)
- 🟠 **Commercials** — Producer/Merchant (Disaggregated) or Dealer/Intermediary (Financial)
Plus reference levels:
- Dashed red at **90** — extreme long
- Dashed green at **10** — extreme short
- Dotted gray at **50** — mid
# Formula
For each group, the indicator computes net positioning (Long − Short), then min-max normalizes over a rolling N-week window:
COT Index = (currentNet − min(net, N)) / (max(net, N) − min(net, N)) × 100
Default N = 156 weeks (3 years). Other common values: 13 (3M), 26 (6M), 52 (1Y).
# Auto contract resolution
Apply to any of the supported futures contracts and the indicator auto-resolves the CFTC code from the chart symbol. No manual configuration needed.
| Asset | Symbol | Report |
|---|---|---|
| Gold | COMEX:GC1! | Disaggregated |
| Silver | COMEX:SI1! | Disaggregated |
| Copper | COMEX:HG1! | Disaggregated |
| Platinum | NYMEX:PL1! | Disaggregated |
| Palladium | NYMEX:PA1! | Disaggregated |
| WTI Crude Oil | NYMEX:CL1! | Disaggregated |
| Brent Crude Oil | NYMEX:BZ1! / ICEEUR:BRN1! | Disaggregated |
| Natural Gas | NYMEX:NG1! | Disaggregated |
| RBOB Gasoline | NYMEX:RB1! | Disaggregated |
| Heating Oil | NYMEX:HO1! | Disaggregated |
| Euro FX | CME:6E1! | Financial (TFF) |
| British Pound | CME:6B1! | Financial (TFF) |
| Swiss Franc | CME:6S1! | Financial (TFF) |
| Canadian Dollar | CME:6C1! | Financial (TFF) |
| Japanese Yen | CME:6J1! | Financial (TFF) |
| Australian Dollar | CME:6A1! | Financial (TFF) |
| New Zealand Dollar | CME:6N1! | Financial (TFF) |
| Mexican Peso | CME:6M1! | Financial (TFF) |
Apply to a non-mapped symbol (e.g. a stock) and the indicator returns a clear runtime error.
# Inputs
- **Lookback (weeks)** — rolling window (4–520, default 156)
- **Show Large Speculator / Managed Money / Commercials** — toggle each line independently
- **Extreme long / short thresholds** — adjust the dashed reference lines
# How to read it
- **Large Spec / Managed Money near 90+** → speculators are very long, often a contrarian sell signal
- **Large Spec / Managed Money near 10−** → speculators are very short, often a contrarian buy signal
- **Commercials are the inverse** of speculators by definition (they take the other side of the trade) — Commercials at 1 typically pairs with Specs near 100
- **Watch divergences** between price and the indicator — speculative positioning peaking while price still rises is a classic distribution warning
# Notes
- Uses TradingView's official `LibraryCOT` (by TradingView) for ticker construction.
- Forces weekly resolution regardless of chart timeframe — values only update on Tuesday COT release days.
- `lookahead = barmerge.lookahead_off` — no future data leak; backtesting is honest.
- Auto-detect requires applying to the **futures** symbol (e.g. `6E1!`), not the spot pair (`EURUSD`). Spot FX charts are not supported.
- Data comes from the Disaggregated report for metals/energy and the Traders in Financial Futures (TFF) report for FX. Both are futures-only (`includeOptions=false`).
# Credits
Data fetching: ().
Open-source — feel free to fork and adapt.
---
Indicatore Pine Script®
Adaptive Volatility Bands [AVB]Adaptive Volatility Bands (AVB) is a volatility-aware trend-following overlay indicator built on the Kaufman Adaptive Moving Average (KAMA) and dynamically adjusted Bollinger-style bands.
**Mathematical Foundation:**
The core of AVB is the Kaufman Efficiency Ratio (ER), which measures the ratio of directional price movement to total price movement over a lookback period. An ER near 1.0 indicates a strong trend with minimal noise; an ER near 0.0 indicates choppy, range-bound conditions. The KAMA uses this ratio to automatically adjust its smoothing constant — responding quickly during trends and slowly during consolidation.
The bands around the KAMA are not static standard deviations. Instead, they use an adaptive standard deviation that widens when the Efficiency Ratio is low (noisy markets) and tightens when ER is high (trending markets). This creates bands that contract during consolidation (squeeze) and expand during breakouts.
**Signal Logic:**
Buy signals are generated when price touches the lower band with RSI in oversold territory during an uptrend, or when a squeeze releases with price above the KAMA. Sell signals fire at the upper band with RSI overbought during a downtrend, or at squeeze release below KAMA. Volume confirmation is applied to filter low-conviction signals.
**Features:**
- Kaufman Adaptive Moving Average with adjustable fast/slow smoothing periods
- Adaptive volatility bands that respond to market efficiency
- Volatility squeeze detection with bar coloring
- RSI and volume filters for signal confirmation
- ATR-based stop-loss and take-profit levels
- Real-time dashboard showing efficiency ratio, RSI, volatility regime, and trend direction
- Fully customizable colors and parameters
**Use Cases:**
Suitable for forex, crypto, commodities, and equities across all timeframes. Works well on 15-minute to daily charts.
Indicatore Pine Script®
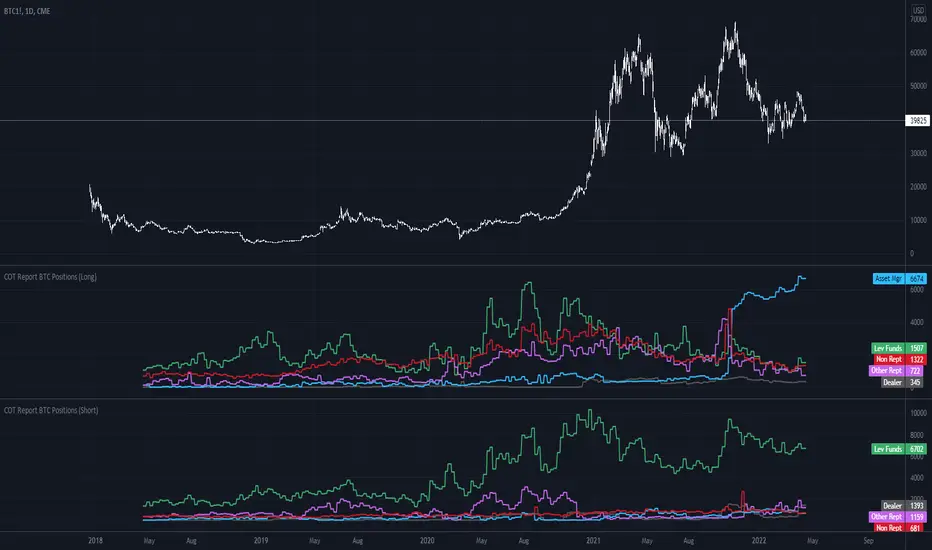
BTC COT Net ShortThis indicator displays the Net Short Position of Non-Commercial traders
(hedge funds, large speculators) in Bitcoin CME Futures, based on CFTC COT report data.
How to read:
🔴 Red (above 0) → Non-commercial traders are NET SHORT = bearish bias
🟢 Green (below 0) → Non-commercial traders are NET LONG = bullish bias
Data source: CFTC Commitment of Traders (COT) report
Updates weekly every Friday.
Note: Best used on Daily timeframe.
Indicatore Pine Script®
COT Report Indicator - V2COT Report — BTC & ETH Positioning (Weekly)
This indicator visualizes weekly Commitments of Traders (COT) positioning specifically for Bitcoin (BTC) and Ethereum (ETH).
What it shows
A table with the latest report values:
Net contracts
Long %
Short %
A line chart that expresses directional bias for key participant groups:
Commercials
Institutionals
Retail
Bias values above 50 indicate a stronger long bias; values below 50 indicate a stronger short bias.
How to use
COT data is published weekly, so this indicator is intended for trend and positioning context, not precise entry signals. It can help identify:
Longer-term positioning shifts (trend confirmation/divergence)
Potential crowding and exhaustion
Areas where tops/bottoms are more likely to form when positioning reaches extremes
Notes
Because the dataset updates weekly, signals can lag fast market moves. Always combine with price action and risk management.
Indicatore Pine Script®
Futures CompareFutures/Spot Arbitrage Across Exchanges is a tool for monitoring price spreads between major crypto exchanges for the same symbol.
What this indicator does
Calculates percentage spread of futures or spot prices on multiple exchanges relative to a selected base exchange (e.g., Binance, Bybit, OKX).
Displays the average spread as a histogram and shows a table with per-exchange spreads to the base in real time.
When more than one exchange is selected, it can focus the plot on the Binance spread to keep the chart clean while still showing all exchanges in the table.
How and where to use it
Designed primarily for crypto futures and spot markets to track cross-exchange dislocations on pairs like BTCUSDT, ETHUSDT, etc.
Useful for manual or semi-automatic arbitrage trading, market-making, and monitoring funding-related distortions between futures and spot across exchanges.
Apply it on intraday timeframes (from 1m to 1h) to see short-term spikes in spreads, or on higher timeframes to analyze the general efficiency and pricing consistency between exchanges.
Indicatore Pine Script®
COT: CTA POSITIONINGCOT: CTA POSITIONING
A comprehensive Commitment of Traders (COT) indicator that tracks institutional money manager positioning across futures markets. This indicator displays CTA (Commodity Trading Advisor) net positioning as a percentile rank, helping traders identify potential market extremes and contrarian opportunities.
Key Features:
Multi-Market Coverage: Automatically detects and displays COT data for 60+ futures contracts across equity indices, bonds, currencies, cryptocurrencies, metals, energy, grains, livestock, and softs
Percentile Rank Display: Shows CTA net positioning (long minus short) as a percentile over a customizable lookback period (default 156 weeks ≈ 3 years)
Extreme Zones: Visual highlighting of potential reversal zones when CTAs reach positioning extremes (>80th percentile = bearish, <20th percentile = bullish)
Liquidity Analysis Table (optional): Displays detailed positioning breakdown including:
Gross long and short positions
Net positioning
20-day average volume
Net position as % of average daily volume
Estimated days to unwind net position
Methodology:
The indicator pulls CFTC Commitment of Traders data from both Financial Traders (COT3) and Disaggregated (COT2) reports, focusing specifically on leveraged money managers (CTAs/hedge funds). It calculates:
Net Positioning = CTA Longs - CTA Shorts
Net as % of Open Interest
Percentile rank of current net positioning vs. lookback period
Interpretation:
High readings (>80): CTAs are extremely net long - potential bearish reversal signal
Low readings (<20): CTAs are extremely net short - potential bullish reversal signal
Works best as a contrarian indicator on weekly timeframes
Consider liquidity metrics to assess position size relative to market capacity
Settings:
Lookback Period: Adjustable percentile calculation window (default 156 periods)
Show Table: Toggle detailed positioning and liquidity data display
Supported Markets:
Equity Indices (ES, NQ, RTY, YM), Treasuries (ZT, ZF, ZN, ZB, UB), Currencies (6E, 6J, 6B, 6C, 6A), Crypto (BTC, ETH), Metals (GC, SI, HG, PL, PA), Energy (CL, NG, RB, HO, BZ), Grains (ZC, ZW, ZS, ZM, ZL), Livestock (LE, HE, GF), and Softs (SB, CT, KC, CC, OJ)
Note: COT data is released weekly on Fridays and reflects positions as of Tuesday close. This indicator works best on daily or weekly timeframes.
Data sourced from CFTC Commitment of Traders reports via TradingView's COT library.
Indicatore Pine Script®
Trading Checklist - POI & iFVG StrategyInspired by Navi Trades rules of trade engagement, I'm keeping it open on the side of the chart as reminder
Watch: www.youtube.com
Read: www.notion.so
Indicators Navi Uses:
iFVG:
CCT:
VWT:
Sessions: ICT Killzones + Pivots indicator
**Strategy**
**A+ Trade (Bullish Example):**
- Wait for a H1 candle to above virgin wick(s)
- Virgin wick(s) becomes H1 Bullish POIs
- Drop to M1 and look for price to trade under POI (can be wick or close)
- Then wait for a confirmed iFVG
- (iFVG can be on either side of POI)
- Limit order on confirmation of iFVG
**TP/SL:**
- SL: Just on the other side of the iFVG or the entry candle (which ever is further/safer)
- TP: Obvious DOL OR 2R is DOL is more than 2R away
- If DOL is significantly more than 2R away, I will widen the SL a bit and lessen the TP a bit
- No partial TP, No moving SL, No trailing, No breakeven. Either SL or TP
- Risk = 10% of drawdown ($200 for $50k Lucid accounts)
- Contract size will change depending on how far SL is so I can maintain same $ risk
**A+ Rules**
- Each POI is only valid for an hour
- If still in trade at end of hour, let it play out
- No entries from XX:51
- If price already delivers off POI without giving entry I will not consider it anymore
- There must be an obvious DOL - I will not target empty space
- 1.5R MINIMUM, 2R MAXIMUM
**A+ Process:**
- Wait for iFVG alert
- Check that none of the above rules have been breached
- Check if price engaged with respective POI (bullish/bearish) - this is where indicators help (personal preference) (you still need to understand the model)
- Limit order at iFVG confirmation
- SL on other side of iFVG or entry candle (which ever is further)
- TP at clear DOL (2R max)
- If DOL is a lot more than 2R away - can widen SL a bit
**Reminders**
- Process > Profits.
- A perfectly executed red day > poorly executed green day
- Follow your system.
- Trust your edge - trading is a probabilities game.
- You can lose more than half of your trades and STILL BE PROFITABLE
- There will be losses. That is a part of this business. There is no model in the world that has a 100% win rate.
- Be grateful for the opportunity to make magic internet monies by clicking buttons on a screen
Indicatore Pine Script®
Time Pressure ZonesTime Pressure Zones is a multi‑purpose candle and volume‑based indicator that highlights moments when markets are likely being driven by urgency rather than routine trading flow.
**Overview**
Detects sequences of strong, one‑directional candles accompanied by volume spikes to approximate institutional time pressure (forced buying or selling).
Paints subtle background zones, labels, and a net‑pressure histogram so you can see when aggressive flow is building or exhausting across any instrument and timeframe.
**Core Logic**
A bar is tagged “strong” when its real body occupies at least a user‑defined percentage of the full high‑low range, filtering out indecision candles and long‑wick noise.
Volume is compared to a rolling 20‑bar average; only bars with volume above a configurable multiple are treated as meaningful participation, which makes the tool adapt to different symbols and sessions.
The script counts consecutive bars that are both strong and high‑volume in the same direction, then flags a time‑pressure event once a set fraction of the lookback has been reached (e.g., 2 out of 3, 3 out of 5).
**Visual Outputs**
Background shading: green or red bands mark active bullish or bearish time‑pressure windows without overpowering other tools on the chart.
On‑chart labels: “↑ Time Pressure” and “↓ Time Pressure” appear only on the first bar of a new pressure sequence, ideal for alerts and discretionary entries.
Net Pressure histogram: plots the difference between bullish and bearish streak counts, giving a quick at‑a‑glance sense of which side currently dominates.
**Sessions and News**
Uses UTC‑based logic to highlight London and New York open and close windows, where institutional flows and intraday “deadline” behavior tend to cluster.
Includes a manual News Window toggle so you can mark high‑impact event periods (CPI, FOMC, NFP, etc.), aligning tape‑based urgency with scheduled catalysts.
**How To Use**
Look to join moves when fresh time‑pressure labels print into session opens, breakouts, or key levels, rather than fading them.
Tune the three main inputs per market and timeframe: lower thresholds for choppy or thin markets, and higher body/volume requirements for very liquid symbols like major indices or BTC pairs.
Indicatore Pine Script®
COT + SMI Dual Strategy (Rev/Trend)I use this script to test whether stochastic COT report filtering for trade direction makes a difference or not for forex.
It seems it does! Feel free to test and comment. I am always happy to see to be proven wrong.
Strategia Pine Script®
Ian Trades COT Net PositionsThe COT net positions indicator shows how many futures contracts big traders are buying minus how many they are selling.
Indicatore Pine Script®
Ian Trades COT Net PositionsThe COT net positions indicator shows how many futures contracts big traders are buying minus how many they are selling.
Indicatore Pine Script®
Smart Money COTThis indicator implements the method of analysing COT data as defined by Michael Huddleston (I.E. The Inner Circle Trader). It removes all superfluous information contained in the standard COT reports and focusses only on Commercial speculators using the overall Long-Short positions.
Features
The unique feature of this indicator is its ability to look back over time and provide the following information:
Calculation of the range high and low of the specified lookback range.
Calculation of equilibrium of that range.
Automatic colour coding of net long and net short positions when the Long-Short COT calculation is above or below equilibrium of the lookback range.
Instructions
Use the Daily Timeframe only. You may get unexpected results on other timeframes.
Ensure the asset has COT data available. Script is mainly focused on commodity futures, such as ES, NQ, YM. It has not been tested against Forex.
You will need to define the "Lookback" setting in the script settings. Use the total number of trading days required for your analysis. E.g. if you want a 6 month COT analysis, use the measurement tool to count the quantity of daily candles between now and 6 months ago - use this as your Lookback setting. Adjust as needed for other lookback periods, e.g. 3 months, 12 months etc.
Other Info
The script provides the ability to customise colours in its settings.
Range High and Range Low plots can be disabled in settings.
Indicatore Pine Script®
Cjack COT IndexHere's the updated description with the formula and additional context:
---
**Cjack COT Index - Commitment of Traders Positioning Indicator**
This indicator transforms raw Commitment of Traders (COT) data into normalized 0-100 index values, making it easy to identify extreme positioning across different trader categories.
**How It Works:**
The indicator calculates a min-max normalized index for three trader groups over your chosen lookback period (default 26 weeks):
- **Large Speculators** (Non-commercial positions) - typically trend followers
- **Small Speculators** (Non-reportable positions) - retail traders
- **Commercial Hedgers** - producers and consumers hedging business risk
The normalization formula is: **Index = (Current Position - Minimum Position) / (Maximum Position - Minimum Position) × 100**
This calculation shows where current net positioning sits between the minimum and maximum levels observed in the lookback window. A reading of 100 means current positioning equals the maximum net long over that period, 0 equals the minimum (most net short), and 50 is the midpoint of the range.
**Important:** The lookback period critically affects index readings - shorter lookbacks (13-26 weeks) make the index more sensitive to recent extremes, while longer lookbacks (52-78 weeks) provide broader historical context and identify truly exceptional positioning. Min-max normalization is essential because it makes positioning comparable across different contracts and time periods, regardless of the absolute size of positions.
**What It's Good For:**
The indicator excels at identifying **crowded trades** and potential reversals by tracking contrarian setups where commercials (smart money) position opposite to speculators. Background highlighting automatically flags:
- **Long setups** (green): Commercials heavily long while speculators are heavily short
- **Short setups** (red): Commercials heavily short while speculators are heavily long
The "Shift Index" option (enabled by default) displays last week's tradeable COT data aligned with current price action, ensuring you're working with actionable information since COT reports publish with a delay.
Works on weekly timeframes and below for commodities and futures with available COT data.
Indicatore Pine Script®
COT IndexTHE HIDDEN INTELLIGENCE IN FUTURES MARKETS
What if you could see what the smartest players in the futures markets are doing before the crowd catches on? While retail traders chase momentum indicators and moving averages, obsess over Japanese candlestick patterns, and debate whether the RSI should be set to fourteen or twenty-one periods, institutional players leave footprints in the sand through their mandatory reporting to the Commodity Futures Trading Commission. These footprints, published weekly in the Commitment of Traders reports, have been hiding in plain sight for decades, available to anyone with an internet connection, yet remarkably few traders understand how to interpret them correctly. The COT Index indicator transforms this raw institutional positioning data into actionable trading signals, bringing Wall Street intelligence to your trading screen without requiring expensive Bloomberg terminals or insider connections.
The uncomfortable truth is this: Most retail traders operate in a binary world. Long or short. Buy or sell. They apply technical analysis to individual positions, constrained by limited capital that forces them to concentrate risk in single directional bets. Meanwhile, institutional traders operate in an entirely different dimension. They manage portfolios dynamically weighted across multiple markets, adjusting exposure based on evolving market conditions, correlation shifts, and risk assessments that retail traders never see. A hedge fund might be simultaneously long gold, short oil, neutral on copper, and overweight agricultural commodities, with position sizes calibrated to volatility and portfolio Greeks. When they increase gold exposure from five percent to eight percent of portfolio allocation, this rebalancing decision reflects sophisticated analysis of opportunity cost, risk parity, and cross-market dynamics that no individual chart pattern can capture.
This portfolio reweighting activity, multiplied across hundreds of institutional participants, manifests in the aggregate positioning data published weekly by the CFTC. The Commitment of Traders report does not show individual trades or strategies. It shows the collective footprint of how actual commercial hedgers and large speculators have allocated their capital across different markets. When mining companies collectively increase forward gold sales to hedge thirty percent more production than last quarter, they are not reacting to a moving average crossover. They are making strategic allocation decisions based on production forecasts, cost structures, and price expectations derived from operational realities invisible to outside observers. This is portfolio management in action, revealed through positioning data rather than price charts.
If you want to understand how institutional capital actually flows, how sophisticated traders genuinely position themselves across market cycles, the COT report provides a rare window into that hidden world. But understand what you are getting into. This is not a tool for scalpers seeking confirmation of the next five-minute move. This is not an oscillator that flashes oversold at market bottoms with convenient precision. COT analysis operates on a timescale measured in weeks and months, revealing positioning shifts that precede major market turns but offer no precision timing. The data arrives three days stale, published only once per week, capturing strategic positioning rather than tactical entries.
If you need instant gratification, if you trade intraday moves, if you demand mechanical signals with ninety percent accuracy, close this document now. COT analysis rewards patience, position sizing discipline, and tolerance for being early. It punishes impatience, overleveraging, and the expectation that any single indicator can substitute for market understanding.
The premise is deceptively simple. Every Tuesday, large traders in futures markets must report their positions to the CFTC. By Friday afternoon, this data becomes public. Academic research spanning three decades has consistently shown that not all market participants are created equal. Some traders consistently profit while others consistently lose. Some anticipate major turning points while others chase trends into exhaustion. Bessembinder and Chan (1992) demonstrated in their seminal study that commercial hedgers, those with actual exposure to the underlying commodity or financial instrument, possess superior forecasting ability compared to speculators. Their research, published in the Journal of Finance, found statistically significant predictive power in commercial positioning, particularly at extreme levels. This finding challenged the efficient market hypothesis and opened the door to a new approach to market analysis based on positioning rather than price alone.
Think about what this means. Every week, the government publishes a report showing you exactly how the most informed market participants are positioned. Not their opinions. Not their predictions. Their actual money at risk. When agricultural producers collectively hold their largest short hedge in five years, they are not making idle speculation. They are locking in prices for crops they will harvest, informed by private knowledge of weather conditions, soil quality, inventory levels, and demand expectations invisible to outside observers. When energy companies aggressively hedge forward production at current prices, they reveal information about expected supply that no analyst report can capture. This is not technical analysis based on past prices. This is not fundamental analysis based on publicly available data. This is behavioral analysis based on how the smartest money is actually positioned, how institutions allocate capital across portfolios, and how those allocation decisions shift as market conditions evolve.
WHY SOME TRADERS KNOW MORE THAN OTHERS
Building on this foundation, Sanders, Boris and Manfredo (2004) conducted extensive research examining the behaviour patterns of different trader categories. Their work, which analyzed over a decade of COT data across multiple commodity markets, revealed a fascinating dynamic that challenges much of what retail traders are taught. Commercial hedgers consistently positioned themselves against market extremes, buying when speculators were most bearish and selling when speculators reached peak bullishness. The contrarian positioning of commercials was not random noise but rather reflected their superior information about supply and demand fundamentals. Meanwhile, large speculators, primarily hedge funds and commodity trading advisors, exhibited strong trend-following behaviour that often amplified market moves beyond fundamental values. Small traders, the retail participants, consistently entered positions late in trends, frequently near turning points, making them reliable contrary indicators.
Wang (2003) extended this research by demonstrating that the predictive power of commercial positioning varies significantly across different commodity sectors. His analysis of agricultural commodities showed particularly strong forecasting ability, with commercial net positions explaining up to fifteen percent of return variance in subsequent weeks. This finding suggests that the informational advantages of hedgers are most pronounced in markets where physical supply and demand fundamentals dominate, as opposed to purely financial markets where information asymmetries are smaller. When a corn farmer hedges six months of expected harvest, that decision incorporates private observations about rainfall patterns, crop health, pest pressure, and local storage capacity that no distant analyst can match. When an oil refinery hedges crude oil purchases and gasoline sales simultaneously, the spread relationships reveal expectations about refining margins that reflect operational realities invisible in public data.
The theoretical mechanism underlying these empirical patterns relates to information asymmetry and different participant motivations. Commercial hedgers engage in futures markets not for speculative profit but to manage business risks. An agricultural producer selling forward six months of expected harvest is not making a bet on price direction but rather locking in revenue to facilitate financial planning and ensure business viability. However, this hedging activity necessarily incorporates private information about expected supply, inventory levels, weather conditions, and demand trends that the hedger observes through their commercial operations (Irwin and Sanders, 2012). When aggregated across many participants, this private information manifests in collective positioning.
Consider a gold mining company deciding how much forward production to hedge. Management must estimate ore grades, recovery rates, production costs, equipment reliability, labor availability, and dozens of other operational variables that determine whether locking in prices at current levels makes business sense. If the industry collectively hedges more aggressively than usual, it suggests either exceptional production expectations or concern about sustaining current price levels or combination of both. Either way, this positioning reveals information unavailable to speculators analyzing price charts and economic data. The hedger sees the physical reality behind the financial abstraction.
Large speculators operate under entirely different incentives and constraints. Commodity Trading Advisors managing billions in assets typically employ systematic, trend-following strategies that respond to price momentum rather than fundamental supply and demand. When crude oil rallies from sixty dollars to seventy dollars per barrel, these systems generate buy signals. As the rally continues to eighty dollars, position sizes increase. The strategy works brilliantly during sustained trends but becomes a liability at reversals. By the time oil reaches ninety dollars, trend-following funds are maximally long, having accumulated positions progressively throughout the rally. At this point, they represent not smart money anticipating further gains but rather crowded money vulnerable to reversal. Sanders, Boris and Manfredo (2004) documented this pattern across multiple energy markets, showing that extreme speculator positioning typically marked late-stage trend exhaustion rather than early-stage trend development.
Small traders, the retail participants who fall below reporting thresholds, display the weakest forecasting ability. Wang (2003) found that small trader positioning exhibited negative correlation with subsequent returns, meaning their aggregate positioning served as a reliable contrary indicator. The explanation combines several factors. Retail traders often lack the capital reserves to weather normal market volatility, leading to premature exits from positions that would eventually prove profitable. They tend to receive information through slower channels, entering trends after mainstream media coverage when institutional participants are preparing to exit. Perhaps most importantly, they trade with emotion, buying into euphoria and selling into panic at precisely the wrong times.
At major turning points, the three groups often position opposite each other with commercials extremely bearish, large speculators extremely bullish, and small traders piling into longs at the last moment. These high-divergence environments frequently precede increased volatility and trend reversals. The insiders with business exposure quietly exit as the momentum traders hit maximum capacity and retail enthusiasm peaks. Within weeks, the reversal begins, and positions unwind in the opposite sequence.
FROM RAW DATA TO ACTIONABLE SIGNALS
The COT Index indicator operationalizes these academic findings into a practical trading tool accessible through TradingView. At its core, the indicator normalizes net positioning data onto a zero to one hundred scale, creating what we call the COT Index. This normalization is critical because absolute position sizes vary dramatically across different futures contracts and over time. A commercial trader holding fifty thousand contracts net long in crude oil might be extremely bullish by historical standards, or it might be quite neutral depending on the context of total market size and historical ranges. Raw position numbers mean nothing without context. The COT Index solves this problem by calculating where current positioning stands relative to its range over a specified lookback period, typically two hundred fifty-two weeks or approximately five years of weekly data.
The mathematical transformation follows the methodology originally popularized by legendary trader Larry Williams, though the underlying concept appears in statistical normalization techniques across many fields. For any given trader category, we calculate the highest and lowest net position values over the lookback period, establishing the historical range for that specific market and trader group. Current positioning is then expressed as a percentage of this range, where zero represents the most bearish positioning ever seen in the lookback window and one hundred represents the most bullish extreme. A reading of fifty indicates positioning exactly in the middle of the historical range, suggesting neither extreme optimism nor pessimism relative to recent history (Williams and Noseworthy, 2009).
This index-based approach allows for meaningful comparison across different markets and time periods, overcoming the scaling problems inherent in analyzing raw position data. A commercial index reading of eighty-five in gold carries the same interpretive meaning as an eighty-five reading in wheat or crude oil, even though the absolute position sizes differ by orders of magnitude. This standardization enables systematic analysis across entire futures portfolios rather than requiring market-specific expertise for each contract.
The lookback period selection involves a fundamental tradeoff between responsiveness and stability. Shorter lookback periods, perhaps one hundred twenty-six weeks or approximately two and a half years, make the index more sensitive to recent positioning changes. However, it also increases noise and produces more false signals. Longer lookback periods, perhaps five hundred weeks or approximately ten years, create smoother readings that filter short-term noise but become slower to recognize regime changes. The indicator settings allow users to adjust this parameter based on their trading timeframe, risk tolerance, and market characteristics.
UNDERSTANDING CFTC DATA STRUCTURES
The indicator supports both Legacy and Disaggregated COT report formats, reflecting the evolution of CFTC reporting standards over decades of market development. Legacy reports categorize market participants into three broad groups: commercial traders (hedgers with underlying business exposure), non-commercial traders (large speculators seeking profit without commercial interest), and non-reportable traders (small speculators below reporting thresholds). Each category brings distinct motivations and information advantages to the market (CFTC, 2020).
The Disaggregated reports, introduced in September 2009 for physical commodity markets, provide finer granularity by splitting participants into five categories (CFTC, 2009). Producer and merchant positions capture those actually producing, processing, or merchandising the physical commodity. Swap dealers represent financial intermediaries facilitating derivative transactions for clients. Managed money includes commodity trading advisors and hedge funds executing systematic or discretionary strategies. Other reportables encompasses diverse participants not fitting the main categories. Small traders remain as the fifth group, representing retail participation.
This enhanced categorization reveals nuances invisible in Legacy reports, particularly distinguishing between different types of institutional capital and their distinct behavioural patterns. The indicator automatically detects which report type is appropriate for each futures contract and adjusts the display accordingly.
Importantly, Disaggregated reports exist only for physical commodity futures. Agricultural commodities like corn, wheat, and soybeans have Disaggregated reports because clear producer, merchant, and swap dealer categories exist. Energy commodities like crude oil and natural gas similarly have well-defined commercial hedger categories. Metals including gold, silver, and copper also receive Disaggregated treatment (CFTC, 2009). However, financial futures such as equity index futures, Treasury bond futures, and currency futures remain available only in Legacy format. The CFTC has indicated no plans to extend Disaggregated reporting to financial futures due to different market structures and participant categories in these instruments (CFTC, 2020).
THE BEHAVIORAL FOUNDATION
Understanding which trader perspective to follow requires appreciation of their distinct trading styles, success rates, and psychological profiles. Commercial hedgers exhibit anticyclical behaviour rooted in their fundamental knowledge and business imperatives. When agricultural producers hedge forward sales during harvest season, they are not speculating on price direction but rather locking in revenue for crops they will harvest. Their business requires converting volatile commodity exposure into predictable cash flows to facilitate planning and ensure survival through difficult periods. Yet their aggregate positioning reveals valuable information because these hedging decisions incorporate private information about supply conditions, inventory levels, weather observations, and demand expectations that hedgers observe through their commercial operations (Bessembinder and Chan, 1992).
Consider a practical example from energy markets. Major oil companies continuously hedge portions of forward production based on price levels, operational costs, and financial planning needs. When crude oil trades at ninety dollars per barrel, they might aggressively hedge the next twelve months of production, locking in prices that provide comfortable profit margins above their extraction costs. This hedging appears as short positioning in COT reports. If oil rallies further to one hundred dollars, they hedge even more aggressively, viewing these prices as exceptional opportunities to secure revenue. Their short positioning grows increasingly extreme. To an outside observer watching only price charts, the rally suggests bullishness. But the commercial positioning reveals that the actual producers of oil find these prices attractive enough to lock in years of sales, suggesting skepticism about sustaining even higher levels. When the eventual reversal occurs and oil declines back to eighty dollars, the commercials who hedged at ninety and one hundred dollars profit while speculators who chased the rally suffer losses.
Large speculators or managed money traders operate under entirely different incentives and constraints. Their systematic, momentum-driven strategies mean they amplify existing trends rather than anticipate reversals. Trend-following systems, the most common approach among large speculators, by definition require confirmation of trend through price momentum before entering positions (Sanders, Boris and Manfredo, 2004). When crude oil rallies from sixty dollars to eighty dollars per barrel over several months, trend-following algorithms generate buy signals based on moving average crossovers, breakouts, and other momentum indicators. As the rally continues, position sizes increase according to the systematic rules.
However, this approach becomes a liability at turning points. By the time oil reaches ninety dollars after a sustained rally, trend-following funds are maximally long, having accumulated positions progressively throughout the move. At this point, their positioning does not predict continued strength. Rather, it often marks late-stage trend exhaustion. The psychological and mechanical explanation is straightforward. Trend followers by definition chase price momentum, entering positions after trends establish rather than anticipating them. Eventually, they become fully invested just as the trend nears completion, leaving no incremental buying power to sustain the rally. When the first signs of reversal appear, systematic stops trigger, creating a cascade of selling that accelerates the downturn.
Small traders consistently display the weakest track record across academic studies. Wang (2003) found that small trader positioning exhibited negative correlation with subsequent returns in his analysis across multiple commodity markets. This result means that whatever small traders collectively do, the opposite typically proves profitable. The explanation for small trader underperformance combines several factors documented in behavioral finance literature. Retail traders often lack the capital reserves to weather normal market volatility, leading to premature exits from positions that would eventually prove profitable. They tend to receive information through slower channels, learning about commodity trends through mainstream media coverage that arrives after institutional participants have already positioned. Perhaps most importantly, retail traders are more susceptible to emotional decision-making, buying into euphoria and selling into panic at precisely the wrong times (Tharp, 2008).
SETTINGS, THRESHOLDS, AND SIGNAL GENERATION
The practical implementation of the COT Index requires understanding several key features and settings that users can adjust to match their trading style, timeframe, and risk tolerance. The lookback period determines the time window for calculating historical ranges. The default setting of two hundred fifty-two bars represents approximately one year on daily charts or five years on weekly charts, balancing responsiveness with stability. Conservative traders seeking only the most extreme, highest-probability signals might extend the lookback to five hundred bars or more. Aggressive traders seeking earlier entry and willing to accept more false positives might reduce it to one hundred twenty-six bars or even less for shorter-term applications.
The bullish and bearish thresholds define signal generation levels. Default settings of eighty and twenty respectively reflect academic research suggesting meaningful information content at these extremes. Readings above eighty indicate positioning in the top quintile of the historical range, representing genuine extremes rather than temporary fluctuations. Conversely, readings below twenty occupy the bottom quintile, indicating unusually bearish positioning (Briese, 2008).
However, traders must recognize that appropriate thresholds vary by market, trader category, and personal risk tolerance. Some futures markets exhibit wider positioning swings than others due to seasonal patterns, volatility characteristics, or participant behavior. Conservative traders seeking high-probability setups with fewer signals might raise thresholds to eighty-five and fifteen. Aggressive traders willing to accept more false positives for earlier entry could lower them to seventy-five and twenty-five.
The key is maintaining meaningful differentiation between bullish, neutral, and bearish zones. The default settings of eighty and twenty create a clear three-zone structure. Readings from zero to twenty represent bearish territory where the selected trader group holds unusually bearish positions. Readings from twenty to eighty represent neutral territory where positioning falls within normal historical ranges. Readings from eighty to one hundred represent bullish territory where the selected trader group holds unusually bullish positions.
The trading perspective selection determines which participant group the indicator follows, fundamentally shaping interpretation and signal meaning. For counter-trend traders seeking reversal opportunities, monitoring commercial positioning makes intuitive sense based on the academic research discussed earlier. When commercials reach extreme bearish readings below twenty, indicating unprecedented short positioning relative to recent history, they are effectively betting against the crowd. Given their informational advantages demonstrated by Bessembinder and Chan (1992), this contrarian stance often precedes major bottoms.
Trend followers might instead monitor large speculator positioning, but with inverted logic compared to commercials. When managed money reaches extreme bullish readings above eighty, the trend may be exhausting rather than accelerating. This seeming paradox reflects their late-cycle participation documented by Sanders, Boris and Manfredo (2004). Sophisticated traders thus use speculator extremes as fade signals, entering positions opposite to speculator consensus.
Small trader monitoring serves primarily as a contrary indicator for all trading styles. Extreme small trader bullishness above seventy-five or eighty typically warns of retail FOMO at market tops. Extreme small trader bearishness below twenty or twenty-five often marks capitulation bottoms where the last weak hands have sold.
VISUALIZATION AND USER INTERFACE
The visual design incorporates multiple elements working together to facilitate decision-making and maintain situational awareness during active trading. The primary COT Index line plots in bold with adjustable line width, defaulting to two pixels for clear visibility against busy price charts. An optional glow effect, controlled by a simple toggle, adds additional visual prominence through multiple plot layers with progressively increasing transparency and width.
A twenty-one period exponential moving average overlays the index line, providing trend context for positioning changes. When the index crosses above its moving average, it signals accelerating bullish sentiment among the selected trader group regardless of whether absolute positioning is extreme. Conversely, when the index crosses below its moving average, it signals deteriorating sentiment and potentially the beginning of a reversal in positioning trends.
The EMA provides a dynamic reference line for assessing positioning momentum. When the index trades far above its EMA, positioning is not only extreme in absolute terms but also building with momentum. When the index trades far below its EMA, positioning is contracting or reversing, which may indicate weakening conviction even if absolute levels remain elevated.
The data table positioned at the top right of the chart displays eleven metrics for each trader category, transforming the indicator from a simple index calculation into an analytical dashboard providing multidimensional market intelligence. Beyond the COT Index itself, users can monitor positioning extremity, which measures how unusual current levels are compared to historical norms using statistical techniques. The extremity metric clarifies whether a reading represents the ninety-fifth or ninety-ninth percentile, with values above two standard deviations indicating genuinely exceptional positioning.
Market power quantifies each group's influence on total open interest. This metric expresses each trader category's net position as a percentage of total market open interest. A commercial entity holding forty percent of total open interest commands significantly more influence than one holding five percent, making their positioning signals more meaningful.
Momentum and rate of change metrics reveal whether positions are building or contracting, providing early warning of potential regime shifts. Position velocity measures the rate of change in positioning changes, effectively a second derivative providing even earlier insight into inflection points.
Sentiment divergence highlights disagreements between commercial and speculative positioning. This metric calculates the absolute difference between normalized commercial and large speculator index values. Wang (2003) found that these high-divergence environments frequently preceded increased volatility and reversals.
The table also displays concentration metrics when available, showing how positioning is distributed among the largest handful of traders in each category. High concentration indicates a few dominant players controlling most of the positioning, while low concentration suggests broad-based participation across many traders.
THE ALERT SYSTEM AND MONITORING
The alert system, comprising five distinct alert conditions, enables systematic monitoring of dozens of futures markets without constant screen watching. The bullish and bearish COT signal alerts trigger when the index crosses user-defined thresholds, indicating the selected trader group has reached extreme positioning worthy of attention. These alerts fire in real-time as new weekly COT data publishes, typically Friday afternoon following the Tuesday measurement date.
Extreme positioning alerts fire at ninety and ten index levels, representing the top and bottom ten percent of the historical range, warning of particularly stretched readings that historically precede reversals with high probability. When commercials reach a COT Index reading below ten, they are expressing their most bearish stance in the entire lookback period.
The data staleness alert notifies users when COT reports have not updated for more than ten days, preventing reliance on outdated information for trading decisions. Government shutdowns or federal holidays can interrupt the normal Friday publication schedule. Using stale signals while believing them current creates dangerous false confidence.
The indicator's watermark information display positioned in the bottom right corner provides essential context at a glance. This persistent display shows the symbol and timeframe, the COT report date timestamp, days since last update, and the current signal state. A trader analyzing a potential short entry in crude oil can glance at the watermark to instantly confirm positioning context without interrupting analysis flow.
LIMITATIONS AND REALISTIC EXPECTATIONS
Practical application requires understanding both the indicator's considerable strengths and inherent limitations. COT data inherently lags price action by three days, as Tuesday positions are not published until Friday afternoon. This delay means the indicator cannot catch rapid intraday reversals or respond to surprise news events. Traders using the COT Index for timing entries must accept this latency and focus on swing trading and position trading timeframes where three-day lags matter less than in day trading or scalping.
The weekly publication schedule similarly makes the indicator unsuitable for short-term trading strategies requiring immediate feedback. The COT Index works best for traders operating on weekly or longer timeframes, where positioning shifts measured in weeks and months align with trading horizon.
Extreme COT readings can persist far longer than typical technical indicators suggest, testing the patience and capital reserves of traders attempting to fade them. When crude oil enters a sustained bull market driven by genuine supply disruptions, commercial hedgers may maintain bearish positioning for many months as prices grind higher. A commercial COT Index reading of fifteen indicating extreme bearishness might persist for three months while prices continue rallying before finally reversing. Traders without sufficient capital and risk tolerance to weather such drawdowns will exit prematurely, precisely when the signal is about to work (Irwin and Sanders, 2012).
Position sizing discipline becomes paramount when implementing COT-based strategies. Rather than risking large percentages of capital on individual signals, successful COT traders typically allocate modest position sizes across multiple signals, allowing some to take time to mature while others work more quickly.
The indicator also cannot overcome fundamental regime changes that alter the structural drivers of markets. If gold enters a true secular bull market driven by monetary debasement, commercial hedgers may remain persistently bearish as mining companies sell forward years of production at what they perceive as favorable prices. Their positioning indicates valuation concerns from a production cost perspective, but cannot stop prices from rising if investment demand overwhelms physical supply-demand balance.
Similarly, structural changes in market participation can alter the meaning of positioning extremes. The growth of commodity index investing in the two thousands brought massive passive long-only capital into futures markets, fundamentally changing typical positioning ranges. Traders relying on COT signals without recognizing this regime change would have generated numerous false bearish signals during the commodity supercycle from 2003 to 2008.
The research foundation supporting COT analysis derives primarily from commodity markets where the commercial hedger information advantage is most pronounced. Studies specifically examining financial futures like equity indices and bonds show weaker but still present effects. Traders should calibrate expectations accordingly, recognizing that COT analysis likely works better for crude oil, natural gas, corn, and wheat than for the S&P 500, Treasury bonds, or currency futures.
Another important limitation involves the reporting threshold structure. Not all market participants appear in COT data, only those holding positions above specified minimums. In markets dominated by a few large players, concentration metrics become critical for proper interpretation. A single large trader accounting for thirty percent of commercial positioning might skew the entire category if their individual circumstances are idiosyncratic rather than representative.
GOLD FUTURES DURING A HYPOTHETICAL MARKET CYCLE
Consider a practical example using gold futures during a hypothetical but realistic market scenario that illustrates how the COT Index indicator guides trading decisions through a complete market cycle. Suppose gold has rallied from fifteen hundred to nineteen hundred dollars per ounce over six months, driven by inflation concerns following aggressive monetary expansion, geopolitical uncertainty, and sustained buying by Asian central banks for reserve diversification.
Large speculators, operating primarily trend-following strategies, have accumulated increasingly bullish positions throughout this rally. Their COT Index has climbed progressively from forty-five to eighty-five. The table display shows that large speculators now hold net long positions representing thirty-two percent of total open interest, their highest in four years. Momentum indicators show positive readings, indicating positions are still building though at a decelerating rate. Position velocity has turned negative, suggesting the pace of position building is slowing.
Meanwhile, commercial hedgers have responded to the rally by aggressively selling forward production and inventory. Their COT Index has moved inversely to price, declining from fifty-five to twenty. This bearish commercial positioning represents mining companies locking in forward sales at prices they view as attractive relative to production costs. The table shows commercials now hold net short positions representing twenty-nine percent of total open interest, their most bearish stance in five years. Concentration metrics indicate this positioning is broadly distributed across many commercial entities, suggesting the bearish stance reflects collective industry view rather than idiosyncratic positioning by a single firm.
Small traders, attracted by mainstream financial media coverage of gold's impressive rally, have recently piled into long positions. Their COT Index has jumped from forty-five to seventy-eight as retail investors chase the trend. Television financial networks feature frequent segments on gold with bullish guests. Internet forums and social media show surging retail interest. This retail enthusiasm historically marks late-stage trend development rather than early opportunity.
The COT Index indicator, configured to monitor commercial positioning from a contrarian perspective, displays a clear bearish signal given the extreme commercial short positioning. The table displays multiple confirming metrics: positioning extremity shows commercials at the ninety-sixth percentile of bearishness, market power indicates they control twenty-nine percent of open interest, and sentiment divergence registers sixty-five, indicating massive disagreement between commercial hedgers and large speculators. This divergence, the highest in three years, places the market in the historically high-risk category for reversals.
The interpretation requires nuance and consideration of context beyond just COT data. Commercials are not necessarily predicting an imminent crash. Rather, they are hedging business operations at what they collectively view as favorable price levels. However, the data reveals they have sold unusually large quantities of forward production, suggesting either exceptional production expectations for the year ahead or concern about sustaining current price levels or combination of both. Combined with extreme speculator positioning indicating a crowded long trade, and small trader enthusiasm confirming retail FOMO, the confluence suggests elevated reversal risk even if the precise timing remains uncertain.
A prudent trader analyzing this situation might take several actions based on COT Index signals. Existing long positions could be tightened with closer stop losses. Profit-taking on a portion of long exposure could lock in gains while maintaining some participation. Some traders might initiate modest short positions as portfolio hedges, sizing them appropriately for the inherent uncertainty in timing reversals. Others might simply move to the sidelines, avoiding new long entries until positioning normalizes.
The key lesson from case study analysis is that COT signals provide probabilistic edges rather than deterministic predictions. They work over many observations by identifying higher-probability configurations, not by generating perfect calls on individual trades. A fifty-five percent win rate with proper risk management produces substantial profits over time, yet still means forty-five percent of signals will be premature or wrong. Traders must embrace this probabilistic reality rather than seeking the impossible goal of perfect accuracy.
INTEGRATION WITH TRADING SYSTEMS
Integration with existing trading systems represents a natural and powerful use case for COT analysis, adding a positioning dimension to price-based technical approaches or fundamental analytical frameworks. Few traders rely exclusively on a single indicator or methodology. Rather, they build systems that synthesize multiple information sources, with each component addressing different aspects of market behavior.
Trend followers might use COT extremes as regime filters, modifying position sizing or avoiding new trend entries when positioning reaches levels historically associated with reversals. Consider a classic trend-following system based on moving average crossovers and momentum breakouts. Integration of COT analysis adds nuance. When large speculator positioning exceeds ninety or commercial positioning falls below ten, the regime filter recognizes elevated reversal risk. The system might reduce position sizing by fifty percent for new signals during these high-risk periods (Kaufman, 2013).
Mean reversion traders might require COT signal confluence before fading extended moves. When crude oil becomes technically overbought and large speculators show extreme long positioning above eighty-five, both signals confirm. If only technical indicators show extremes while positioning remains neutral, the potential short signal is rejected, avoiding fades of trends with underlying institutional support (Kaufman, 2013).
Discretionary traders can monitor the indicator as a continuous awareness tool, informing bias and position sizing without dictating mechanical entries and exits. A discretionary trader might notice commercial positioning shifting from neutral to progressively more bullish over several months. This trend informs growing positive bias even without triggering mechanical signals.
Multi-timeframe analysis represents another powerful integration approach. A trader might use daily charts for trade execution and timing while monitoring weekly COT positioning for strategic context. When both timeframes align, highest-probability opportunities emerge.
Portfolio construction for futures traders can incorporate COT signals as an additional selection criterion. Markets showing strong technical setups AND favorable COT positioning receive highest allocations. Markets with strong technicals but neutral or unfavorable positioning receive reduced allocations.
ADVANCED METRICS AND INTERPRETATION
The metrics table transforms simple positioning data into multidimensional market intelligence. Position extremity, calculated as the absolute deviation from the historical mean normalized by standard deviation, helps identify truly unusual readings versus routine fluctuations. A reading above two standard deviations indicates ninety-fifth percentile or higher extremity. Above three standard deviations indicates ninety-ninth percentile or higher, genuinely rare positioning that historically precedes major events with high probability.
Market power, expressed as a percentage of total open interest, reveals whose positioning matters most from a mechanical market impact perspective. Consider two scenarios in gold futures. In scenario one, commercials show a COT Index reading of fifteen while their market power metric shows they hold net shorts representing thirty-five percent of open interest. This is a high-confidence bearish signal. In scenario two, commercials also show a reading of fifteen, but market power shows only eight percent. While positioning is extreme relative to this category's normal range, their limited market share means less mechanical influence on price.
The rate of change and momentum metrics highlight whether positions are accelerating or decelerating, often providing earlier warnings than absolute levels alone. A COT Index reading of seventy-five with rapidly building momentum suggests continued movement toward extremes. Conversely, a reading of eighty-five with decelerating or negative momentum indicates the positioning trend is exhausting.
Position velocity measures the rate of change in positioning changes, effectively a second derivative. When velocity shifts from positive to negative, it indicates that while positioning may still be growing, the pace of growth is slowing. This deceleration often precedes actual reversal in positioning direction by several weeks.
Sentiment divergence calculates the absolute difference between normalized commercial and large speculator index values. When commercials show extreme bearish positioning at twenty while large speculators show extreme bullish positioning at eighty, the divergence reaches sixty, representing near-maximum disagreement. Wang (2003) found that these high-divergence environments frequently preceded increased volatility and reversals. The mechanism is intuitive. Extreme divergence indicates the informed hedgers and momentum-following speculators have positioned opposite each other with conviction. One group will prove correct and profit while the other proves incorrect and suffers losses. The resolution of this disagreement through price movement often involves volatility.
The table also displays concentration metrics when available. High concentration indicates a few dominant players controlling most of the positioning within a category, while low concentration suggests broad-based participation. Broad-based positioning more reliably reflects collective market intelligence and industry consensus. If mining companies globally all independently decide to hedge aggressively at similar price levels, it suggests genuine industry-wide view about price valuations rather than circumstances specific to one firm.
DATA QUALITY AND RELIABILITY
The CFTC has maintained COT reporting in various forms since the nineteen twenties, providing nearly a century of positioning data across multiple market cycles. However, data quality and reporting standards have evolved substantially over this long period. Modern electronic reporting implemented in the late nineteen nineties and early two thousands significantly improved accuracy and timeliness compared to earlier paper-based systems.
Traders should understand that COT reports capture positions as of Tuesday's close each week. Markets remain open three additional days before publication on Friday afternoon, meaning the reported data is three days stale when received. During periods of rapid market movement or major news events, this lag can be significant. The indicator addresses this limitation by including timestamp information and staleness warnings.
The three-day lag creates particular challenges during extreme volatility episodes. Flash crashes, surprise central bank interventions, geopolitical shocks, and other high-impact events can completely transform market positioning within hours. Traders must exercise judgment about whether reported positioning remains relevant given intervening events.
Reporting thresholds also mean that not all market participants appear in disaggregated COT data. Traders holding positions below specified minimums aggregate into the non-reportable or small trader category. This aggregation affects different markets differently. In highly liquid contracts like crude oil with thousands of participants, reportable traders might represent seventy to eighty percent of open interest. In thinly traded contracts with only dozens of active participants, a few large reportable positions might represent ninety-five percent of open interest.
Another data quality consideration involves trader classification into categories. The CFTC assigns traders to commercial or non-commercial categories based on reported business purpose and activities. However, this process is not perfect. Some entities engage in both commercial and speculative activities, creating ambiguity about proper classification. The transition to Disaggregated reports attempted to address some of these ambiguities by creating more granular categories.
COMPARISON WITH ALTERNATIVE APPROACHES
Several alternative approaches to COT analysis exist in the trading community beyond the normalization methodology employed by this indicator. Some analysts focus on absolute position changes week-over-week rather than index-based normalization. This approach calculates the change in net positioning from one week to the next. The emphasis falls on momentum in positioning changes rather than absolute levels relative to history. This method potentially identifies regime shifts earlier but sacrifices cross-market comparability (Briese, 2008).
Other practitioners employ more complex statistical transformations including percentile rankings, z-score standardization, and machine learning classification algorithms. Ruan and Zhang (2018) demonstrated that machine learning models applied to COT data could achieve modest improvements in forecasting accuracy compared to simple threshold-based approaches. However, these gains came at the cost of interpretability and implementation complexity.
The COT Index indicator intentionally employs a relatively straightforward normalization methodology for several important reasons. First, transparency enhances user understanding and trust. Traders can verify calculations manually and develop intuitive feel for what different readings mean. Second, academic research suggests that most of the predictive power in COT data comes from extreme positioning levels rather than subtle patterns requiring complex statistical methods to detect. Third, robust methods that work consistently across many markets and time periods tend to be simpler rather than more complex, reducing the risk of overfitting to historical data. Fourth, the complexity costs of implementation matter for retail traders without programming teams or computational infrastructure.
PSYCHOLOGICAL ASPECTS OF COT TRADING
Trading based on COT data requires psychological fortitude that differs from momentum-based approaches. Contrarian positioning signals inherently mean betting against prevailing market sentiment and recent price action. When commercials reach extreme bearish positioning, prices have typically been rising, sometimes for extended periods. The price chart looks bullish, momentum indicators confirm strength, moving averages align positively. The COT signal says bet against all of this. This psychological difficulty explains why COT analysis remains underutilized relative to trend-following methods.
Human psychology strongly predisposes us toward extrapolation and recency bias. When prices rally for months, our pattern-matching brains naturally expect continued rally. The recent price action dominates our perception, overwhelming rational analysis about positioning extremes and historical probabilities. The COT signal asking us to sell requires overriding these powerful psychological impulses.
The indicator design attempts to support the required psychological discipline through several features. Clear threshold markers and signal states reduce ambiguity about when signals trigger. When the commercial index crosses below twenty, the signal is explicit and unambiguous. The background shifts to red, the signal label displays bearish, and alerts fire. This explicitness helps traders act on signals rather than waiting for additional confirmation that may never arrive.
The metrics table provides analytical justification for contrarian positions, helping traders maintain conviction during inevitable periods of adverse price movement. When a trader enters short positions based on extreme commercial bearish positioning but prices continue rallying for several weeks, doubt naturally emerges. The table display provides reassurance. Commercial positioning remains extremely bearish. Divergence remains high. The positioning thesis remains intact even though price action has not yet confirmed.
Alert functionality ensures traders do not miss signals due to inattention while also not requiring constant monitoring that can lead to emotional decision-making. Setting alerts for COT extremes enables a healthier relationship with markets. When meaningful signals occur, alerts notify them. They can then calmly assess the situation and execute planned responses.
However, no indicator design can completely overcome the psychological difficulty of contrarian trading. Some traders simply cannot maintain short positions while prices rally. For these traders, COT analysis might be better employed as an exit signal for long positions rather than an entry signal for shorts.
Ultimately, successful COT trading requires developing comfort with probabilistic thinking rather than certainty-seeking. The signals work over many observations by identifying higher-probability configurations, not by generating perfect calls on individual trades. A fifty-five or sixty percent win rate with proper risk management produces substantial profits over years, yet still means forty to forty-five percent of signals will be premature or wrong. COT analysis provides genuine edge, but edge means probability advantage, not elimination of losing trades.
EDUCATIONAL RESOURCES AND CONTINUOUS LEARNING
The indicator provides extensive built-in educational resources through its documentation, detailed tooltips, and transparent calculations. However, mastering COT analysis requires study beyond any single tool or resource. Several excellent resources provide valuable extensions of the concepts covered in this guide.
Books and practitioner-focused monographs offer accessible entry points. Stephen Briese published The Commitments of Traders Bible in two thousand eight, offering detailed breakdowns of how different markets and trader categories behave (Briese, 2008). Briese's work stands out for its empirical focus and market-specific insights. Jack Schwager includes discussion of COT analysis within the broader context of market behavior in his book Market Sense and Nonsense (Schwager, 2012). Perry Kaufman's Trading Systems and Methods represents perhaps the most rigorous practitioner-focused text on systematic trading approaches including COT analysis (Kaufman, 2013).
Academic journal articles provide the rigorous statistical foundation underlying COT analysis. The Journal of Futures Markets regularly publishes research on positioning data and its predictive properties. Bessembinder and Chan's earlier work on systematic risk, hedging pressure, and risk premiums in futures markets provides theoretical foundation (Bessembinder, 1992). Chang's examination of speculator returns provides historical context (Chang, 1985). Irwin and Sanders provide essential skeptical perspective in their two thousand twelve article (Irwin and Sanders, 2012). Wang's two thousand three article provides one of the most empirical analyses of COT data across multiple commodity markets (Wang, 2003).
Online resources extend beyond academic and book-length treatments. The CFTC website provides free access to current and historical COT reports in multiple formats. The explanatory materials section offers detailed documentation of report construction, category definitions, and historical methodology changes. Traders serious about COT analysis should read these official CFTC documents to understand exactly what they are analyzing.
Commercial COT data services such as Barchart provide enhanced visualization and analysis tools beyond raw CFTC data. TradingView's educational materials, published scripts library, and user community provide additional resources for exploring different approaches to COT analysis.
The key to mastering COT analysis lies not in finding a single definitive source but rather in building understanding through multiple perspectives and information sources. Academic research provides rigorous empirical foundation. Practitioner-focused books offer practical implementation insights. Direct engagement with data through systematic backtesting develops intuition about how positioning dynamics manifest across different market conditions.
SYNTHESIZING KNOWLEDGE INTO PRACTICE
The COT Index indicator represents the synthesis of academic research, trading experience, and software engineering into a practical tool accessible to retail traders equipped with nothing more than a TradingView account and willingness to learn. What once required expensive data subscriptions, custom programming capabilities, statistical software, and institutional resources now appears as a straightforward indicator requiring only basic parameter selection and modest study to understand. This democratization of institutional-grade analysis tools represents a broader trend in financial markets over recent decades.
Yet technology and data access alone provide no edge without understanding and discipline. Markets remain relentlessly efficient at eliminating edges that become too widely known and mechanically exploited. The COT Index indicator succeeds only when users invest time learning the underlying concepts, understand the limitations and probability distributions involved, and integrate signals thoughtfully into trading plans rather than applying them mechanically.
The academic research demonstrates conclusively that institutional positioning contains genuine information about future price movements, particularly at extremes where commercial hedgers are maximally bearish or bullish relative to historical norms. This informational content is neither perfect nor deterministic but rather probabilistic, providing edge over many observations through identification of higher-probability configurations. Bessembinder and Chan's finding that commercial positioning explained modest but significant variance in future returns illustrates this probabilistic nature perfectly (Bessembinder and Chan, 1992). The effect is real and statistically significant, yet it explains perhaps ten to fifteen percent of return variance rather than most variance. Much of price movement remains unpredictable even with positioning intelligence.
The practical implication is that COT analysis works best as one component of a trading system rather than a standalone oracle. It provides the positioning dimension, revealing where the smart money has positioned and where the crowd has followed, but price action analysis provides the timing dimension. Fundamental analysis provides the catalyst dimension. Risk management provides the survival dimension. These components work together synergistically.
The indicator's design philosophy prioritizes transparency and education over black-box complexity, empowering traders to understand exactly what they are analyzing and why. Every calculation is documented and user-adjustable. The threshold markers, background coloring, tables, and clear signal states provide multiple reinforcing channels for conveying the same information.
This educational approach reflects a conviction that sustainable trading success comes from genuine understanding rather than mechanical system-following. Traders who understand why commercial positioning matters, how different trader categories behave, what positioning extremes signify, and where signals fit within probability distributions can adapt when market conditions change. Traders mechanically following black-box signals without comprehension abandon systems after normal losing streaks.
The research foundation supporting COT analysis comes primarily from commodity markets where commercial hedger informational advantages are most pronounced. Agricultural producers hedging crops know more about supply conditions than distant speculators. Energy companies hedging production know more about operating costs than financial traders. Metals miners hedging output know more about ore grades than index funds. Financial futures markets show weaker but still present effects.
The journey from reading this documentation to profitable trading based on COT analysis involves several stages that cannot be rushed. Initial reading and basic understanding represents the first stage. Historical study represents the second stage, reviewing past market cycles to observe how positioning extremes preceded major turning points. Paper trading or small-size real trading represents the third stage to experience the psychological challenges. Refinement based on results and personal psychology represents the fourth stage.
Markets will continue evolving. New participant categories will emerge. Regulatory structures will change. Technology will advance. Yet the fundamental dynamics driving COT analysis, that different market participants have different information, different motivations, and different forecasting abilities that manifest in their positioning, will persist as long as futures markets exist. While specific thresholds or optimal parameters may shift over time, the core logic remains sound and adaptable.
The trader equipped with this indicator, understanding of the theory and evidence behind COT analysis, realistic expectations about probability rather than certainty, discipline to maintain positions through adverse volatility, and patience to allow signals time to develop possesses genuine edge in markets. The edge is not enormous, markets cannot allow large persistent inefficiencies without arbitraging them away, but it is real, measurable, and exploitable by those willing to invest in learning and disciplined application.
REFERENCES
Bessembinder, H. (1992) Systematic risk, hedging pressure, and risk premiums in futures markets, Review of Financial Studies, 5(4), pp. 637-667.
Bessembinder, H. and Chan, K. (1992) The profitability of technical trading rules in the Asian stock markets, Pacific-Basin Finance Journal, 3(2-3), pp. 257-284.
Briese, S. (2008) The Commitments of Traders Bible: How to Profit from Insider Market Intelligence. Hoboken: John Wiley & Sons.
Chang, E.C. (1985) Returns to speculators and the theory of normal backwardation, Journal of Finance, 40(1), pp. 193-208.
Commodity Futures Trading Commission (CFTC) (2009) Explanatory Notes: Disaggregated Commitments of Traders Report. Available at: www.cftc.gov (Accessed: 15 January 2025).
Commodity Futures Trading Commission (CFTC) (2020) Commitments of Traders: About the Report. Available at: www.cftc.gov (Accessed: 15 January 2025).
Irwin, S.H. and Sanders, D.R. (2012) Testing the Masters Hypothesis in commodity futures markets, Energy Economics, 34(1), pp. 256-269.
Kaufman, P.J. (2013) Trading Systems and Methods. 5th edn. Hoboken: John Wiley & Sons.
Ruan, Y. and Zhang, Y. (2018) Forecasting commodity futures prices using machine learning: Evidence from the Chinese commodity futures market, Applied Economics Letters, 25(12), pp. 845-849.
Sanders, D.R., Boris, K. and Manfredo, M. (2004) Hedgers, funds, and small speculators in the energy futures markets: an analysis of the CFTC's Commitments of Traders reports, Energy Economics, 26(3), pp. 425-445.
Schwager, J.D. (2012) Market Sense and Nonsense: How the Markets Really Work and How They Don't. Hoboken: John Wiley & Sons.
Tharp, V.K. (2008) Super Trader: Make Consistent Profits in Good and Bad Markets. New York: McGraw-Hill.
Wang, C. (2003) The behavior and performance of major types of futures traders, Journal of Futures Markets, 23(1), pp. 1-31.
Williams, L.R. and Noseworthy, M. (2009) The Right Stock at the Right Time: Prospering in the Coming Good Years. Hoboken: John Wiley & Sons.
FURTHER READING
For traders seeking to deepen their understanding of COT analysis and futures market positioning beyond this documentation, the following resources provide valuable extensions:
Academic Journal Articles:
Fishe, R.P.H. and Smith, A. (2012) Do speculators drive commodity prices away from supply and demand fundamentals?, Journal of Commodity Markets, 1(1), pp. 1-16.
Haigh, M.S., Hranaiova, J. and Overdahl, J.A. (2007) Hedge funds, volatility, and liquidity provision in energy futures markets, Journal of Alternative Investments, 9(4), pp. 10-38.
Kocagil, A.E. (1997) Does futures speculation stabilize spot prices? Evidence from metals markets, Applied Financial Economics, 7(1), pp. 115-125.
Sanders, D.R. and Irwin, S.H. (2011) The impact of index funds in commodity futures markets: A systems approach, Journal of Alternative Investments, 14(1), pp. 40-49.
Books and Practitioner Resources:
Murphy, J.J. (1999) Technical Analysis of the Financial Markets: A Guide to Trading Methods and Applications. New York: New York Institute of Finance.
Pring, M.J. (2002) Technical Analysis Explained: The Investor's Guide to Spotting Investment Trends and Turning Points. 4th edn. New York: McGraw-Hill.
Federal Reserve and Research Institution Publications:
Federal Reserve Banks regularly publish working papers examining commodity markets, futures positioning, and price discovery mechanisms. The Federal Reserve Bank of San Francisco and Federal Reserve Bank of Kansas City maintain active research programs in this area.
Online Resources:
The CFTC website provides free access to current and historical COT reports, explanatory materials, and regulatory documentation.
Barchart offers enhanced COT data visualization and screening tools.
TradingView's community library contains numerous published scripts and educational materials exploring different approaches to positioning analysis.
Indicatore Pine Script®
COT Non-Commercial Net PositionsThis indicator displays the net position of Non-Commercial traders (speculators) in futures markets by subtracting short positions from long positions, based on CFTC COT data. It fetches the relevant COT long and short values weekly (or as per the user-selected timeframe) and plots the net positions relative to zero.
Indicatore Pine Script®
Position Sizing Risk TablePosition Sizing Risk Table - swing trading. Allowing for a 0,25; 0,5 and 1% risk based on NAV
Indicatore Pine Script®
Info TableOverview
The Info Table V1 is a versatile TradingView indicator tailored for intraday futures traders, particularly those focusing on MESM2 (Micro E-mini S&P 500 futures) on 1-minute charts. It presents essential market insights through two customizable tables: the Main Table for predictive and macro metrics, and the New Metrics Table for momentum and volatility indicators. Designed for high-activity sessions like 9:30 AM–11:00 AM CDT, this tool helps traders assess price alignment, sentiment, and risk in real-time. Metrics update dynamically (except weekly COT data), with optional alerts for key conditions like volatility spikes or momentum shifts.
This indicator builds on foundational concepts like linear regression for predictions and adapts open-source elements for enhanced functionality. Gradient code is adapted from TradingView's Color Library. QQE logic is adapted from LuxAlgo's QQE Weighted Oscillator, licensed under CC BY-NC-SA 4.0. The script is released under the Mozilla Public License 2.0.
Key Features
Two Customizable Tables: Positioned independently (e.g., top-right for Main, bottom-right for New Metrics) with toggle options to show/hide for a clutter-free chart.
Gradient Coloring: User-defined high/low colors (default green/red) for quick visual interpretation of extremes, such as overbought/oversold or high volatility.
Arrows for Directional Bias: In the New Metrics Table, up (↑) or down (↓) arrows appear in value cells based on metric thresholds (top/bottom 25% of range), indicating bullish/high or bearish/low conditions.
Consensus Highlighting: The New Metrics Table's title cells ("Metric" and "Value") turn green if all arrows are ↑ (strong bullish consensus), red if all are ↓ (strong bearish consensus), or gray otherwise.
Predicted Price Plot: Optional line (default blue) overlaying the ML-predicted price for visual comparison with actual price action.
Alerts: Notifications for high/low Frahm Volatility (≥8 or ≤3) and QQE Bias crosses (bullish/bearish momentum shifts).
Main Table Metrics
This table focuses on predictive, positional, and macro insights:
ML-Predicted Price: A linear regression forecast using normalized price, volume, and RSI over a customizable lookback (default 500 bars). Gradient scales from low (red) to high (green) relative to the current price ± threshold (default 100 points).
Deviation %: Percentage difference between current price and predicted price. Gradient highlights extremes (±0.5% default threshold), signaling potential overextensions.
VWAP Deviation %: Percentage difference from Volume Weighted Average Price (VWAP). Gradient indicates if price is above (green) or below (red) fair value (±0.5% default).
FRED UNRATE % Change: Percentage change in U.S. unemployment rate (via FRED data). Cell turns red for increases (economic weakness), green for decreases (strength), gray if zero or disabled.
Open Interest: Total open MESM2 futures contracts. Gradient scales from low (red) to high (green) up to a hardcoded 300,000 threshold, reflecting market participation.
COT Commercial Long/Short: Weekly Commitment of Traders data for commercial positions. Long cell green if longs > shorts (bullish institutional sentiment); Short cell red if shorts > longs (bearish); gray otherwise.
New Metrics Table Metrics
This table emphasizes technical momentum and volatility, with arrows for quick bias assessment:
QQE Bias: Smoothed RSI vs. trailing stop (default length 14, factor 4.236, smooth 5). Green for bullish (RSI > stop, ↑ arrow), red for bearish (RSI < stop, ↓ arrow), gray for neutral.
RSI: Relative Strength Index (default period 14). Gradient from oversold (red, <30 + threshold offset, ↓ arrow if ≤40) to overbought (green, >70 - offset, ↑ arrow if ≥60).
ATR Volatility: Score (1–20) based on Average True Range (default period 14, lookback 50). High scores (green, ↑ if ≥15) signal swings; low (red, ↓ if ≤5) indicate calm.
ADX Trend: Average Directional Index (default period 14). Gradient from weak (red, ↓ if ≤0.25×25 threshold) to strong trends (green, ↑ if ≥0.75×25).
Volume Momentum: Score (1–20) comparing current to historical volume (lookback 50). High (green, ↑ if ≥15) suggests pressure; low (red, ↓ if ≤5) implies weakness.
Frahm Volatility: Score (1–20) from true range over a window (default 24 hours, multiplier 9). Dynamic gradient (green/red/yellow); ↑ if ≥7.5, ↓ if ≤2.5.
Frahm Avg Candle (Ticks): Average candle size in ticks over the window. Blue gradient (or dynamic green/red/yellow); ↑ if ≥0.75 percentile, ↓ if ≤0.25.
Arrows trigger on metric-specific logic (e.g., RSI ≥60 for ↑), providing directional cues without strict color ties.
Customization Options
Adapt the indicator to your strategy:
ML Inputs: Lookback (10–5000 bars) and RSI period (2+) for prediction sensitivity—shorter for volatility, longer for trends.
Timeframes: Individual per metric (e.g., 1H for QQE Bias to match higher frames; blank for chart timeframe).
Thresholds: Adjust gradients and arrows (e.g., Deviation 0.1–5%, ADX 0–100, RSI overbought/oversold).
QQE Settings: Length, factor, and smooth for fine-tuned momentum.
Data Toggles: Enable/disable FRED, Open Interest, COT for focus (e.g., disable macro for pure intraday).
Frahm Options: Window hours (1+), scale multiplier (1–10), dynamic colors for avg candle.
Plot/Table: Line color, positions, gradients, and visibility.
Ideal Use Case
Perfect for MESM2 scalpers and trend traders. Use the Main Table for entry confirmation via predicted deviations and institutional positioning. Leverage the New Metrics Table arrows for short-term signals—enter bullish on green consensus (all ↑), avoid chop on low volatility. Set alerts to catch shifts without constant monitoring.
Why It's Valuable
Info Table V1 consolidates diverse metrics into actionable visuals, answering critical questions: Is price mispriced? Is momentum aligning? Is volatility manageable? With real-time updates, consensus highlights, and extensive customization, it enhances precision in fast markets, reducing guesswork for confident trades.
Note: Optimized for futures; some metrics (OI, COT) unavailable on non-futures symbols. Test on demo accounts. No financial advice—use at your own risk.
The provided script reuses open-source elements from TradingView's Color Library and LuxAlgo's QQE Weighted Oscillator, as noted in the script comments and description. Credits are appropriately given in both the description and code comments, satisfying the requirement for attribution.
Regarding significant improvements and proportion:
The QQE logic comprises approximately 15 lines of code in a script exceeding 400 lines, representing a small proportion (<5%).
Adaptations include integration with multi-timeframe support via request.security, user-customizable inputs for length, factor, and smooth, and application within a broader table-based indicator for momentum bias display (with color gradients, arrows, and alerts). This extends the original QQE beyond standalone oscillator use, incorporating it as one of seven metrics in the New Metrics Table for confluence analysis (e.g., consensus highlighting when all metrics align). These are functional enhancements, not mere stylistic or variable changes.
The Color Library usage is via official import (import TradingView/Color/1 as Color), leveraging built-in gradient functions without copying code, and applied to enhance visual interpretation across multiple metrics.
The script complies with the rules: reused code is minimal, significantly improved through integration and expansion, and properly credited. It qualifies for open-source publication under the Mozilla Public License 2.0, as stated.
Indicatore Pine Script®
Briese CoT Movement IndexThis Briese CoT (Commitments of Traders) Movement Index histogram indicator was built based on the formula by Stephen Briese in his book "The Commitments of Traders Bible":
"...difference between the COT Index and its reading of one or several weeks prior. I use six." —Chapter 7, page 75.
The code is a bit of a remix of the "ICT Commitment of Traders°" indicator by toodegrees and is meant for use in a new pane below a Weekly Chart .
The upper and lower thresholds are +40/-40. Some context: "A ± 40 point surge in the COT Index within a six-week period frequently marks the end of a counter-trend price reaction"
40 Point CoT Surge Rules (Commercials) from page 76
"During a correction from a prevailing uptrend, a +40 point movement in the CoT Index within a six-week period often marks the end of a corrective pullback, and the resumption of the major uptrend."
"During a reaction in a prevailing downtrend, a -40 point movement in the CoT Index within a six-week period frequently marks the end of a price reaction, and the resumption of the established downtrend."
"The failure of a ± point CoT Movement Index signal to restart the prevailing trend is a tip-off to a major trend change"
I'd recommend reading Briese's book for examples on how to properly interpret this indictor.
This indicator can be used in conjunction with another one I've published called the "Williams x Briese Hybrid CoT Index" which can be found on my scripts page.
Indicatore Pine Script®
Planting & Harvesting SeasonsHello all,
as a commodity trader, I use a lot of seasonal patterns in my analysis. Some time ago, I came up with the idea to develop a simple script that visually overlays the typical planting and harvesting periods for key agricultural futures directly on the chart.
This script automatically detects the underlying commodity based on the symbol (e.g. ZC, ZW, ZS, CT) and displays color-coded zones for each seasonal window. These zones are based on historical crop calendars and help identify when planting or harvesting typically takes place. The goal is to better align technical setups with fundamental seasonal factors.
This is a basic version and meant as a visual aid — not a trading signal in itself.
Hope you enjoy it and any feedback is highly appreciated!
Indicatore Pine Script®
High-Impact News Events with ALERTHigh-Impact News Events with ALERT
This indicator is builds upon the original by adding alert capabilities, allowing traders to receive notifications before and after economic events to manage risk effectively.
This indicator is updated version of the Live Economic Calendar by @toodegrees ( ) which allows user to set alert for the news events.
Key Features
Customizable Alert Selection: Users can choose which impact levels to restrict (High, Medium, Low).
User-Defined Restriction Timing: Set alerts to X minutes before or after the event.
Real-Time Economic Event Detection: Fetches live news data from Forex Factory.
Multi-Event Support: Detects and processes multiple news events dynamically.
Automatic Trading Restriction: user can use this script to stop trades in news events.
Visual Markers:
Vertical dashed lines indicate the start and end of restriction periods.
Background color changes during restricted trading times.
Alerts notify traders during the news events.
How It Works
The user selects which news impact levels should restrict trading.
The script retrieves real-time economic event data from Forex Factory.
Trading can be restricted for X minutes before and after each event.
The script highlights restricted periods with a background color.
Alerts notify traders all time during the news events is active as per the defined time to prevent unexpected volatility exposure.
Customization Options
Choose which news impact levels (High, Medium, Low) should trigger trading restrictions.
Define time limits before and after each news event for restriction.
Enable or disable alerts for restricted trading periods.
How to Use
Apply the indicator to any TradingView chart.
Configure the news event impact levels you want to restrict.
Set the pre- and post-event restriction durations as needed.
The indicator will automatically apply restrictions, plot visual markers, and trigger alerts accordingly.
Limitations
This script relies on Forex Factory data and may have occasional update delays.
TradingView does not support external API connections, so data is updated through internal methods.
The indicator does not execute trades automatically; it only provides visual alerts and restriction signals.
Reference & Credit
This script is based on the Live Economic Calendar by @toodegrees ( ), adding enhanced pre- and post-event alerting capabilities to help traders prepare for market-moving news.
Disclaimer
This script is for informational purposes only and does not constitute financial advice. Users should verify economic data independently and exercise caution when trading around news events. Past performance is not indicative of future results.
Indicatore Pine Script®
The Commitment of Traders (COT) IndexThe COT Index indicator is used to measure the positioning of different market participants (Large Traders, Small Traders, and Commercial Hedgers) relative to their historical positioning over a specified lookback period. It helps traders identify extreme positioning, which can signal potential reversals or trend continuations.
Key Features of the Indicator:
COT Data Retrieval
The script pulls COT report data from the TradingView COT Library TradingView/LibraryCOT/3).
It retrieves long and short positions for three key groups:
Large Traders (Non-commercial positions) – Speculators such as hedge funds.
Small Traders (Non-reportable positions) – Small retail traders.
Commercial Hedgers (Commercial positions) – Institutions that hedge real-world positions.
Threshold Zones for Extreme Positioning:
Upper Zone Threshold (Default: 90%)
Signals potential overbought conditions (excessive buying).
Lower Zone Threshold (Default: 10%)
Signals potential oversold conditions (excessive selling).
The indicator plots these zones using horizontal lines.
The COT Index should be used in conjunction with technical analysis (support/resistance, trends, etc.). A high COT Index does not mean the market will reverse immediately—it’s an indication of extreme sentiment.
Note:
If the script does not recognize or can't find the ticker currently viewed in the COT report, the COT indicator will default to U.S. Dollar.
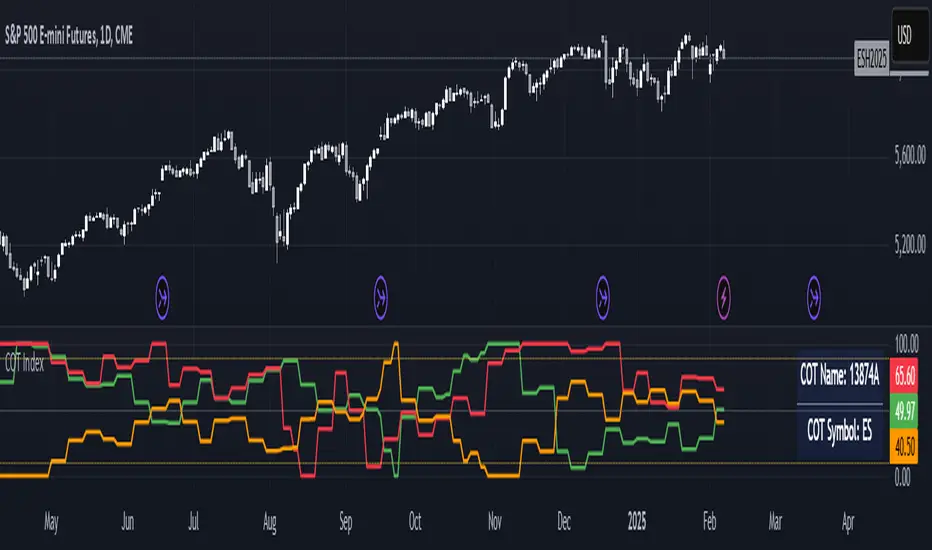
Indicatore Pine Script®