inwCoin CCI Risk% Strategy=========================
English
=========================
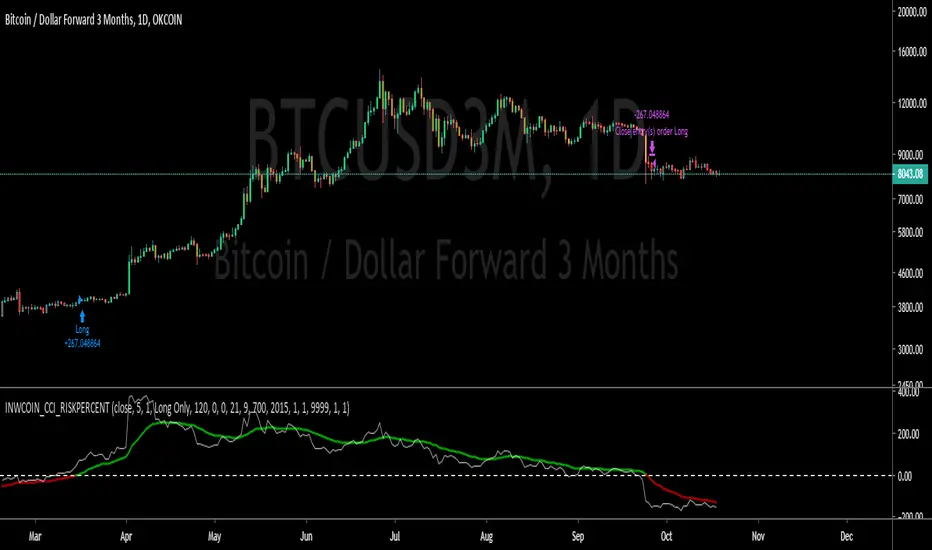
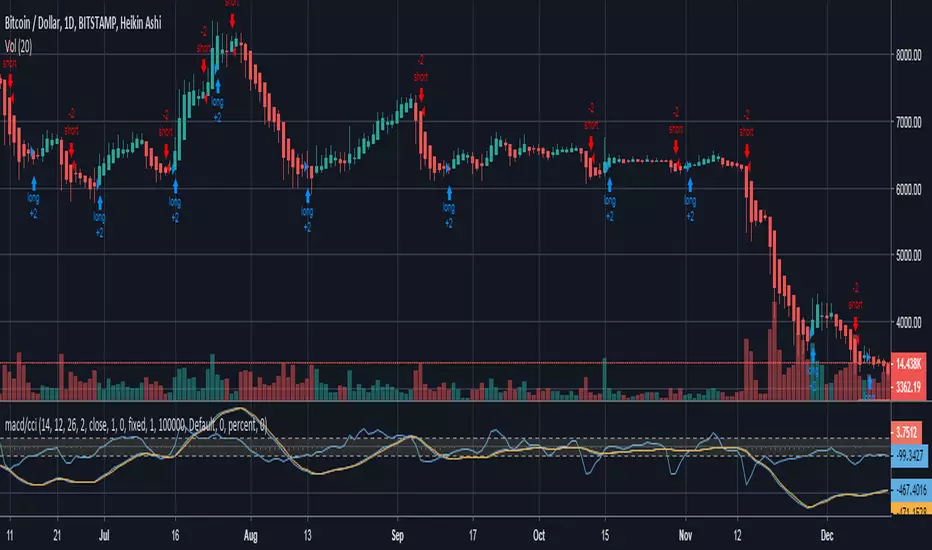
inwCoin CCI Risk% Strategy using CCI ( Commodity channel index ) and EMA of CCI to determine entry/ exit.
It's very good trend following strategy that it will not exit until the trend completely change.
Buy = EMA of CCI cross above 0
Sell = EMA of CCI cross under 0
You can adjust each parameters to see how's working for your setup.
==========================
Thai
==========================
inwCoin CCI Risk% Strategy ตัวนี้ผมเอา CCI มาช่วยในการหาจุดเข้าและจุดออก
โดยผมจะเอา EMA มาใส่ CCI ซ้อนไปอีกที เพื่อหาจุดเข้าและออกครับ
หลังจาก backtest แล้วก็พบว่า เป็นตัว trend following strategy ที่ค่อนข้างจับ trend ได้อยู่หมัด ( คือไม่ยอมออกง่ายๆ ถ้าราคาไม่หัวปักหนักๆ จริงๆ )
ตอนนี้ สำหรับ BTC ก็อย่างที่เห็น ว่า confirm trend ขาลงแล้ว .. หลังจากนี้ก็คงได้แต่รอการลงแรงๆ เพื่อปิดฉากขาลงสักรอบ แล้วค่อยขึ้นใหม่ 555
Indice Commodity Channel (CCI)
HA_CCI Long onlyStratégie calculée sur le croisement d'in CCI lent et d'un CCI Rapide
Le CCI est calculé sur la cloture de bougie henki hashi

The K2 v2.0 StrategyThe updated version of THE K2 is finally here! A lot of changes were made when creating the second version of the K2, but the result was a much higher level of performance.
The new K2 consists of a 1 minute 'fast' CCI and 15 minute slow CCI. We identified key thresholds for each one to construct a more complex trading approach. The green shapes on the chart represent buy signals and the red shapes are sell signals. The text above them is the percentage of equity used in each trade. These percentages are based on the CCI's position relative to the fixed thresholds. By doing this, the strategy achieves a higher frequency of trades and lower max drawdown.
Here's a guide to help understand the various shapes:
Circles: Slow CCI trades using 50% equity.
Squares: 25%
Triangles: 15%
Crosses(X's): 10%
We will update the user guide on our website(ProfitProgrammers.com) to include an in-depth guide to using the new K2.
The results displayed on the chart are the results for the month of April. As always, the K2 strategy comes with its study equivalent(at no extra cost).
If you're interested in the K2, message us for a free 3 day trial!
All of our invite only studies and strategies can be found on our website ProfitProgrammers.com

Combo Strategy 123 Reversal & CCI This is combo strategies for get a cumulative signal.
First strategy
This System was created from the Book "How I Tripled My Money In The
Futures Market" by Ulf Jensen, Page 183. This is reverse type of strategies.
The strategy buys at market, if close price is higher than the previous close
during 2 days and the meaning of 9-days Stochastic Slow Oscillator is lower than 50.
The strategy sells at market, if close price is lower than the previous close price
during 2 days and the meaning of 9-days Stochastic Fast Oscillator is higher than 50.
Second strategy
The Commodity Channel Index (CCI) is best used with markets that display cyclical or
seasonal characteristics, and is formulated to detect the beginning and ending of these
cycles by incorporating a moving average together with a divisor that reflects both possible
and actual trading ranges. The final index measures the deviation from normal, which indicates
major changes in market trend.
To put it simply, the Commodity Channel Index (CCI) value shows how the instrument is trading
relative to its mean (average) price. When the CCI value is high, it means that the prices are
high compared to the average price; when the CCI value is down, it means that the prices are low
compared to the average price. The CCI value usually does not fall outside the -300 to 300 range
and, in fact, is usually in the -100 to 100 range.
WARNING:
- For purpose educate only
- This script to change bars colors.

The K2 StrategyStrategy version of the K2 Indicator. The K2 uses a fast and slow CCI to identify optimal long entry and exit opportunities.


Commodity Channel Index with Hull MAExperimental strategy, try changing the settings etc
feedback welcome for any timeframe/pair profitable settings

Mby_test straegythis indicator based on Mby_stoch and CCI flow +etc
this indicator got about 66% benefits.


CCI strategy(Lirshah)cci CCI is a versatile momentum oscillator that can be used to identify overbought/oversold levels or trend reversals.
The indicator becomes overbought or oversold when it reaches a relative extreme.
this strategy has been written based on CCI oscillator , and has a good results on some of crypto pairs.

MCI and VCI - Modified CCI FormulasFor private peeps only
- Takes a modified version of the CCI formula into 2 parts
VCI - Volume Channel Index (Yellow Histogram)
- Measures accurate accumulation and distribution levels and times
MCI - Modified Channel Index
- Measures (when compared to VCI) levels where clearly buys are interested vs not interested.
Example:
If VCI > MCI
- Shows buyer's are more than interested in buying, you've either hit a bottom or heavy resistance
if MCI > VCI
- Show's buyer's aren't interested and will most likely result in a dump/lower price
Great for monitoring accumulation and distribution, these auto buy and sells look for the transition points over 0, works on EVERY commodity/stock/FOREX/Crypto
Results are from trading 1 BTC x25 leveraging. Not all trades will get in if put in at limit, but it does survive with profits after the massive 0.075 fee (results shown are after fees)

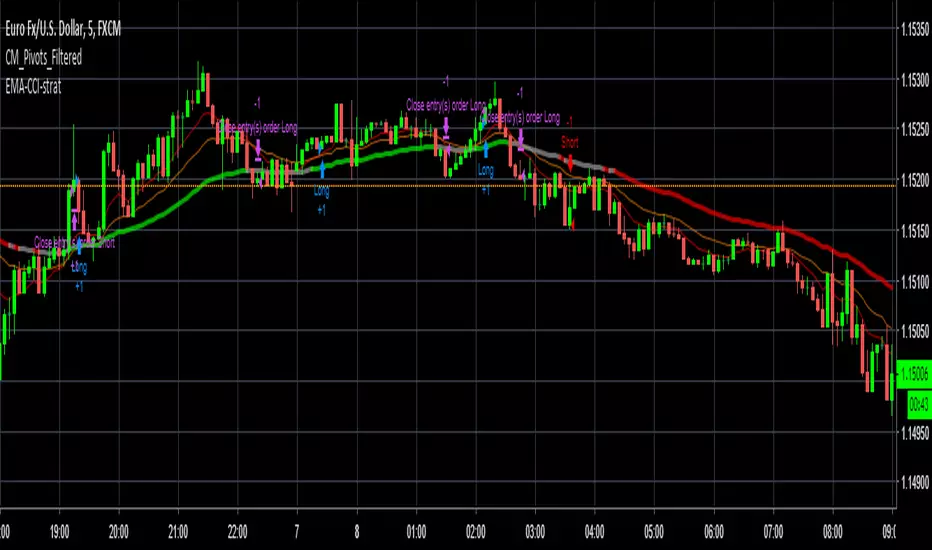
[Strategy] CCI EMA scalping [DEV]Recommended timeframe: 5M or higher
Based on EMA crosses and CCI levels.
Take profit can be also at Pivot levels like Daily/Weekly
Stop loss should be between 12-15 pips.
This strategy is still under development!
Doft BotAdded smoothness to lower timeframes, works best on 5m and 15m.
Fine tuned for ETH/USD on Bitmex
It delays the entries smoothing the choppiness on sideways markets.
Based on CCI + RSI.

MACD+CCI Strategya simple strategy based on Joseph Nemeth MACD+CCI strategy
Reference reading: sites.google.com
CCIandVIXreplace
This strategy aim volatility.
This strategy's Long looks like good, but it is bad at two-stage lowering.
Make sure to cut loss.
This Close is not good, so it is only as a guide.

Silver Trading SignalNOTE 1: Only for S
NOTE 2: Only for timeframe : 30 Minute
Gold and Silver both trade the same way, opposite of DXY but silver fluctuations are higher and different from Gold. This script has been optimized for Silver only, not for gold.
How to trade:
Just see the signals for buy and sell on the chart.
Give your feedback after testing this strategy. :)

SB_CCI coded OBV StrategyStrategy-
Buy Order: Previous obv value is green and obv_cci coded line crosses over ema line
Sell Order: Previous obv value is red and obv_cci coded line crosses under ema line.
Original Idea:
Preferable for day/week intervals.
For Tips to continue :) -
BTC: 1BjswGcRR6c23pka7qh5t5k56j46cuyyy2
ETH: 0x64fed71c9d6c931639c7ba4671aeb6b05e6b3781
LTC: LKT2ykQ8QSzzfTDB6Tnsf12xwYPjgq95h4

CB: CCI & MFI StrategyCustom Development for a Backtest Rookies professional services customer. Published for customer testing and acceptance.
backtest-rookies.com

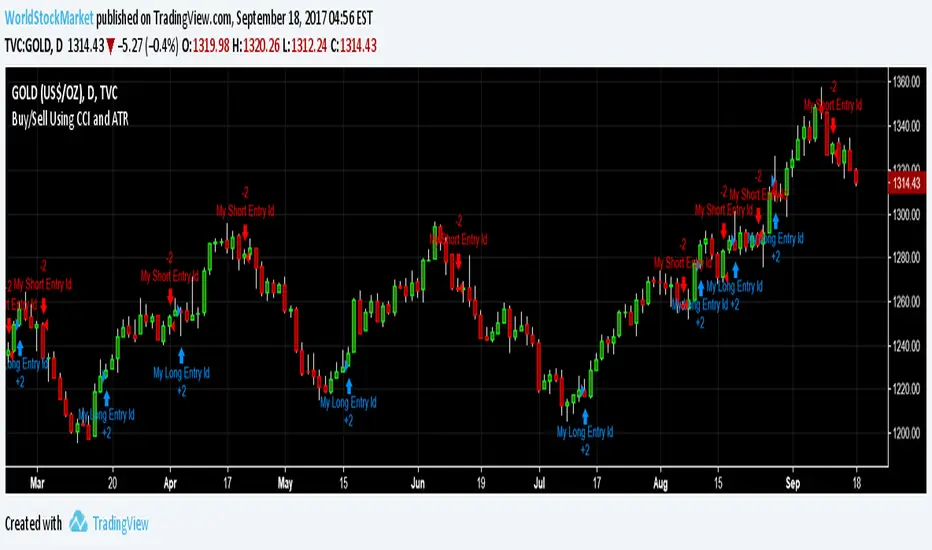
Buy/Sell Using CCI and ATRDetermining Buy/Sell Entries by Crossover of two CCI and Wave analysis by ATR.