CPR - VSD_TamizhTrader DAY/WEEK/MONTH/YEAR1. CPR FOR DAY/WEEK/MONTH/YEAR HAS BEEN CODED
2. IT HAS OFFSET FOR TOMORROW CPR LEVELS (HAS TO BE ADJUSTED IN INDICATOR SETTINGS DEPENDING ON TIME FRAME)
3. UNIQUE AS I DID NOT FIND A CPR FOR ALL TIME FRAMES
4. USEFUL FOR BEGINNERS
CPR
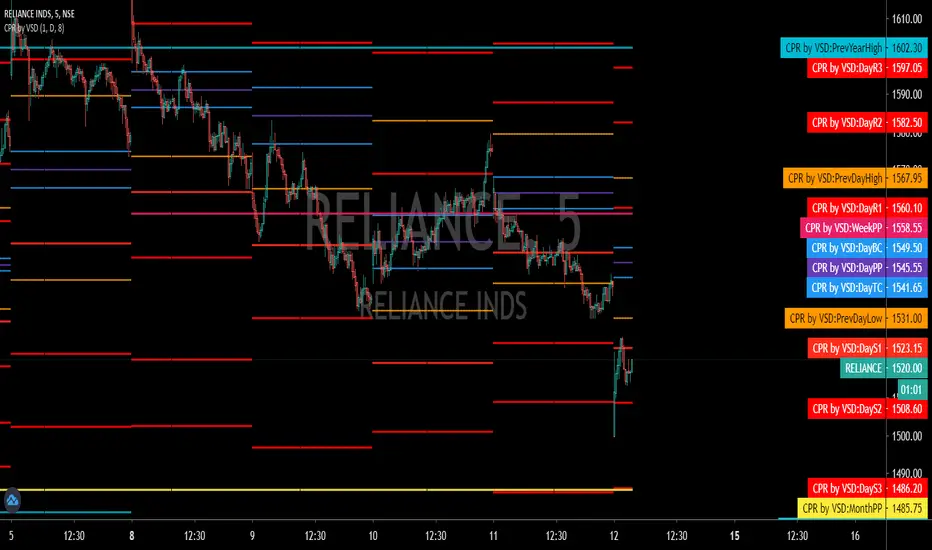
CPR with SMA, EMA, VWAP & Super Trend by GuruprasadMeduriThis script will allow to add CPR with Standard Pivots and 4 Indicators.
Standard Pivot has 9 levels of support and 9 levels of resistance lines. It has CPR , 3 levels of Day-wise pivots , 3 levels of Weekly pivots and 3 Levels of Monthly Pivots .
In Addition to the CPR and Pivot, this script will allow user to Add 4 more Indicators - SMA, EMA, VWAP and SuperTrend as well.
All the Support and resistance levels can be enabled / disabled from settings. It will allow to select multiple combinations of support and resistance levels across 3 levels at any of the 3 time-frames individually and combined.
All 4 Indicators can be can be enabled / disabled from settings. This will allow the indicators to be plotted individually and combined along with any combination of CPR & Pivots.
These number of combinations will allow user to visualize the charts with desired indicators, pivot support & resistance levels on all or any of the 3 time frames.
For Ease of access, listed few points on how the script works..
- CPR and day-wise level 1 & 2 (S1 & R1) enabled by default and can be changed from settings
- Day-wise Level 2 & 3 (S2, R2, S3 & L3) can be enabled from settings
- Weekly 3 levels and Monthly 3 levels can be enabled from settings
- CPR & pivot levels colored in blue lines
- All support levels colored in Green
- All resistance levels Colored in Red
- Day-wise pivot , support & resistance are straight lines
- Weekly pivot , support & resistance are cross (+) lines
- Weekly pivot , support & resistance are circle (o) lines
- SMA, EMA, VWAP and SuperTrend Enabled by Default
- SMA Colored in Orange
- EMA Colored in Red
- EMA Colored in Teal
- SuperTrend Colored in standard Red & Green with triangle arrows
- Any combinations can be selected from settings-> Inputs & style

CPR By VijayMani1. CPR implemented for Daily Time frame. Ref. from pivotboss.com
2. Support and Resistance implemented for Daily Time frame
3. 50 % line implemented between each level for Daily Time frame. It will help to book the profit quickly at 50% level
4. Previous Day Low and High implemented.
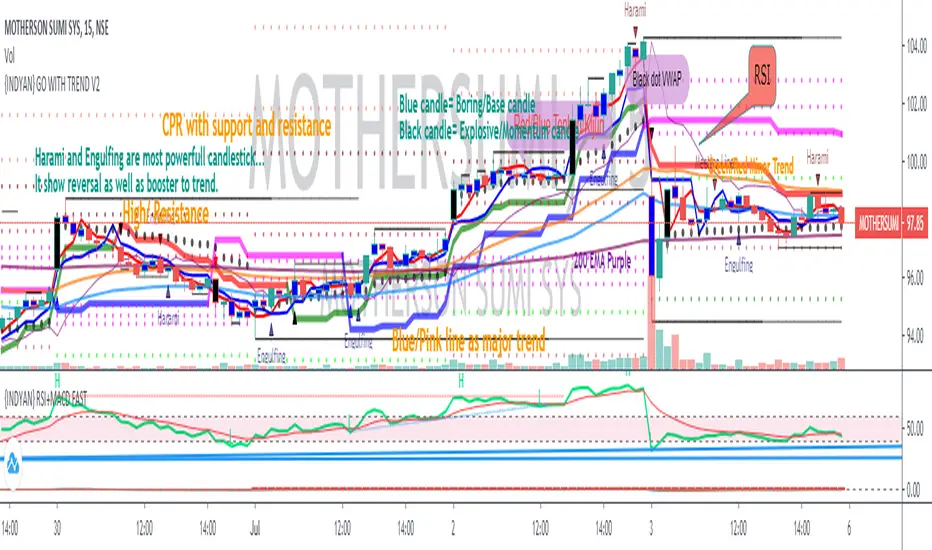
{INDYAN} GO WITH TREND V2This indicator has almost everything for intraday trading . There are two supertrends one with higher time frame and one at lower time frame, Due to which we can recognize reversal. If higher time frame supertrend is showing uptrend and minor is showing downtrend then better to avoid taking any trade in between. Both trend should be in same direction.
Tenkan and kijun is there to verify the trend authencity, check where the tenkan and kijun crossover is there or not at the time of reversal signal given by supertrends. It will boost trading chances.
Also VWAP is placed to know the current situation, If price is below VWAP go for sort if all other things match as above said.
HEMA LEMA is a EMA band and i found that it act as support and resistance, If price breaks channel with volume and sustain above/below for 2 candle close (TIMEFRAME AS SYMBOL).
Also placed FAST EMA to recognize the fast moving trend.
Pivot with CPR is there to trade on basis of CPR and Pivot.
For demand and supply traders, they can use blue and black candle for marking up zones. Blue is boring/base candle and Black is explosive candle.
I hope it will help my trader friends to recognize the trend and reversal.
Let me know if anything more we need to include or remove to make it better for everyone.
Happy Trading... Love INDYAN
#intraday
#hema-lema
#pivot
#cpr
#supertrend_reversal
#demandzone
#supplyzone
#tenkansen
#kijunsen
CPR by GuruprasadMeduriThis script will allow to add CPR with Standard Pivot ad 9 levels of support and 9 levels of resistance lines. It has CPR, 3 levels of Day-wise pivots, 3 levels of Weekly pivots and 3 Levels of Monthly Pivots. All the Support and resistance levels can be enabled / disabled from settings. It will allow to select multiple combinations of support and resistance levels across 3 levels at any of the 3 time-frames individually and combined.
These number of combinations will allow user to visualize the charts with desired pivot support & resistance levels on all or any of the 3 time frames.
For Ease of access, listed few points on how the script works..
- CPR and day-wise level 1 & 2 (S1, R1, S2 R2) enabled by default and can be changed from settings
- Day-wise Level 3 (S3 & L3) can be enabled from settings
- Weekly 3 levels and Monthly 3 levels can be enabled from settings
- CPR & pivot levels colored in blue lines
- All support levels colored in Green
- All resistance levels Colored in Red
- Day-wise pivot, support & resistance are straight lines
- Weekly pivot, support & resistance are cross (+) lines
- Weekly pivot, support & resistance are circle (o) lines
- Any combinations can be selected from stettings-> Inputs & style
// - This is an iterative development. Will add more features due course of time. Suggestions are always welcomed!!
PAT BY KGS (PRICE ACTION TOOL BY KGS)This is a all in one indicator for CPR + Moving Averages + Previous day/week/month high-low.
This is dedicated to every retail trader. "Together we grow as a price action trading community"
Thank you and regards, Gomathi Shankar


Price Action Points
Central Pivot Range(CPR) are most important pivots points while day trading.
Clean and neat CPR indicator with price on lines. Also tomorrow pivots are added too
They are the most powerful and acts as support/resistance.
Use with Moving Averages(20,50):
20EMA for taking the entry which strong momentum is confirmed.

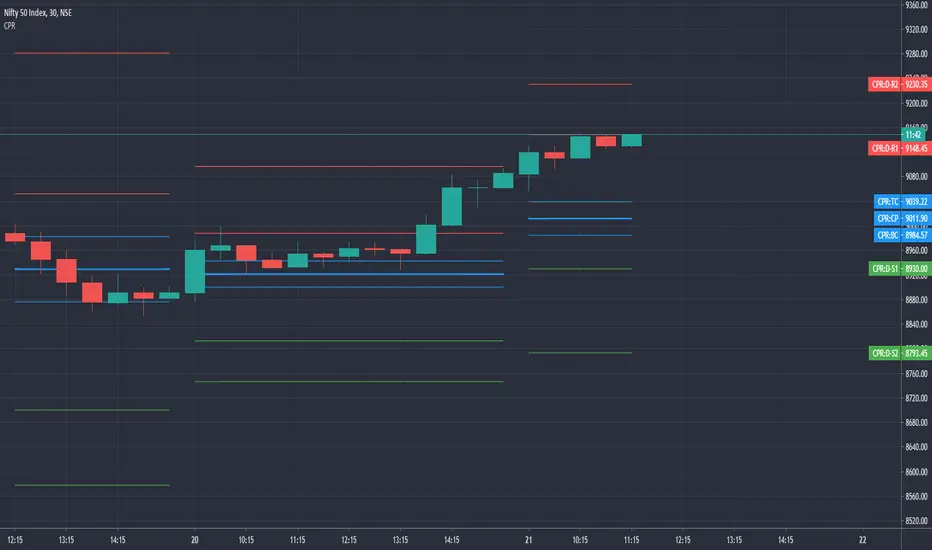
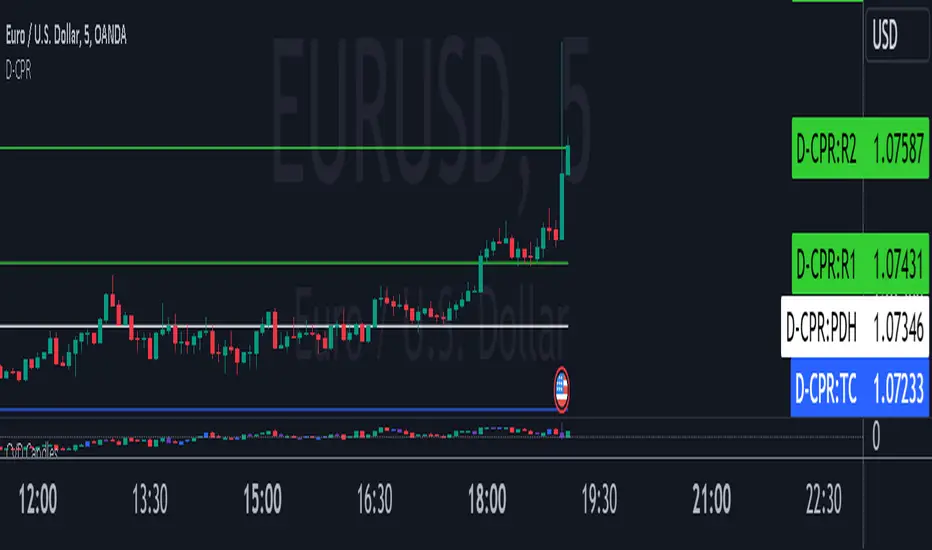
Daily CPRThis script will plot the CPR and support/resistance lines on your chart for smaller time frame so that you use them for Intraday trading. This script also plots the previous day's high (PDH) and the previous day's low (PDL).
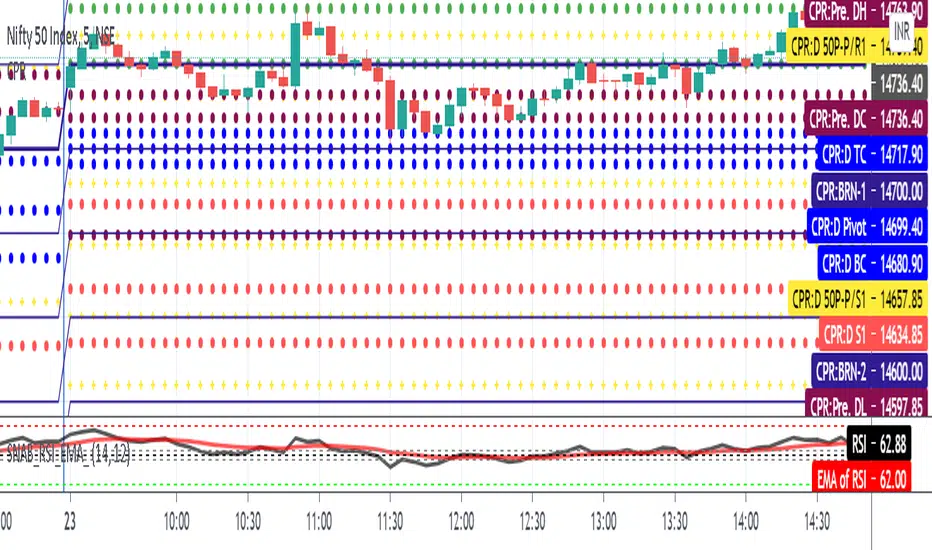
Pivot RSI - A trading strategy using Pivots Rel StrengthThis strategy uses a new concept called Relative Strength of Pivots.
The concept emanates from the fact that the market weakness starts from bottom to top when it comes to pivot as against top to bottom in conventional indicators.
It signals long if the daily pivot shows better strength than monthly pivots and short if the daily pivot shows weaker strength than monthly pivots.
The Strength of pivots is defined better if :
a) if relative strength of lower pivots are higher than higher pivots or crosses higher pivots.
b) if relative strength of lower pivots are sloping upwards and is above mid point (50).
This strength of pivots is combined with pivot shift indicator for additional confirmation which means that if pivot shift indicator is sloping upwards and the strength of pivots satisfies the above definition, then the long is signalled.
How to use this in trading?
The best way is to have this indicator along with the following
a) 50 period ema
b) 200 period ema
c) Daily CPR / Weekly pivot / monthly pivot (MUPS indicator preferred - Please refer to the same in public library)
d) Pivot Shift Indicator (IndianPivotBossPivotShiftIndicator - Please refer to the same in public library)
When a long is signalled, ensure that there are no immediate nearby resistances in the form of EMAs or Pivots. Similarly when a short is signalled, ensure that there are no immediate nearby supports in the form of EMAs or Pivots.
In other words when a long is signalled and if there is a nearby resistance, just wait for the resistance to break convincingly before going long and vice versa for shorts.
In general a blue color indicates that the strength of daily pivot is better alongwith a bullish pivotshift which facilitates a possible long and HENCE STRICTLY SHOULD NOT BE ON THE SHORT SIDE.
In general a red color indicates that the strength of daily pivot is better alongwith a bearish pivotshift which facilitates a possible short and HENCE STRICTLY SHOULD NOT BE ON THE LONG SIDE.
Please ensure that you use this with a proper Risk Management and Money Management guidelines.

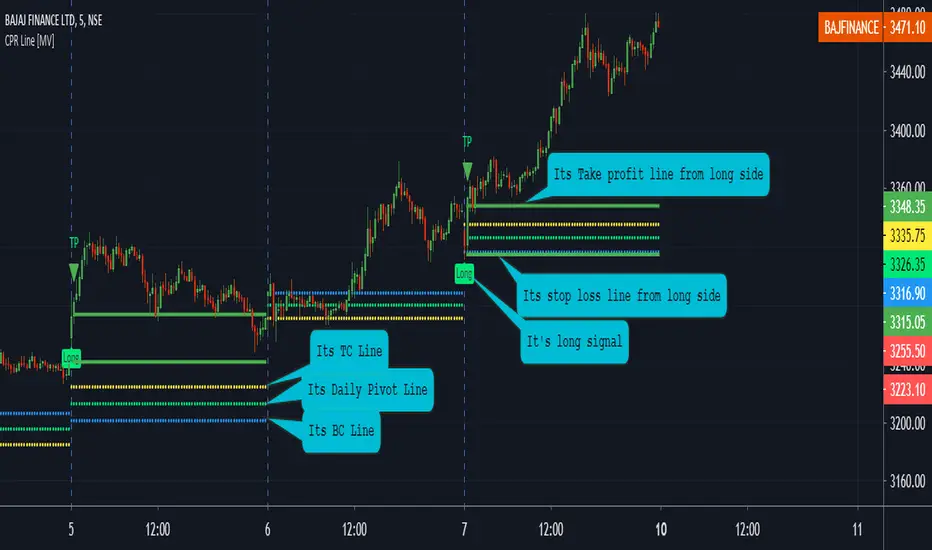
CPR Line [MV]Hello, Everyone, This is Indicator Base on CPR
Indicator Feature
Here is Long and Short plot with Alerts
Here is Takeprofit Line from Long and Short side by default 1 percentage Calculated by Open Bar
Here is Stoploss Line from Long and Short side by default 0.5 percentage Calculated by Open Bar
NOTE: If You are Using CPR Strategy there is some Limitation We are Calculated Close bar price and according to SL OR TP Calculate plot
But if you are Using Indicator by default it's Calculate SL or TP Accounting to Open bar but you can Also Change if you want same result CPR Strategy or CPR Indicator.
You Can also change everything.
In future, I will Enhance this Strategy and indicator
if you have any suggestion Mention here
Thank you so much
Only CPR StrategyHello Everyone This Strategy Base on CPR
By Default 1 Percentage TP AND 0.5 Percentage Sl & quantity 500
By Default Backtesting Starting Time 1 Jan 2020 and end time 31 Dec 2020
You Can also change everything.
In future, I will Enhance this Strategy
if you have any suggestion Mention here
Thank you so much

Expanded Floor PivotsExpanded Floor Pivots idea derives from the book "Secret of Pivot Boss by Frank Ochoa."
Its a combination of Central Pivot Range(CPR) & Camarilla Pivots.
This Indicator specially built for Intraday Trading with all support & resistance, also with advance view of Tomorrow Pivots(CPR+Camarilla).
(User Modification Accessible, Stay Connected-Follow & Post Comment-feedback)


CPRFibonacciPivots By EquityDuraiThe Central Pivot Range (CPR) is one of the most versatile price-based indicators available to traders. ... At any given time, the range can be support or resistance, it can forecast trending or sideways price behavior, dictate the day's direction, or serve as an integral part of a trend.
Keep in mind that depending on the market’s behavior, the formula for TC may in fact create the level for BC, and vice versa. I always refer to the highest level as TC, and the lowest level as BC, regardless of which formula led to the level’s creation.


CPR 5min (cpr alone)only for those who need CPR . You can see heavy movement on narrow CPR day and range bound on wide CPR day. Works only on 5 min

Pivots (CPR) - Daily, Weekly & Monthly (only for Indraday) Hi all Dear users,
Here, I have shared my CPR script on Daily, Weekly & Monthly basis. which will only works on intraday time frames. Best time frames recommended are 3,5 &15.
This will be very useful for intraday trades. And also it has more customizing options.
The features are:-
================
- Have an option to use only Daily pivots.
- Have an option to check tomorrow pivot ( After day closing).
- You can customize each and every style and colors.
- It also contains Previous day High, Previous Week High & Previous Month High.
- You can Show or Hide daily weekly Monthly and highs too.
Please share this AMAZING INDICATORS others.

unRekt - Nexus HTFunRekt Nexus HTF is a CPR 'Central Pivot Range' that uses the higher timeframes 3 Month, 6 Month and Yearly. Each TF can be turned on or off and the lookback periods can be selected to current or multiple periods.

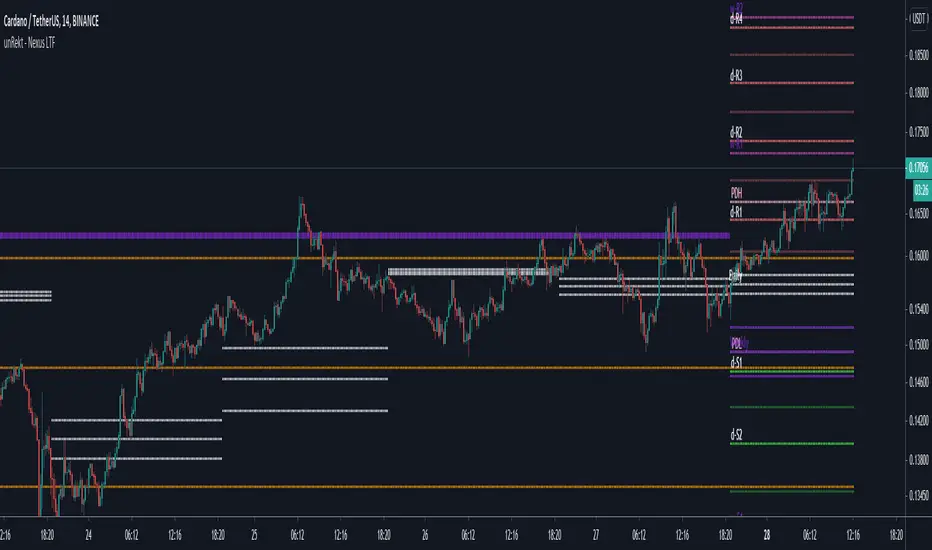
unRekt - Nexus LTFunRekt Nexus LTF is a CPR 'Central Pivot Range' that uses the lower timeframes Daily, Weekly and Monthly. Each TF can be turned on or off and the lookback can be selected to current or multiple periods.
CPR and Camarilla PivotsThis script has CPR ranges for (Daily, Weekly, Monthly) and Major pivot levels for daily (R/S 3,4,5) weekly (R/S 3,4). It also has prev day H/L and weekly H/L.
- Daily CPR (Black dotted lines)
- Weekly CPR (Blue dotted lines)
- Monthly CPR (Fushcia dotted lines)
- Prev Day H/L (Orange dotted lines)
- Weekly H/L (maroon dotted lines)
- Daily pivots R/S 3,4,5 (black cross lines)
- Weekly pivots R/S 3,4 (blue cross lines)

CPRCentral Pivot Point Indicator with Daily, Weekly and Monthly time frames. It has more option to customize.
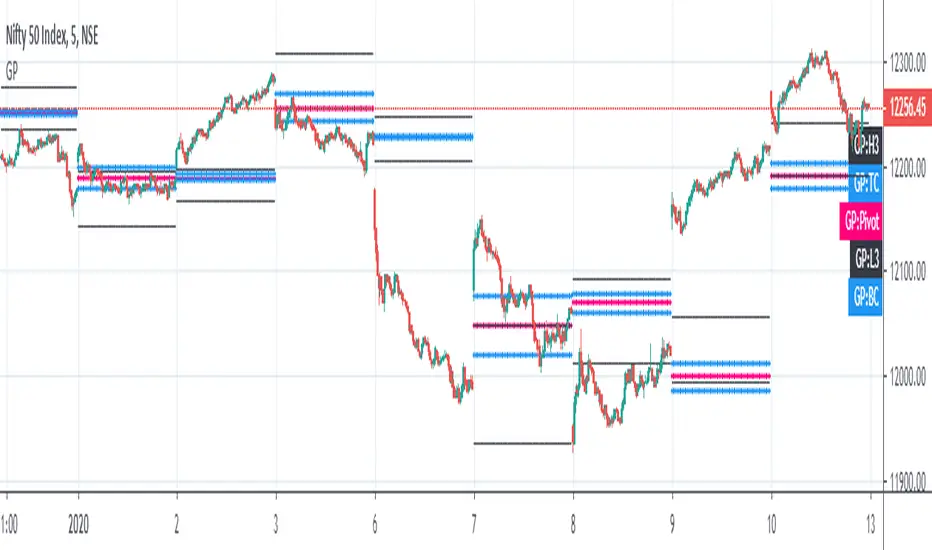
Golden Pivot1. Golden Pivot indicator combines Central Pivot Range and Camarilla Pivots.
2. Pivot calculations are based on Secret of Pivot Boss book by Frank Ochoa.
3. One can also view tomorrow's pivots by today EOD.