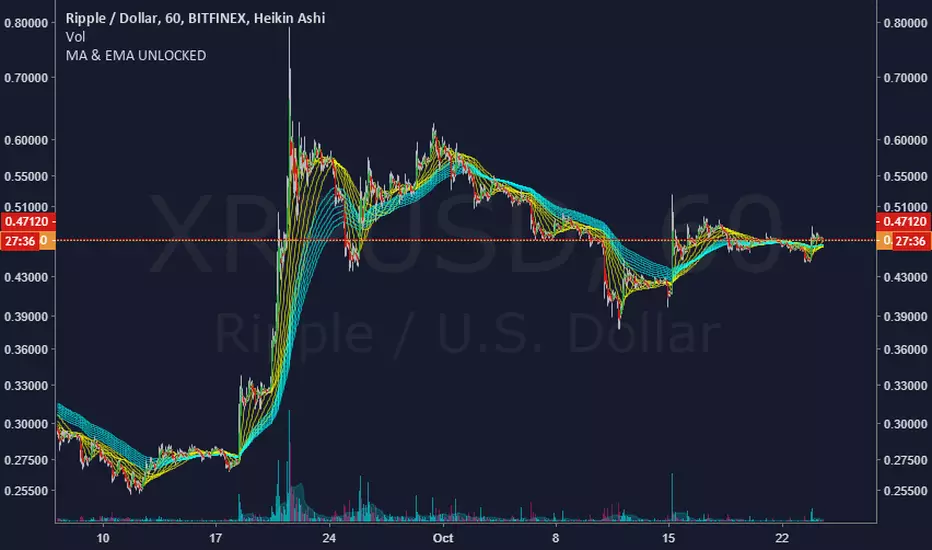
MA & EMA UNLOCKEDMaximized your trading by using MA & EMA UNLOCKED.
7 Moving Average
7 EXPONENTIAL MOVING AVERAGE
Fully customizable in your needs such as support and resistance , trend follower and crossover breakouts. You can hide and unhide unnecessary things.
Crossover

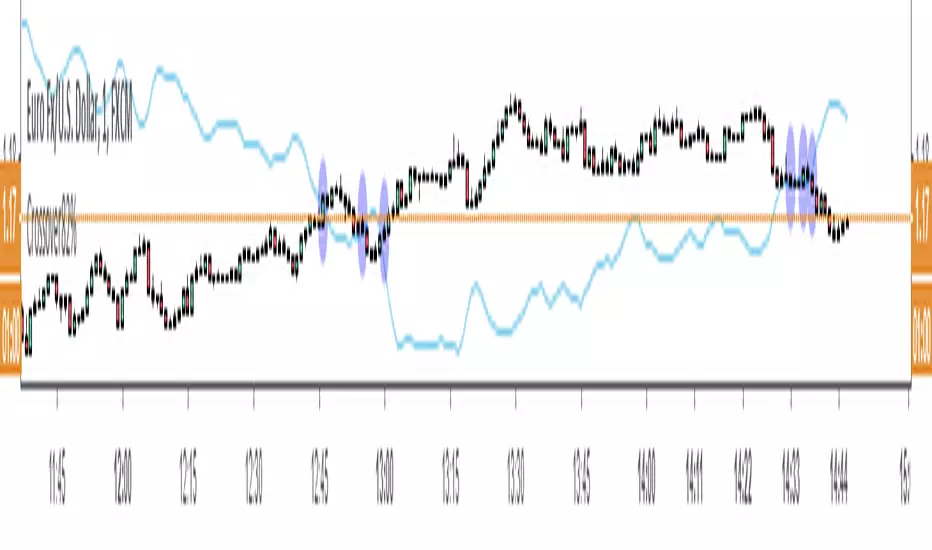
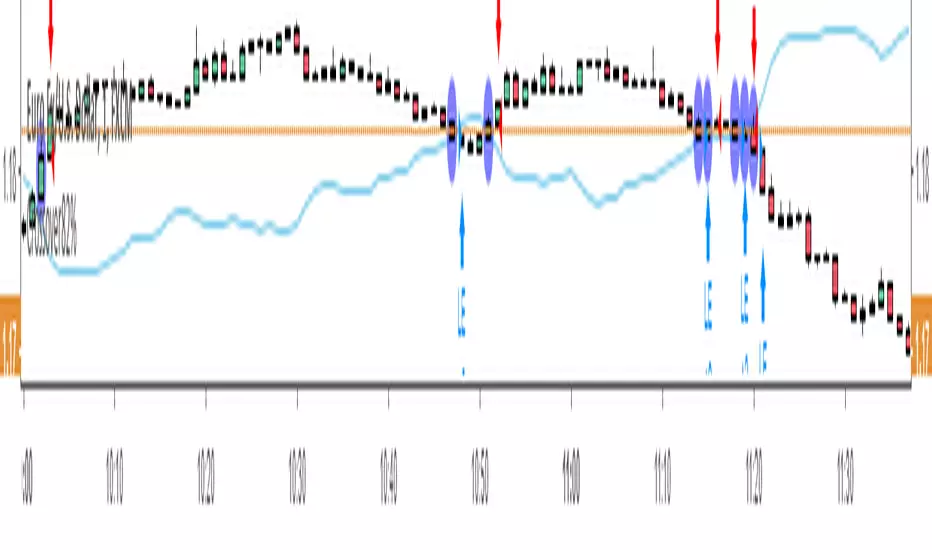
Moving Average Shaded Fill Area Crossover EMA Color - EditableMoving Average Shaded Fill Area Crossover EMA Color with option to change EMA value

Volume + Ema CrossoverIf Volume crossover its ema, we can consider it as a volume pump.
It may be useful for combining with other indicators.

4 MAs | OHLC4 MAs(3 Exponential Moving Averages, 1 Simple Moving Average) with OHLC(Open,High,Low,Close)
Exponential Moving Averages (EMA) 8, 62 & 200 (default values)
Simple Moving Average (SMA) 18 (default value)
Values can be amended based on your trading strategy.

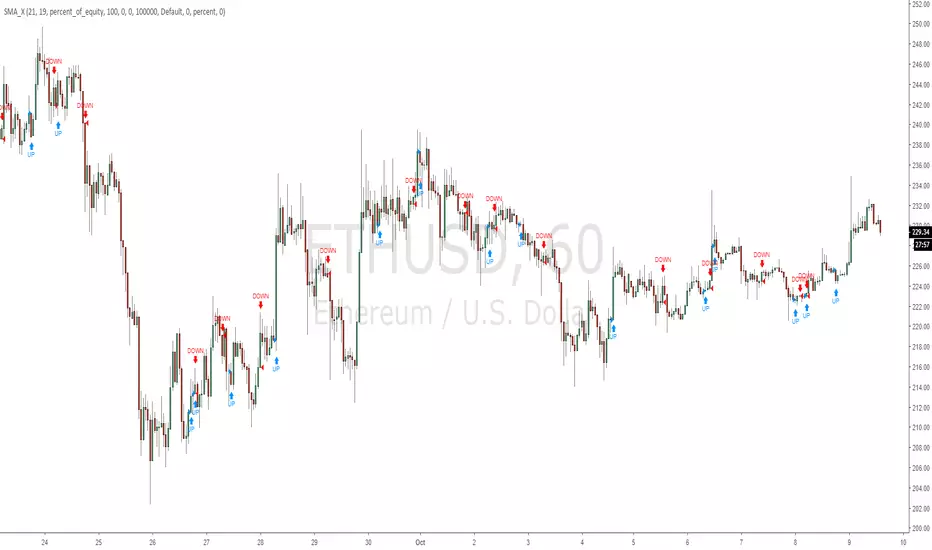
SimpleMA smoothed crossover strategyExperimental simple Bot script for ETH/USD 1 hour chart. welcome to test on other pairs. put feedback in comments.
This is a crossbreed between SMA and HULLMA
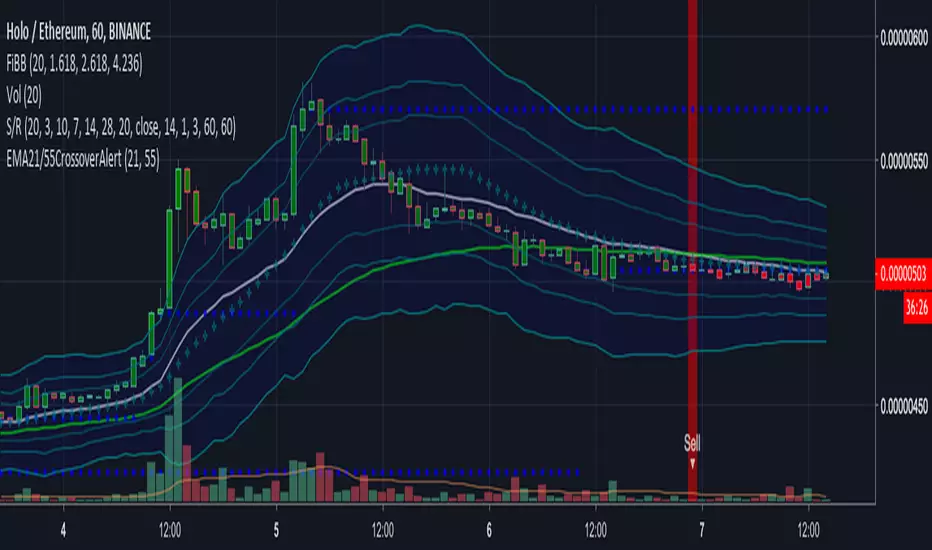
EMA21/55 Crossover AlertThis will alert on EMA crossovers. Alert for 21 crossover and crossunder. Work in progress.
Jack MA Cross Alerts with TP, SL, TSLAlerts for:
Jack MA Cross is works based on a MA Crossover. What makes this script unique is the framework built behind it. With the ability of adding TP, SL, and TSL. It makes this script more advanced compare to other traditional MA Crossover scripts.
Will add more Moving Averages in the future, making this the Jack of all Trades .
To request a trial for this script, please PM me.
-----------------
Jack MA Cross V1.0.0
- Initial release

Jack MA Cross Backtester with TP, SL, TSLJack MA Cross is works based on a MA Crossover. What makes this script unique is the framework built behind it. With the ability of adding TP, SL, and TSL. It makes this script more advanced compare to other traditional MA Crossover scripts.
Will add more Moving Averages in the future, making this the Jack of all Trades .
To request a trial for this script, please PM me.
-----------------
Jack MA Cross V1.0.0
- Initial release

兔子希双均线策略 EMA CROSSA single Indicator that has two EMA inputs (currently using 5, 13 for my crypto trading)

Simple TrenderOriginates from:
I was reading some Impulse Trading literature by A. Elder.. In it, someone named Kerry Lovvorn proposed "An End of Day Trend Following System" for someone lazy.
Originally it is just price closing above an 8 ema (low) for long. Exit when price closes below an 8 ema (low). The opposite for a short position.
Conditions: Buy when price closed below ema (low) for two bars or more, then closes above. Opposite for a short position. I do not follow this condition. Though it may help with whipsaw.
My condition is when price closes above the 26 ema (low) (works the best for me) I place orders above the initial crossing bars high. Opposite for lows.
I look for stocks that are low in price to go long on. I want the run from 2's to 15's
I look for stocks that are mid-teens/20's in price to go short on. I want the run from 20's to 2's
I look for stock with news and earnings that are already running (up or down) to play the pullback.
These conditions can easily be scanned for on thinkorswim
From first glance, the system looks like CMsling shotsystem. Although, I plagiarized some parts of the codes, because I am inept when it comes to that shit, it differs as it is not a moving average crossover system.
It is a price crossing over concept. A moving average VWAP is used for best entries on pullbacks.
Purpose:
--To catch the majority of a trend/wave/run.
--To identify pullback areas to go long or short while in midst of trend. To catch pullbacks off news and earning runners.
--To catch the initial start of trend with clear rules to enter
--Clear rules to exit
Issues
--possibilities of getting ninja sliced the fuck up. Can be mitigated by entering stocks with decent average volume. And also only going long above 200 ema and short below it. ADX won't work, at the initial start of the trend it will show not trending. Can look at blow off volume at the bottom followed by increase in buying for long and vice versa for short.
--Can give some huge gains away through gap ups or gap downs from news or earnings during trend. However, can get huge gain on gaps from news or earning. Nature of the game.
--Need some brass balls and a supply of pepto to stomach through some of the pullbacks. Gut wrenching seeing big gains dwindle. But they all even out at the end, you hope. (see NBEV and IGC, and CRON and others. shit don't go in straight lines, homie)
Pros
--It's simple and easy. Overall, you profit
--works with any security
Cons
--It can be stressful.
--does not work well on lower time frames. Do not recommend going below 15 minutes
--Possibility of working on 5 minutes with a time frame breakout strategy (15,30 min).
Couple it with LazyBear "Weis Wave Volume" indicator. Works well for pullback entries.
Enjoy. Ride some waves.


RSI Divergence Smoothed with Signal Line and Power ZonesThis Indicator plots Regular and Hidden Divergences lines for an RSI smoothed by an EMA and for its Signal Line
The RSI can be set to change colour with direction or can be set as single colour
Colour Changing RSI helps when trading Multiple Timeframes as you can look for confluence in the direction of RSI
The divergence script is thanks to @RicardoSantos, I've just adjusted it to suite my indicator
Remember that divergences work best when traded with the trend or very late in a trend when going against the trend
I have also added a Colour Changing Signal Line & Hima Reddy's Power Zones so now you can also
Take full advantage of trading; signal line crosses, 50 crosses and Power Zone RSI support and resistance

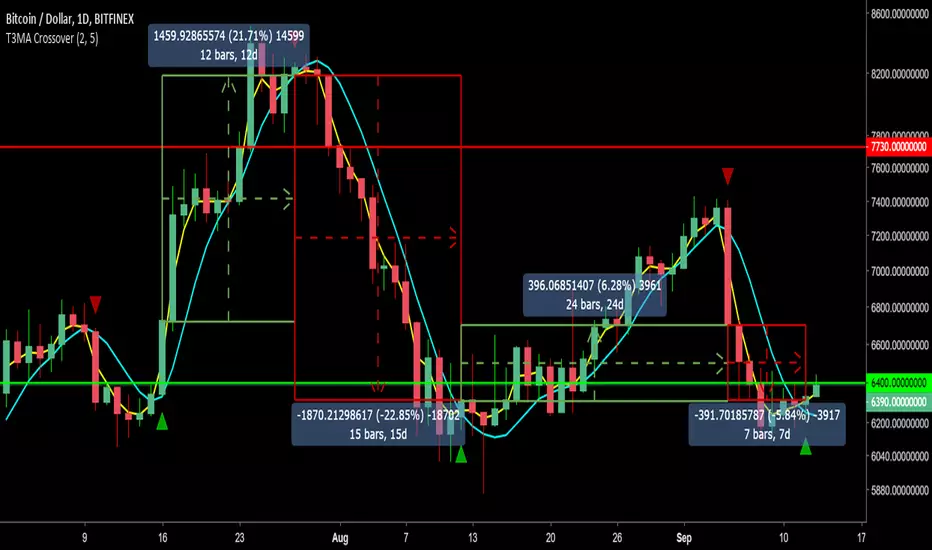
T3MA Crossover Strategy w/ Alerts v2.0Summary:
Using the T3MA formula developed by Tim Tillson, this differs from traditional SMA and EMA by providing a smoother curve and less lag. The smoothness is derived from the weighted sum of a single EMA through EMA 6 times.
How it works:
- Like any other crossover strategy.
- When fast MA crosses OVER the slow MA, go long.
- Close long and/or go short when the fast MA crosses UNDER the slow MA.
- Can keep flipping between long and short signals.
Quite a conservative strategy as it uses lagging indicators, not for intraday trading (you can, but I don't). Comes into it's own in trending markets as long as you stick to the signals.
Alert messages:
- Long
- Short
How I use it:
- My defaults are set at 2 fast MA and 5 slow MA to ride trends as close as possible.
- On BTCUSD and other altUSD pairs, I tend to use a daily time frame.
- On altBTC pairs, I tend to use a 12H time frame.
- Action on candle close at momentum confirmation (have seen numerous examples of a signal reversing mid candle into a dump).
Will need to be able to short altcoins to make the most of it, or it will at least keep you out of sustained downtrends (=/= holding).
Backtest it on bitcoin and other large cap alts on high time frames to see for yourself. For lazy trading, can set up alerts with AutoView.
0.1ETH for lifetime access. Message for details and support.
Adaptive MAs (MAMA, FAMA, KAMA)Adaptive moving averages a.k.a volatility-weighted moving averages are great tools for filtering out whipsawed trades as well as protecting the traders from premature exits when using stoploss. Adaptive moving averages are constructed in such a way that:
1) as volatility increases the sensitivity of the moving averages decreases, distancing the moving averages from price.
2) as volatility subsides, the sensitivity of the adaptive moving average starts to increase, drawing it closer to price action.
References:
stockcharts.com
www.mesasoftware.com
Find me on Twitter .

Taribo EMA StrategyIt is a simple script that take price action and EMA 13 crossovers to give visual buy and sell signals which works on all timelines.
Sample Chart:

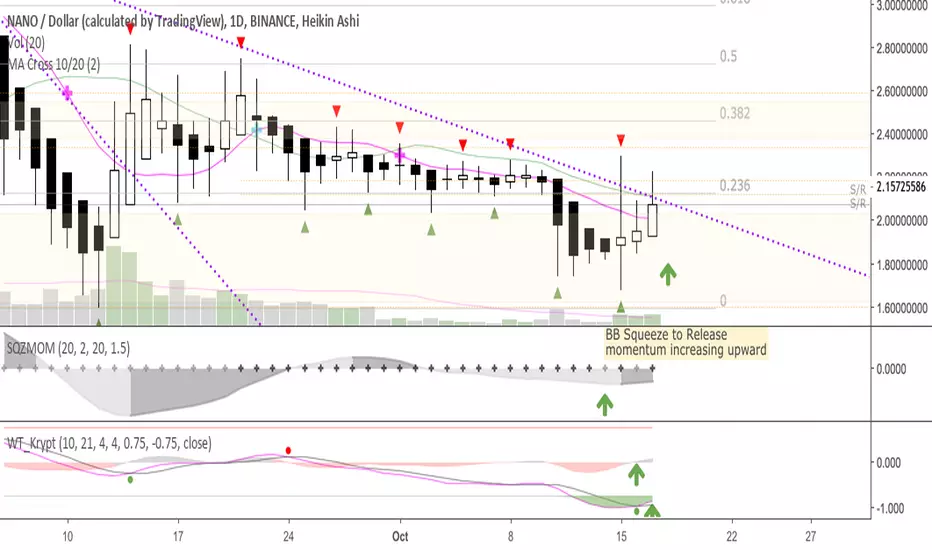
MA Cross 10/20This was originally derived from "MA Cross" indicator, though that one uses 9-21.
Simple 10day and 20day MA crossover indicator
* 10MA crosses from the bottom, goes up and above 20MA—we're bullish, look to long bullish signal candle
* 10MA crosses from the top, goes down and below 20MA—we're bearish, look to short bearish signal candle
Works well w/ Heikin Ashi candles