Double EMA CROSS
Double EMA CROSS (DEC)
Useful for identifying and receiving alerts about uptrends and downtrends.
This script uses two Exponential Moving Averages (EMAs) to find price uptrends and downtrends.
An Exponential Moving Average ( EMA ) is a type of moving average that places a greater weight and significance on the most recent data points.
The script produces uptrend and downtrend signals based on crossovers and divergences between the two EMAs,
the user will be able to spot a trend change (when the EMAs crossover) and to determine the strength of the current trend (when the EMAs diverge).
It is also posible to get alerts for uptrends and downtrends on the web and mobile app with sound and pop-ups as well as via email.
The optimal time to enter and exit the market can be concluded from this trend changes.
The user can set their own EMAs, by default they are set to 25 and 75 periods for medium and long term respectively.
When the medium term EMA crosses below the long term EMA the asset is in a downtrend and the price will decline, and when the
medium term EMA crosses above the long term EMA the asset is in an uptrend and price will increase.
This scripts plots the following indicators and signals on the chart to help the user to identify trends:
1.- Medium and long term EMAs as lines overlaid on the price chart.
2.- Up green triangles above bars when the price is on an uptrend and down red triangles below bars when the price is on a downtrend.
3.- Arrows with text to indicate the start of an uptrend or downtrend.
The user can enable and disable the indicators and signals as well as set colors and shapes to their liking.
This script also lets the user create alerts for uptrends and downtrends. To create a new alert using this script follow this instructions:
1.- Once you added this script to your chart, go to the alerts panel (right on web or bottom tool bar on the mobile app) and add a new alert (alarm clock icon with a plus sign).
2.- A modal window will open. On the “Condition” dropdown menu select “DEC”.
3.- On the next dropdown menu (right below the “Condition” one) you can select.
4.- Lastly you can set all the normal alert options and create the alert.
Crossover

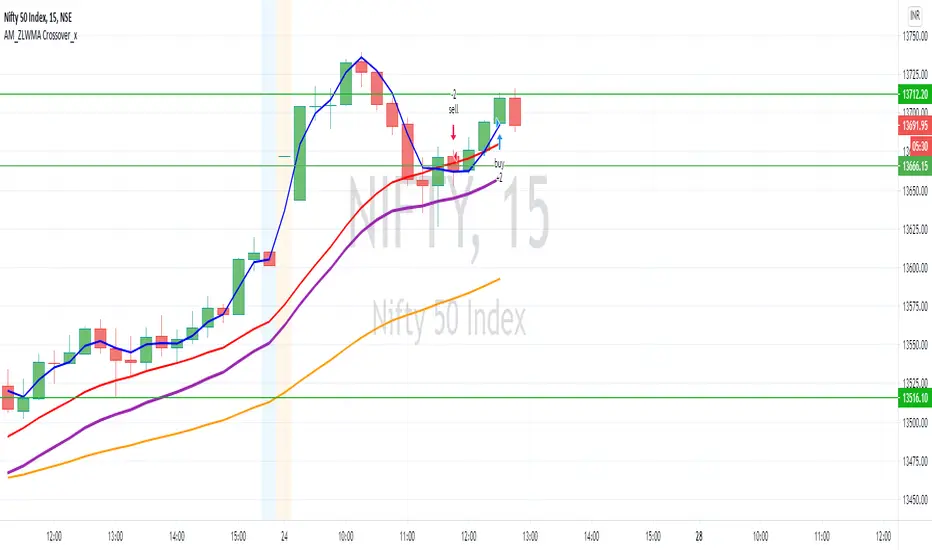
AM_ZLWMA Crossover_xDear All,
Please find updated version of Zero lag WMA crossover. In addition to this added 20/50 EMA to get better results.
Settings:
ZLWMA = 8 identified by Blue line
Fast WMA = 21 identified by Red line
EMA Period 20/50
How to Trade:
Buy: Wait for positive crossover (Blue cross above Red) to happen trade can be taken there but to get better results post crossover once price move above EMA 20 then buy can be initiated.
Sell: Wait for negative crossover (Blue cross below Red) to happen trade can be taken there but to get better results post crossover once price move below EMA 20 then sell can be initiated.
Reason to wait for confirmation of price action above / Below moving average is most of the time it happens that even after crossover happens sometimes it was just a pull back and from there it could be a possibility for reversal. Once price action confirms moving above / below EMA20 then trade will be initiated.
Please comment and ask for any doubt
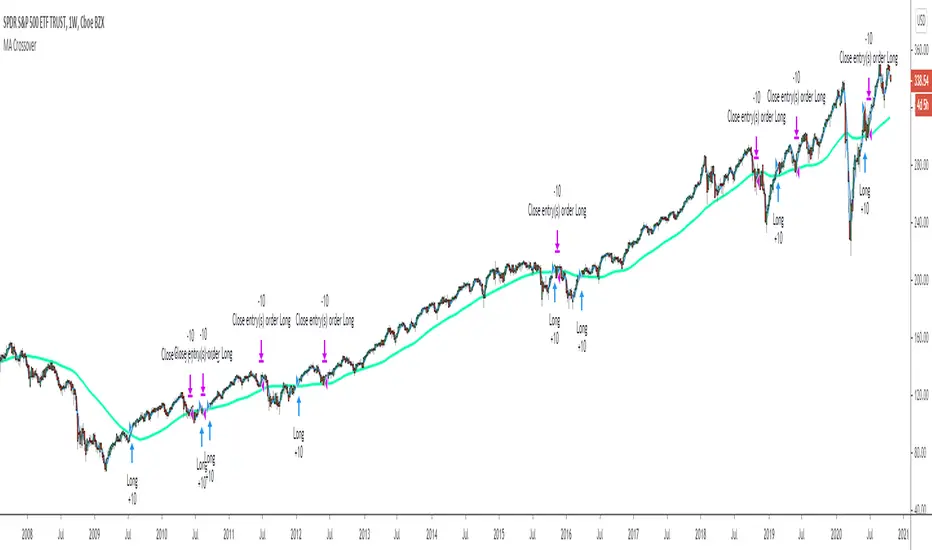
Moving Average Cross Strategy early Closing This is my example for the Moving Average Cross Strategy with early Closing. You can modify the strategy for your individual setup and market.
I tested the strategy in DAX30 and SP55
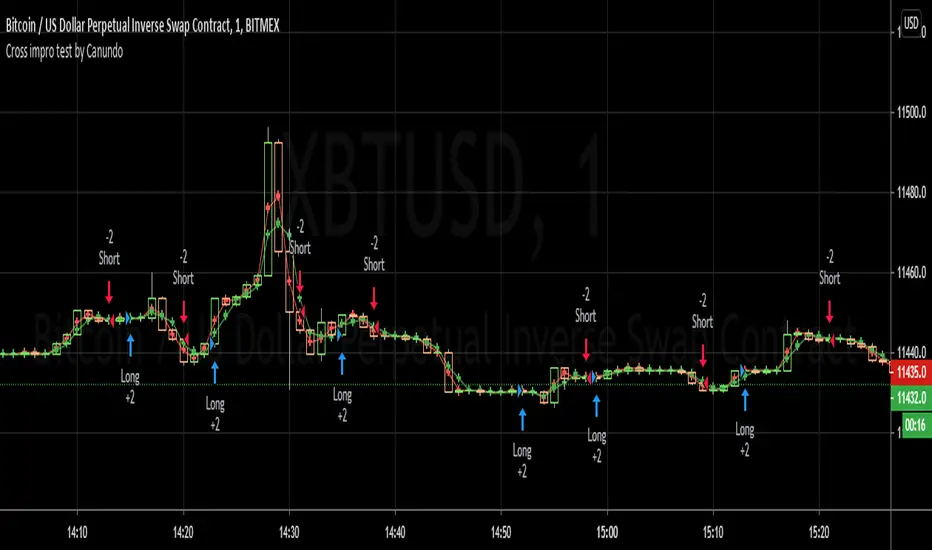
Cross impro test by Canundo Crossover Crossunder Tick valuesThis is a script where I tried to check the following things:
Even thought the tick of an asset is, for example 0.5, there are calculated prices, like SMA's that have even more decimals. Leading to crosses happening that for example happen at the same price. Consequently triggering totally useless in side markets. What happens if SMA values are restricted to the tick resolution? (Option works on it's own or with a combination of the others.)
What happens if I set my own tick value, like 0.8 instead of 0.5, what will be the effect for calculated values that are used for crossings? Will tick sizes improve the success rate? (This option will work only when the first option is active.)
Can success rate, especially for sideway markets be improved when adding a spread between MA's, so that it triggers less in sideway markets? (Option works on it's own or with a combination of the others.)
First of all, I had a hard time to round prices properly when it needs to be dynamic and working for different assets with different amounts of decimal values in the tick. The solution is that abs(floor(syminfo.mintick)) will give you the amount of decimals a tick has. It works for all ticks that are at least lower than 10. I'm not sure how huge ticks are out there. I did not implement this solution at the end since I found another way to test it.
Findings:
The first option, when activated, takes out half the trades and raises the percent profitability by 8% so there is some effect. However, all of the tested options have less advantage than I hoped for but are nevertheless something worthy for sideway markets. The first option just forces the MA's from the example to use the tick resolution.
See these two images. One when the first option is off, the second when it's active.
The lines are the MA's with adjusted values, the crosses are the places of the MA's when left as is.
Here a screenshot of the third option set to the value 2 on the 1 minute XBTUSD chart.
The advantage is that less trades trigger that have a low change in price and so less trading fees will happen.
The disadvantage is that all options can implement some delay for a crossing since the crossing will trigger once a slightly bigger move into the direction was taken.
This test environment was not meant to be profitable but to test the effects.
Maybe someone finds it interesting or wanted to test the same, so here you can save some work.
EMA Crossover StrategyEMA Crossover Strategy
This strategy will enter a long trade when the 21 EMA crosses over the 55 EMA and both EMAs and the close price are above the 200 EMA (long-term trend).
It will enter a short trade when the 21 EMA crosses under the 55 EMA and both EMAs and the close price are below the 200 EMA.
It will exit a long trade when the RSI crosses under from overbought and indicates that the uptrend could be coming to an end.
It will exit a short trade when the RSI crosses over from oversold and indicates that the downtrend could be coming to an end.
Backtesting shows that it works best on:
30 MIN:
SYMBOL - PROFIT FACTOR
AUDCAD - 1.126
EURJPY - 1.12
EURNZD - 1.04
EURUSD - 1.65
GBPAUD - 1.27
USDCAD - 1.08
1 HR:
SYMBOL - PROFIT FACTOR
CADJPY- 1.23
EURNZD- 1.166
GBPJPY- 1.23
GBPUSD- 1.282
NZDJPY- 1.246
USDCHF- 1.344
3 HR:
SYMBOL - PROFIT FACTOR
CADCHF- 1.975
EURGBP- 1.776
EURNZD- 1.911
GBPAUD- 1.364
GBPCHF- 1.311
USDJPY- 1.162
XAUUSD - 2.00
As always, this strategy does not guarantee you to achieve profits and you should always use confirmations before entering a trade.

Combo Backtest 123 Reversal & EMA & MA Crossover This is combo strategies for get a cumulative signal.
First strategy
This System was created from the Book "How I Tripled My Money In The
Futures Market" by Ulf Jensen, Page 183. This is reverse type of strategies.
The strategy buys at market, if close price is higher than the previous close
during 2 days and the meaning of 9-days Stochastic Slow Oscillator is lower than 50.
The strategy sells at market, if close price is lower than the previous close price
during 2 days and the meaning of 9-days Stochastic Fast Oscillator is higher than 50.
Second strategy
The Moving Average Crossover trading strategy is possibly the most popular
trading strategy in the world of trading. First of them were written in the
middle of XX century, when commodities trading strategies became popular.
This strategy is a good example of so-called traditional strategies.
Traditional strategies are always long or short. That means they are never
out of the market. The concept of having a strategy that is always long or
short may be scary, particularly in today’s market where you don’t know what
is going to happen as far as risk on any one market. But a lot of traders
believe that the concept is still valid, especially for those of traders who
do their own research or their own discretionary trading.
This version uses crossover of moving average and its exponential moving average.
WARNING:
- For purpose educate only
- This script to change bars colors.

McGinley Dynamic Indicator This is a strategy based on the Mcginley Dynamic Moving Average indicator, a type of moving average that was designed to track the market better than existing moving average indicators. It is a technical indicator that improves upon moving average lines by adjusting for shifts in market speed.
Moving averages used:
EMA: 21
EMA: 42
The chart used for the backtest was the Bovespa Futures Index ( WIN1! Continuous: current contract in front )

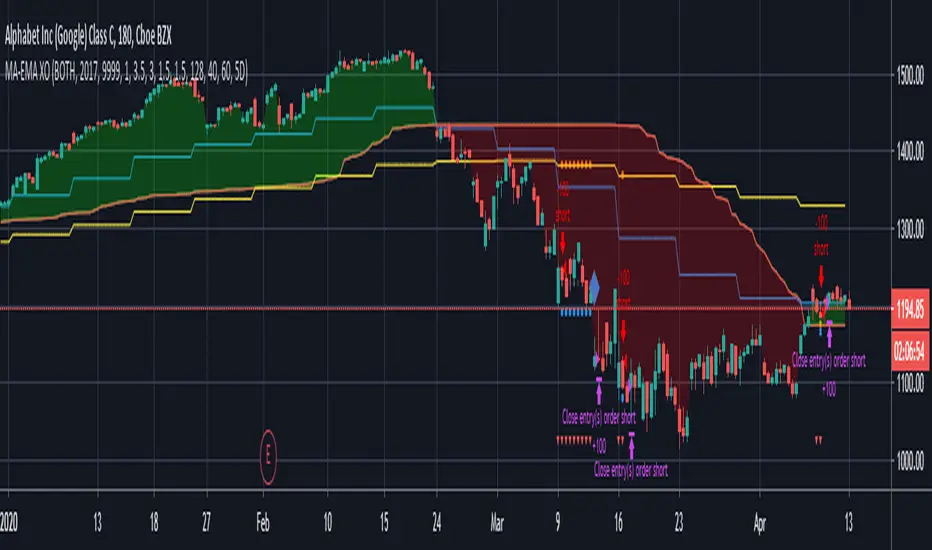
MA-EMA Crossover LTJust a simple strategy based on dynamic zones by Allenster. Still a work in progress.
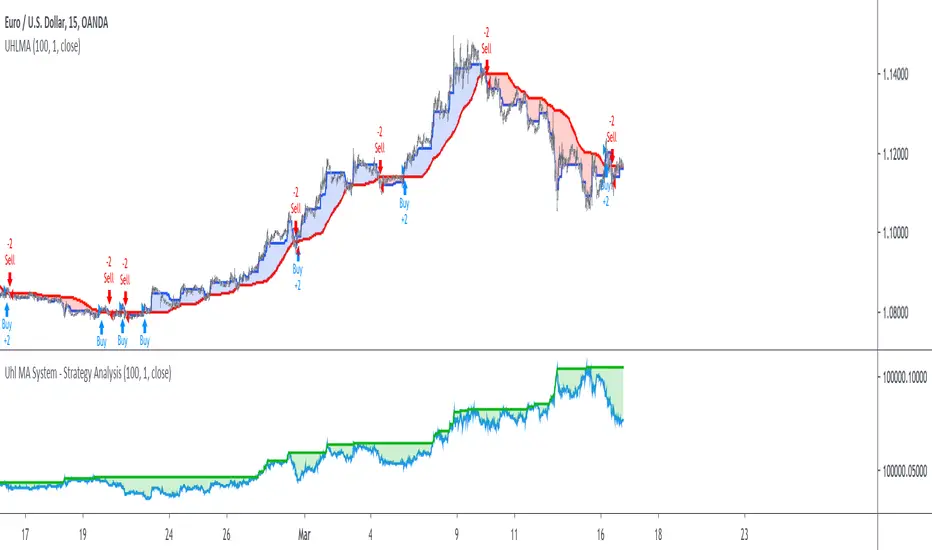
Uhl MA System - Strategy AnalysisThe Uhl MA crossover system was specifically designed to provide an adaptive MA crossover system that didn't committed the same errors of more classical MA systems. This crossover system is based on a fast and a slow moving average, with the slow moving average being the corrected moving average (CMA) originally proposed by Andreas Uhl, and the fast moving average being the corrected trend step (CTS) which is also based on the corrected moving average design.
For more information see :
In this post, the performances of this system are analyzed on various markets.
Setup And Rules
The analysis is solely based on the indicator signals, therefore no spread is applied. Constant position sizing is used. The strategy will be backtested on the 15 minute time-frame. The mult setting is discarded, the default setting used for length is 100.
Here are the rules of our strategy :
long: CTS crossover CMA
short: CTS crossunder CMA
Results And Data
EURUSD:
Net Profit: $ 0.08
Total number of trades: 99
Profitability: 35.35 %
Profit Factor: 1.834
Max Drawdown: $ 0.01
EURUSD behaved pretty well, and was most of time showing long term trends without exhibiting particularly tricky structures, the moving averages still did cross during ranging phases, since march 9 we can see a downtrend with more pronounced cyclical variations (retracements) that could potentially lead to loosing trades.
BTCUSD:
Net Profit: $ 4371.57
Total number of trades: 94
Profitability: 32.98 %
Profit Factor: 1.749
Max Drawdown: $ 1409.96
The strategy didn't started well, producing its largest drawdown after only a few trades, the strategy still managed to recover. BTCUSD exhibited a strong downtrend, the strategy profited from that to recover, signals still occurred on ranging phases, and where mostly caused by a short term volatile move, unfortunately the CMA can converge toward ranging/flat price zones where false signals might occur at higher frequency.
AMD:
Net Profit: $ 16.09
Total number of trades: 95
Profitability: 29.47 %
Profit Factor: 1.288
Max Drawdown: $ 20.11
On AMD the strategy started relatively well with a raising balance, then the balance quickly fallen, this downtrend in the balance lasted quite some time (almost 48 trades), the strategy finally recovered in Nov 2019 and the balance made a new highest high at the end of February. AMD had numerous trends during the backtesting period, yet results are poor.
AAPL:
Net Profit: $ -28.17
Total number of trades: 89
Profitability: 28.09 %
Profit Factor: 0.894
Max Drawdown: $ 63.21
AAPL show the poorest results so far, with a stationary balance around the initial capital (in short the evolution of the balance is not showing any particular trend and oscillate around the initial capital value).
AAPL had some significant retracements in its up-trend, which triggered some trades (of course), and the ranging period from Jan 24 to Feb 13 heavily damaged the strategy performance, generating 6 significant loosing trades. AAPL show the worst results so far, mostly due by ranging phases.
Conclusions
The Uhl MA crossover system strategy has been tested and based on the results don't show particularly interesting performances, and might even be outperformed by simpler MA systems that prove to be more robust against ranging markets. The total number of executed trades are on average 94, and the profitability is on average 31%. The strategy might prove more interesting if we can correct the behavior of the CMA, who sometimes converged toward ranging/flat markets.
SMA Cross Entry & Exit StrategyThis is a TradingView Strategy Script meaning you can't execute real trades using your exchange API connected to your TradingView account, it is designed for backtesting only
This is a basic backtesting script for charting the bullish and bearish cross of two user defined simple moving averages, select the cog next to the name of the script ON the price chart in the left hand corner. The script will print to the screen either "Long Entry" or "Short Entry" depending on the direction of the cross. The script using TradingView strategies will subsequently close the opposite of the position that is executed when the bullish or bearish cross occurs. Simply put, if you are short and a bullish cross occurs, your short trade will close and be logged in strategies and the long will fire. You can pyramid the long and short positions to continue entering as long as the trend doesn't flip. You will find this in the script settings. Since this script is for backtesting you can manually set the "backtesting range" for TradingView Strategies and firing the "Long Entry" and "Short Entry". This as well, is in the settings.
Notice: When the SMA cross occurs, you have to wait till the next candle before TradingView Strategy will print the "Long Entry" or "Short Entry" to the screen
TradingView - How To Use Strategies: www.tradingview.com

150MA Cross BuyAndSell Strategy [d3nv3r]This is a Buy And Sell Strategy I haven't seen anywhere so i share mine.
Used on Bitcoin - daily chart - the strategy generate sell and buy indicator on crossover and crossunder the 150 simple moving average.

Scripting Tutorial 9 - TManyMA Strategy - Long Market Order OnlyThis script is for a triple moving average strategy where the user can select from different types of moving averages, price sources, lookback periods and resolutions.
Features:
- 3 Moving Averages with variable MA types, periods, price sources, resolutions and the ability to disable each individually
- Crossovers are plotted on the chart with detailed information regarding the crossover (Ex: 50 SMA crossed over 200 SMA )
- Forecasting available for all three MAs. MA values are forecasted 5 values out and plotted as if a continuation to the MA.
- Forecast bias also applies to all forecasting. Bias means we can forecast based on an anticipated bullish, bearish or neutral direction in the market.
- To understand bias, please read the source code, or if you can't read the code just send me a message on here or Twitter. Twitter should be linked to my profile.
- Ribbons added and on by default. Optional setting to disable the ribbons. 5 ribbons between MA1 and MA2 and another 5 between MA2 and MA3.
- Ribbons are alpha-color coded based on their relation to their default MAs.
- Ribbons are only visible between MAs if the MAs being compared share the same Type, Resolution, and Source because there is no way to consolidate those three in a simple manner.
- Ribbon values are calculated based on calculated MA Periods between the MAs.
- Converted the existing study into a strategy
- Strategy only enters long positions with a market order when MA crossovers occur
- Strategy exits positions when crossunders occur
- Trades 100% of the equity with one order/position by default
- Ability to disable trading certain crosses with input checks
This script is meant as an educational script with well-formatted styling, and references for specific functions.
*** PLEASE NOTE - THIS STRATEGY IS MEANT FOR LEARNING PURPOSES. DEPENDING ON IT'S CONFIGURATION IT MAY OR MAY NOT BE USEFUL FOR ACTUAL TRADING. THE STRATEGY IS NOT FINANCIAL ADVICE ***

EMA X BF 🚀EMA Crossover Strategy
A simple EMA cross is a useful indication of a change in direction of a trend and is a very popular tool in trading. It can also be useful to judge price action momentum or severity by looking at the angle of the 2 EMAs, or the distance between them.
There are 2 Exponential Moving Averages, one fast and one slow. When the fast EMA crosses above the slow EMA, this can be considered bullish and may signal an upside move. Conversely, a cross to the downside of the fast EMA under the slow EMA can be considered bearish.
This strategy uses the same principle but uses different sources for the 2 EMAs; instead of using close values, we use ohlc4 values for the fast EMA and hlc3 values for the slow EMA.
The idea is that a trader might enter a long position upon a cross up and reverse position and go short upon the next cross down.
We use a simple 6% stop loss for both long and short positions.
This strategy is tuned to a 6hr chart for Bitcoin USD pairs.
INSTRUCTIONS
Go Long when the background is green
Go short when the background is red
White background means sideways market: a no trade zone

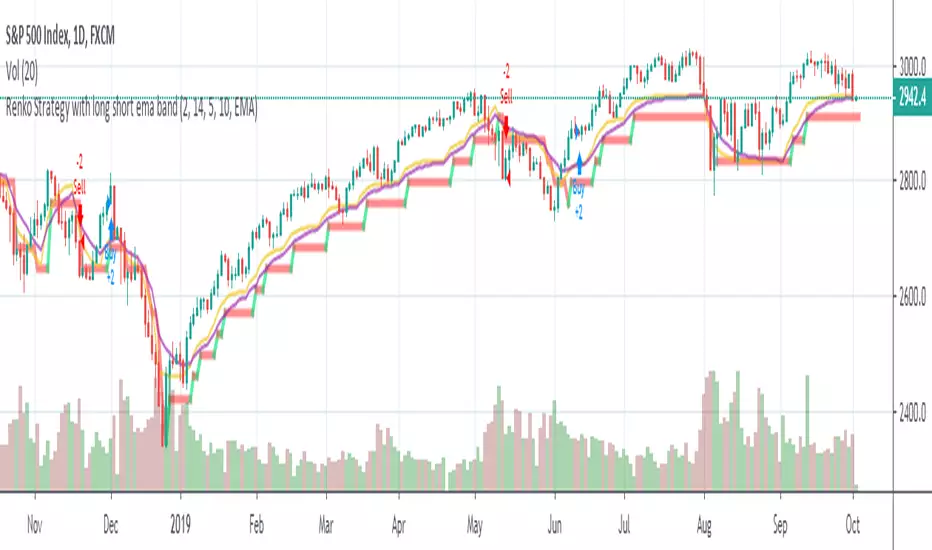
Renko Strategy with Ema against price crossover/underRenko Strategy with Ema against price crossover/under

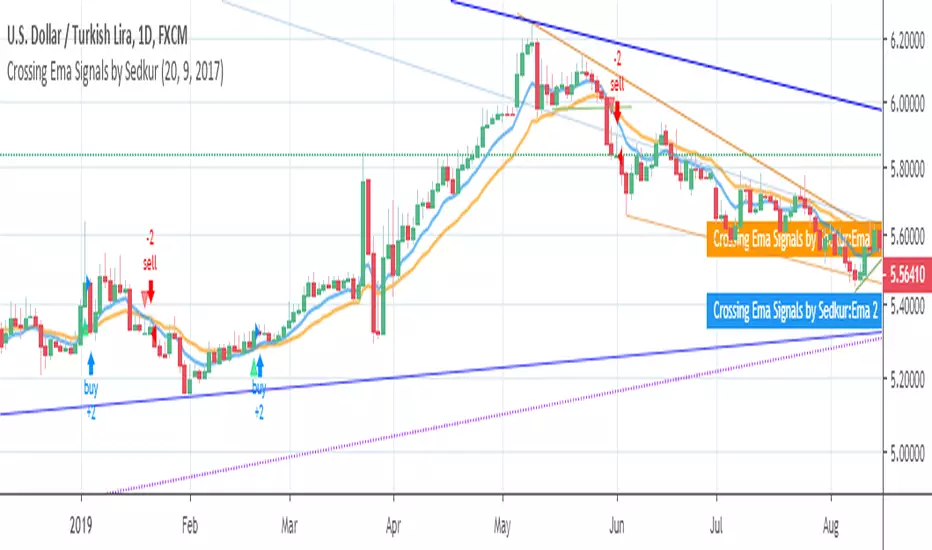
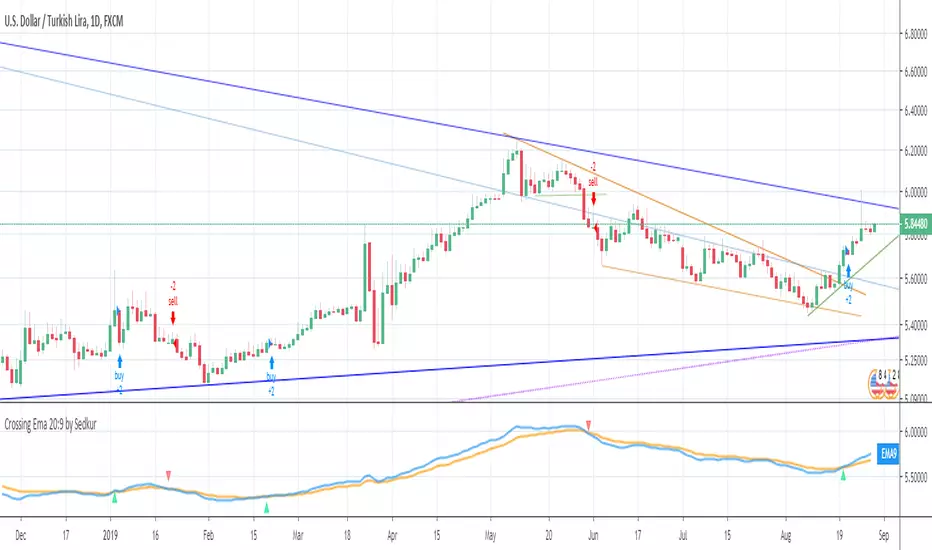
Crossing Ema Signals by SedkurGives an signals when 2 Ema's cross.
You can
- change EMA values
- change the signal start year
4 JMA Crossover Strategy (ps4)This is a PS4 update to my previous 4 JMA strategy that received many likes. In this and several recent strategies I use a simplified strategy setup, featuring trailing stops with very tiny increments. This is done intentionally in order to boost performance to the limit, so that to pinpoint that limit. Strategies with performance of about 90% or above are regarded as viable. Incorporating various overhead factors such as transaction costs, broker's spread, slippage, etc. at this stage creates too much 'noise' with the end result of losing the sight of the forest behind the trees.)) In practice, I disable the 'Use Strategy Setup' option and fine-tune parameters the way I want.
Tested security: EURUSD . Tested TF: 3m

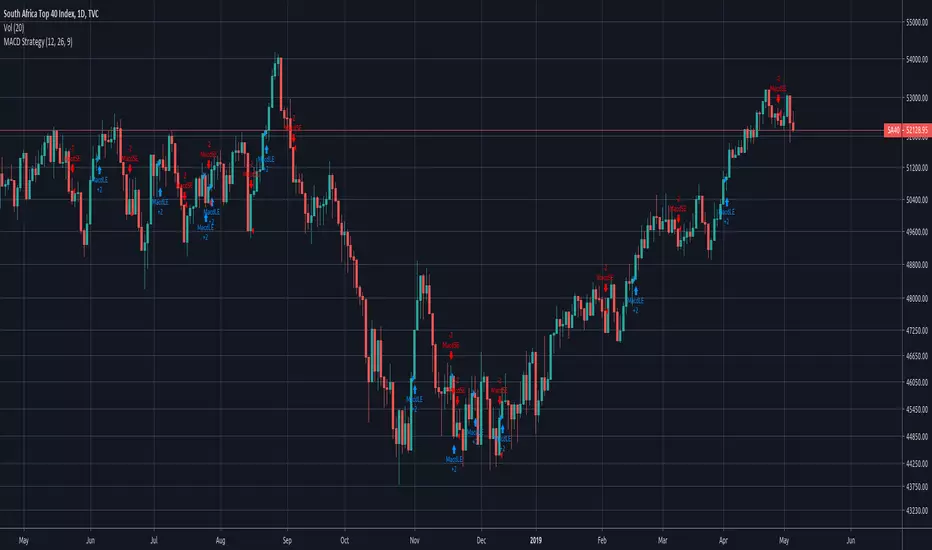
Simple MACD Strategy - CrossoverSimple MACD Crossover Strategy
No secret sauce here!
Script was requested by user
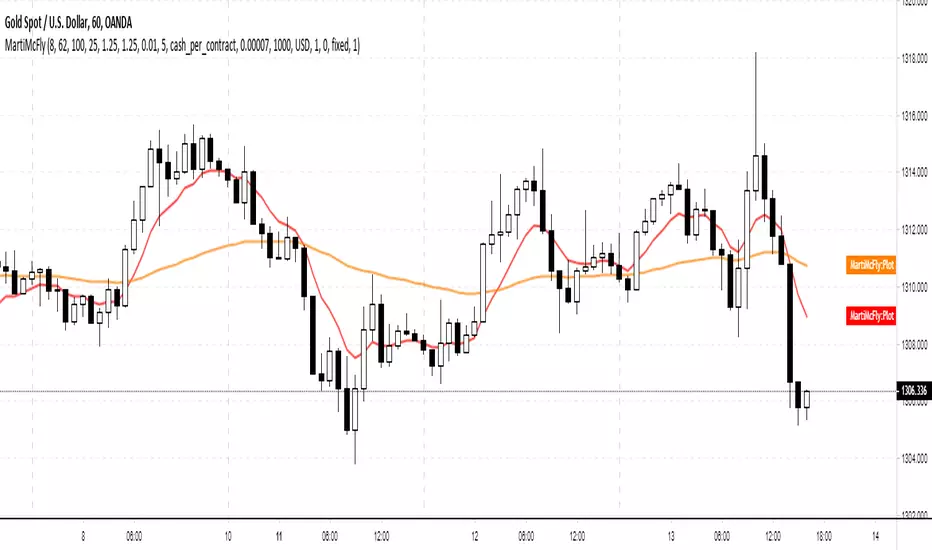
Decent Martingale Strategy [Pinescript v3]In my experimentation to add some sort of hedging to trades, I stumbled on the Martingale roulette betting strategy.
If it works in the casino, why not here?
The principle is simple:
If you lose a trade, immediately go the opposite direction and double your bet.
In this case, we're just applying a multiplier.
The strategy is a simple EMA crossover - defaulted to my favorite periods 8 and 62.
Enjoy :) I'll make a new one that's contained in a function, so you can simply implement it in your own strategy and have it monitor winning/losing trades automatically.
Cheers,
DasanC
13/21 EMA + Ichimoku Kinko Hyo StrategyThis trading strategy uses combination of the Ichimoku Kinko Hyo system with Fibonacci numbers based 13/21 exponential moving average ( EMA ) crossover, giving excellent results in trending assets !

EMA + Ichimoku Kinko Hyo StrategyThis trading strategy uses combination of the Ichimoku Kinko Hyo system with Fibonacci numbers based exponential moving average(EMA) and RSI 12/24 crossover, giving excellent results in trending stocks !

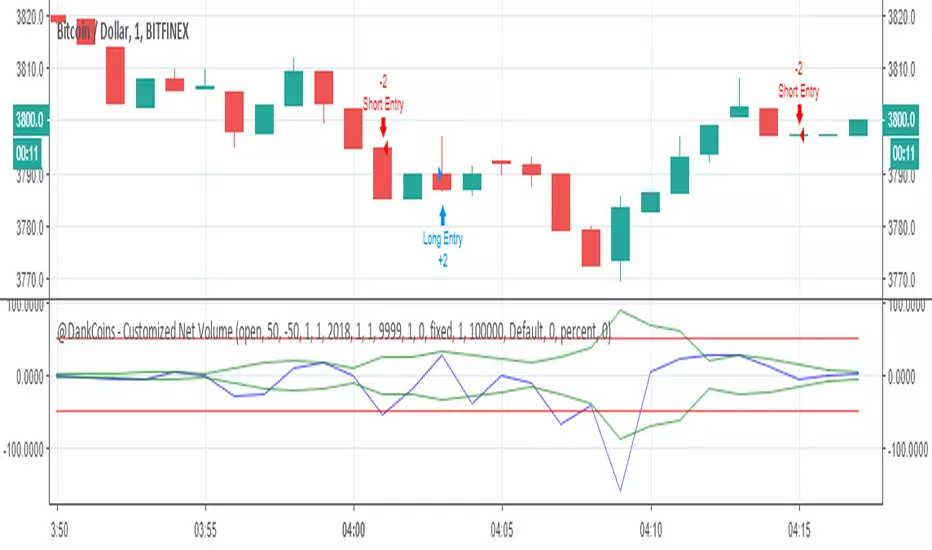
Help Requested - "Time-Slot" Delay for Crossover StrategyHello Tradingview Community,
I've been playing around with some various volume-based indicators, and recently have been experiencing a delay in the entries for my strategy for 2 minutes in this scenario. If the time is adjusted, it also is delayed 2 bars.
In this example, the "Short" position should enter when the blue line Crosses under the upper green line, and visa vera for the "Long" position. A simplified Pine Script is available below as well.
I have Googled this issue and attempted to modify the code with => criteria instead, but too no avail. Would appreciate any help or anyone who could point me in the right direction on this Time Delay Issue. Thanks!