Auto Intelligence Selective Moving Average(AI/MA)# 🤖 Auto Intelligence Moving Average Strategy (AI/MA)
**AI/MA** is a state-adaptive moving average crossover strategy designed to **maximize returns from golden cross / death cross logic** by intelligently switching between different MA types and parameters based on market conditions.
---
## 🎯 Objective
To build a moving average crossover strategy that:
- **Adapts dynamically** to market regimes (trend vs range, rising vs falling)
- **Switches intelligently** between SMA, EMA, RMA, and HMA
- **Maximizes cumulative return** under realistic backtesting
---
## 🧪 materials amd methods
- **MA Types Considered**: SMA, EMA, RMA, HMA
- **Parameter Ranges**: Periods from 5 to 40
- **Market Conditions Classification**:
- Based on the slope of a central SMA(20) line
- And the relative position of price to the central line
- Resulting in 4 regimes: A (Bull), B (Pullback), C (Rebound), D (Bear)
- **Optimization Dataset**:
- **Bybit BTCUSDT.P**
- **1-hour candles**
- **2024 full-year**
- **Search Process**:
- **Random search**: 200 parameter combinations
- Evaluated by:
- `Cumulative PnL`
- `Sharpe Ratio`
- `Max Drawdown`
- `R² of linear regression on cumulative PnL`
- **Implementation**:
- Optimization performed in **Python (Pandas + Matplotlib + Optuna-like logic)**
- Final parameters ported to **Pine Script (v5)** for TradingView backtesting
---
## 📈 Performance Highlights (on optimization set)
| Timeframe | Return (%) | Notes |
|-----------|------------|----------------------------|
| 6H | +1731% | Strongest performance |
| 1D | +1691% | Excellent trend capture |
| 12H | +1438% | Balance of trend/range |
| 5min | +27.3% | Even survives scalping |
| 1min | +9.34% | Robust against noise |
- Leverage: 100x
- Position size: 100%
- Fees: 0.055%
- Margin calls: **none** 🎯
---
## 🛠 Technology Stack
- `Python` for data handling and optimization
- `Pine Script v5` for implementation and visualization
- Fully state-aware strategy, modular and extendable
---
## ✨ Final Words
This strategy is **not curve-fitted**, **not over-parameterized**, and has been validated across multiple timeframes. If you're a fan of dynamic, intelligent technical systems, feel free to use and expand it.
💡 The future of simple-yet-smart trading begins here.
Crossovertrading

VIDYA ProTrend Multi-Tier ProfitHello! This time is about a trend-following system.
VIDYA is quite an interesting indicator that adjusts dynamically to market volatility, making it more responsive to price changes compared to traditional moving averages. Balancing adaptability and precision, especially with the more aggressive short trade settings, challenged me to fine-tune the strategy for a variety of market conditions.
█ Introduction and How it is Different
The "VIDYA ProTrend Multi-Tier Profit" strategy is a trend-following system that combines the VIDYA (Variable Index Dynamic Average) indicator with Bollinger Bands and a multi-step take-profit mechanism.
Unlike traditional trend strategies, this system allows for more adaptive profit-taking, adjusting for long and short positions through distinct ATR-based and percentage-based targets. The innovation lies in its dynamic multi-tier approach to profit-taking, especially for short trades, where more aggressive percentages are applied using a multiplier. This flexibility helps adapt to various market conditions by optimizing trade management and profit allocation based on market volatility and trend strength.
BTCUSD 6hr performance
█ Strategy, How it Works: Detailed Explanation
The core of the "VIDYA ProTrend Multi-Tier Profit" strategy lies in the dual VIDYA indicators (fast and slow) that analyze price trends while accounting for market volatility. These indicators work alongside Bollinger Bands to filter trade entries and exits.
🔶 VIDYA Calculation
The VIDYA indicator is calculated using the following formula:
Smoothing factor (𝛼):
alpha = 2 / (Length + 1)
VIDYA formula:
VIDYA(t) = alpha * k * Price(t) + (1 - alpha * k) * VIDYA(t-1)
Where:
k = |Chande Momentum Oscillator (MO)| / 100
🔶 Bollinger Bands as a Volatility Filter
Bollinger Bands are calculated using a rolling mean and standard deviation of price over a specified period:
Upper Band:
BB_upper = MA + (K * stddev)
Lower Band:
BB_lower = MA - (K * stddev)
Where:
MA is the moving average,
K is the multiplier (typically 2), and
stddev is the standard deviation of price over the Bollinger Bands length.
These bands serve as volatility filters to identify potential overbought or oversold conditions, aiding in the entry and exit logic.
🔶 Slope Calculation for VIDYA
The slopes of both fast and slow VIDYAs are computed to assess the momentum and direction of the trend. The slope for a given VIDYA over its length is:
Slope = (VIDYA(t) - VIDYA(t-n)) / n
Where:
n is the length of the lookback period. Positive slope indicates bullish momentum, while negative slope signals bearish momentum.
LOCAL picture
🔶 Entry and Exit Conditions
- Long Entry: Occurs when the price moves above the slow VIDYA and the fast VIDYA is trending upward. Bollinger Bands confirm the signal when the price crosses the upper band, indicating bullish strength.
- Short Entry: Happens when the price drops below the slow VIDYA and the fast VIDYA trends downward. The signal is confirmed when the price crosses the lower Bollinger Band, showing bearish momentum.
- Exit: Based on VIDYA slopes flattening or reversing, or when the price hits specific ATR or percentage-based profit targets.
🔶 Multi-Step Take Profit Mechanism
The strategy incorporates three levels of take profit for both long and short trades:
- ATR-based Take Profit: Each step applies a multiple of the ATR (Average True Range) to the entry price to define the exit point.
The first level of take profit (long):
TP_ATR1_long = Entry Price + (2.618 * ATR)
etc.
█ Trade Direction
The strategy offers flexibility in defining the trading direction:
- Long: Only long trades are considered based on the criteria for upward trends.
- Short: Only short trades are initiated in bearish trends.
- Both: The strategy can take both long and short trades depending on the market conditions.
█ Usage
To use the strategy effectively:
- Adjust the VIDYA lengths (fast and slow) based on your preference for trend sensitivity.
- Use Bollinger Bands as a filter for identifying potential breakout or reversal scenarios.
- Enable the multi-step take profit feature to manage positions dynamically, allowing for partial exits as the price reaches specified ATR or percentage levels.
- Leverage the short trade multiplier for more aggressive take profit levels in bearish markets.
This strategy can be applied to different asset classes, including equities, forex, and cryptocurrencies. Adjust the input parameters to suit the volatility and characteristics of the asset being traded.
█ Default Settings
The default settings for this strategy have been designed for moderate to trending markets:
- Fast VIDYA Length (10): A shorter length for quick responsiveness to price changes. Increasing this length will reduce noise but may delay signals.
- Slow VIDYA Length (30): The slow VIDYA is set longer to capture broader market trends. Shortening this value will make the system more reactive to smaller price swings.
- Minimum Slope Threshold (0.05): This threshold helps filter out weak trends. Lowering the threshold will result in more trades, while raising it will restrict trades to stronger trends.
Multi-Step Take Profit Settings
- ATR Multipliers (2.618, 5.0, 10.0): These values define how far the price should move before taking profit. Larger multipliers widen the profit-taking levels, aiming for larger trend moves. In higher volatility markets, these values might be adjusted downwards.
- Percentage Levels (3%, 8%, 17%): These percentage levels define how much the price must move before taking profit. Increasing the percentages will capture larger moves, while smaller percentages offer quicker exits.
- Short TP Multiplier (1.5): This multiplier applies more aggressive take profit levels for short trades. Adjust this value based on the aggressiveness of your short trade management.
Each of these settings directly impacts the performance and risk profile of the strategy. Shorter VIDYA lengths and lower slope thresholds will generate more trades but may result in more whipsaws. Higher ATR multipliers or percentage levels can delay profit-taking, aiming for larger trends but risking partial gains if the trend reverses too early.

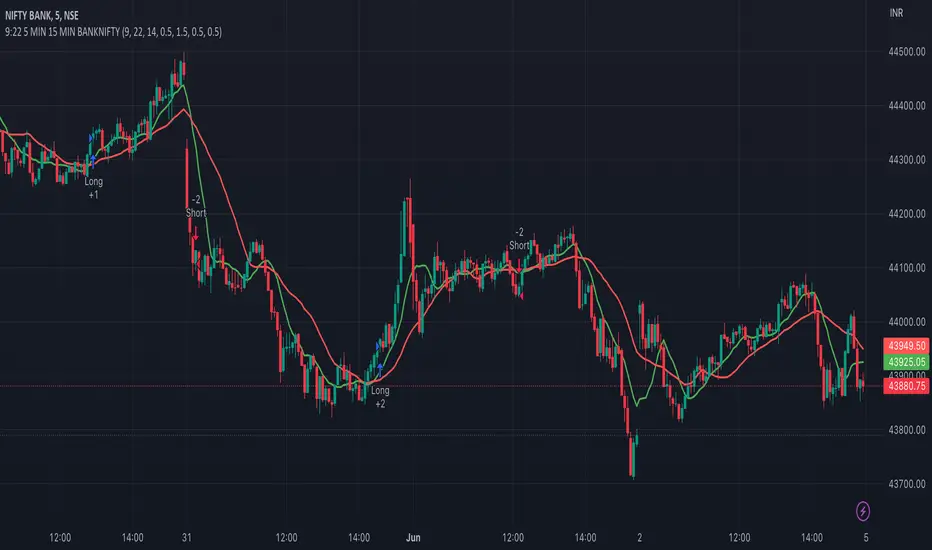
9:22 5 MIN 15 MIN BANKNIFTY9:22 5 MIN 15 MIN BANKNIFTY Strategy with Additional Filters
The 9:22 5 MIN 15 MIN BANKNIFTY Strategy with Additional Filters is a trend-following strategy designed for trading the BANKNIFTY instrument on a 5-minute chart. It aims to capture potential price movements by generating buy and sell signals based on moving average crossovers, breakout confirmations, and additional filters.
Key Features:
Fast MA Length: 9
Slow MA Length: 22
ATR Length: 14
ATR Filter: 0.5
Trailing Stop Percentage: 1.5%
Pullback Threshold: 0.5
Minimum Candle Body Percentage: 0.5
Use Breakout Confirmation: Enabled
Additional Filters:
Volume Threshold: Set a minimum volume requirement for trades.
Trend Filter: Optionally enable a trend filter based on a higher timeframe moving average.
Momentum Filter: Optionally enable a momentum filter using the RSI indicator.
Support/Resistance Filter: Optionally enable a filter based on predefined support and resistance levels.
Buy and Sell Signals:
Buy Signal: A buy signal is generated when the fast moving average crosses above the slow moving average, with additional confirmation from breakout and volume criteria, along with optional trend, momentum, and support/resistance filters.
Sell Signal: A sell signal is generated when the fast moving average crosses below the slow moving average, with similar confirmation and filtering criteria as the buy signal.
Exit Strategy:
The strategy employs a trailing stop-loss mechanism based on a percentage of the average entry price. The stop-loss is dynamically adjusted to protect profits while allowing for potential upside.
Please note that this strategy should be thoroughly backtested and evaluated in different market conditions before applying it to live trading. It is also recommended to adjust the parameters and filters according to individual preferences and risk tolerance.
Feel free to customise and adapt the description as needed to suit your preferences and the specific details of your strategy.
Swing Trades Validator - The One TraderThis swing trading strategy validator is built on the original strategy taught in my bootcamp for swing traders.
The strategy is simple and follows a trend trading pattern on prices reacting to Exponential Moving Averages over a multiple time-frame analysis.
The details of the strategy are as follows:
- Holding Period : Upto a couple of months
- Time-frames to be analysed : Month - Week - Day
- Trade Execution : Daily Time-frame
Analysis Details:
Step 1 : On the Monthly time-frame, the candle needs to be bullish with the latest close being higher than the opening price of the month.
Step 2 : The price needs to be above the 8ema on the Monthly time-frame.
Step 3 : The 8ema must be above the 20ema on the Monthly time-frame.
The above steps indicate a bullish strength in the instrument on the Monthly time-frame.
Step 4 : On the Weekly time-frame, the candle needs to be bullish with the latest close being higher than the opening price of the week.
Step 5 : The price needs to be above the 8ema on the Weekly time-frame.
Step 6 : The 8ema must be above the 20ema on the Weekly time-frame.
The above steps indicate a bullish strength in the instrument on the Weekly time-frame.
Step 7 : On the Daily time-frame, the candle needs to be bullish with the latest close being higher than the opening price of the day.
Step 8 : The price needs to be above the 8ema on the Daily time-frame.
Step 9 : The 8ema must be above the 20ema on the Daily time-frame.
The above steps indicate a bullish strength in the instrument on the Daily time-frame.
Step 10 : While the 8ema is above the 20ema on the Daily time-frame, the price must be allowed to rise before a pullback is seen towards the moving averages, indicating a bearish move trying to change the trend.
Step 11 : These pullback candles need to form a pattern called the Ring Low with the second pullback candle having a lower high and lower low and the low of the last pullback candle being lesser than or equal to the fat ema on the Daily time-frame.
Step 12 : If the stock is still bullish and the trend is displaying a strength in the underlying bullish direction, then there will be a resumption candle that will have a closing price higher than the previous day's high price.
This trend continuation signal is a confirmation that the instrument will continue in the underlying trend direction and we will be able to enter if this condition is satisfied.
The profit and loss percentages are set at a default 10% as this can be a minimum risk : reward for swing trades on average, but the inputs have been made available to the users in order to adjust the risk : reward to find the most optimum breathing room for each individual stock or instrument. This will give the user a highly custom overview of the strategy on individual instruments based on their volatility and price movements.
The strategy tester will auto back-test this strategy historically and find all the trades that were taken based on this strategy and populate a performance summary.
The most important data in V1.0 of this script are as follows:
1. No. of Trades Taken : We want to see many trades being taken on this strategy in that particular instrument. This shows us a healthy report on the number of winning vs. losing trades.
2. Percentage Profitable : We want to see that this strategy has worked out in the past and is giving us a high probability of return. This in no way an indication that the strategy will definitely work out in the future as well, but gives us an idea of whether or not we should enter this trade.
3. No. of Winning Trades vs. Losing Trades : We would like to see a significantly higher number of winning trades.
4. Avg. # of bars in a trade : This gives us an idea of how long on average we might have to wait to see the results of this strategy either in favor of our reward or against our desired direction. Some trades can be completed in around 15-20 bars on average and some trades have shown to take upto 45 days to reach desired reward. This is in line with our planned holding period, but gives the trader a sense of time and increased level of patience.
The future updates will have more utility of the various elements of the strategy tester and the entire exit strategy will be integrated into the script.
This script is not to be used as a standalone method and must be studied well in order to execute trades. I have not hidden visibility on other time-frames, but since order execution is done on the Daily time-frame, the script must run on the Daily time-frame only.
There are many other factors to be taken into consideration before entering a trade and proper risk management and position sizing rules must be followed.
Our bootcamp participants will use this strategy tester in conjunction with the invite-only Trading Toolkit assigned to them.
The development of this script will be ongoing and all comments and feedback are welcome.

Classic Long Term Trend Following SystemThis is a classic long term trend following system.
The breakout period is 50 days instead of 20 and the moving average crossover are 40 and 120.
The moving averages are also exponential instead of simple.
The stoploss is 4 ATRs away from the price.
Recommendations:
Donchian Channels settings > 50 days
Moving Averages > 40 and 120, 80 and 140
Important to note:
My first strategy, DC Breakout System | This is simplicity at its finest, is best used on the crypto market and this one for stocks, commodities, currencies, etc. Those markets tend to trend a lot longer than crypto do.

DC Breakout Strategy | This is simplicity at its finest.As the title already describes: this is a Donchian breakout strategy. This strategy, as of now, only goes long. It goes long when the price close makes a new high and the 8 day moving average is above the 32 day moving average. The strategy exits the trade if the price breaks the atr trailing stop of * 3 or the 8 day moving average crosses below the 32 day moving average.
This is simplicity at its finest.

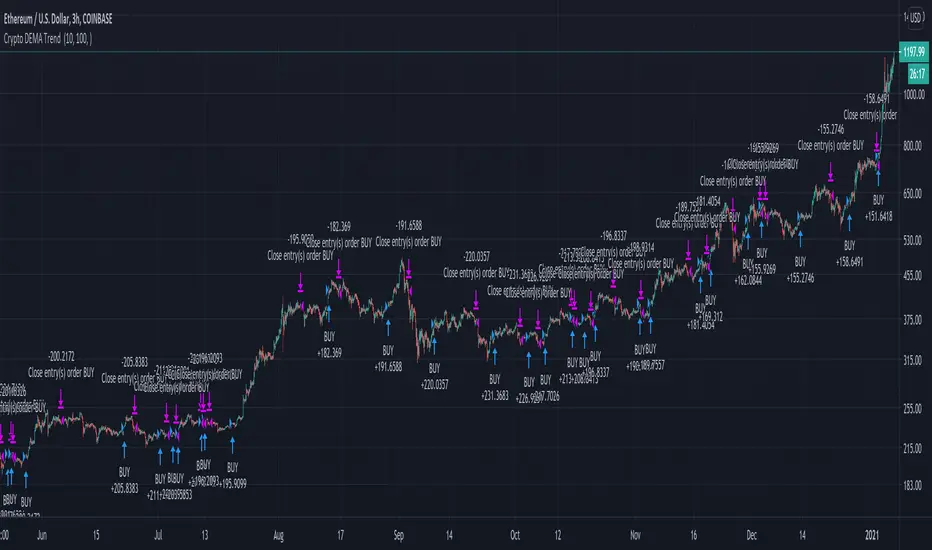
Best Crypto DEMA Strategy Long onlyThis is a crypto strategy suited for big time frames like 3h+.
THIS IS A LONG ONLY STRATEGY , SUITED TO BEAT BUY AND HOLD !
It's a very risky strategy because it has no stop loss at all, so be extremely careful with it.
This strategy is made of 2 DEMA a fast and a slow one.
We have two rules : entry it's when we have a crossunder between the slow DEMA and the fast DEMA. We exit when the opposite happens, in this case, when the slow is above fast.
For this example I used an initial capital of 1000 eur, using 100% of it always, and a commission of 0.2% per each deal.
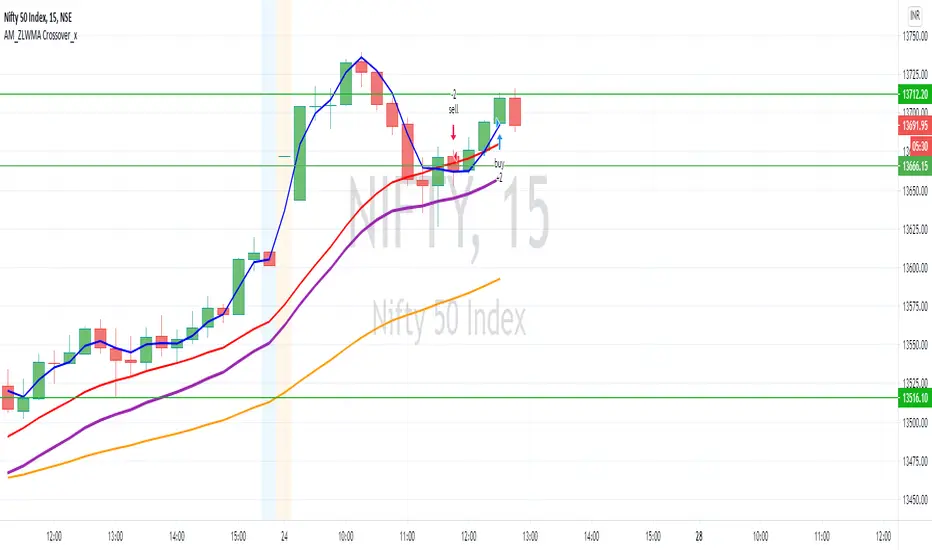
AM_ZLWMA Crossover_xDear All,
Please find updated version of Zero lag WMA crossover. In addition to this added 20/50 EMA to get better results.
Settings:
ZLWMA = 8 identified by Blue line
Fast WMA = 21 identified by Red line
EMA Period 20/50
How to Trade:
Buy: Wait for positive crossover (Blue cross above Red) to happen trade can be taken there but to get better results post crossover once price move above EMA 20 then buy can be initiated.
Sell: Wait for negative crossover (Blue cross below Red) to happen trade can be taken there but to get better results post crossover once price move below EMA 20 then sell can be initiated.
Reason to wait for confirmation of price action above / Below moving average is most of the time it happens that even after crossover happens sometimes it was just a pull back and from there it could be a possibility for reversal. Once price action confirms moving above / below EMA20 then trade will be initiated.
Please comment and ask for any doubt
Bitlinc MARSI Study AST w/ Take Profit & Stop loss - beta 0.1This script is beta 0.1 - will update as soon as the script is tradable
This script is based on AST on a 10 minute timeframe. You can change the asset and the timeframe for any asset you want to trade, but for it to work correct ALL settings have to be testes in the Strategy section of the TradingView. Each assets and timeframe require a different mixture of settings. This is NOT a one settings fits all trading for all assets on any timeframe. Below are the settings and explanation on how it works.
How it fires a buy / sell:
The script will plot an RSI with upper and lower bands in a separate indicator window. The idea behind this script is to fire a LONG when MA crosses OVER lower band and fire a SHORT when the MA crosses under the lower band. Each order that fires is an OCO (Order Cancels Order) for pyramiding.
Settings:
You have full control of these settings as mentioned above, you must configure every part of this script for each asset and timeframe you trade.
- Length of MA
- Length
- Upper bands of RSI
- Lower bands of RSI
- Take profit percentage
- Stop loss percentage
- Month to start and end the strategy (within 2020)
- Day to start and end the strategy (within 2020)
- Quantity type
- Slippage
- Pyramiding
***Remember that after the signal to enter or exit a trade is fired, the alert will trigger AFTER the close of the candle that caused the tigger to fire

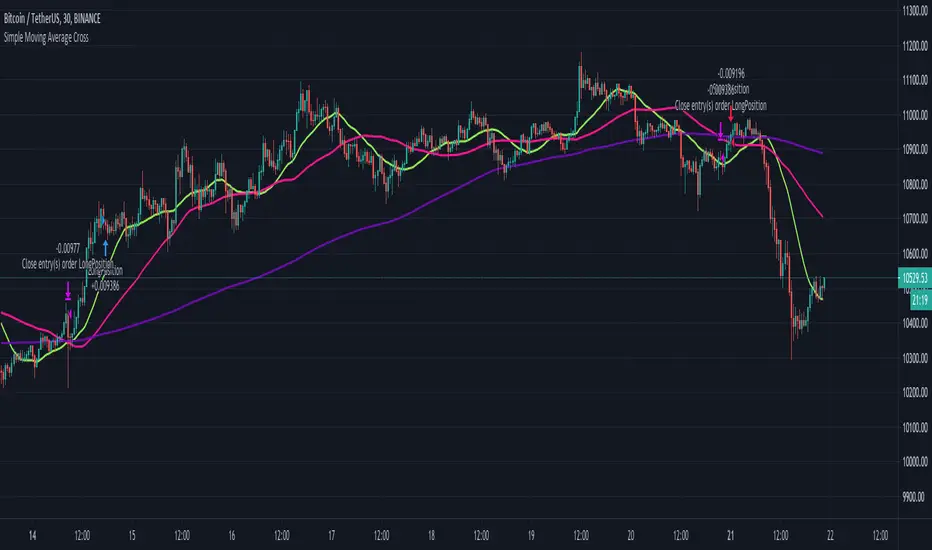
Simple Moving Average CrossThe script uses 3 simple moving averages that you can define (SMA Top, SMA Mid, SMA Long).
Once the SMA Top is above the SMA Mid and the SMA Mid is above the SMA Top a long position is entered.
Once the SMA Top is below the SMA Mid and the SMA Mid is below the SMA Top a short position is entered.
You may define how long before these positions are entered by adjusting the bars in the Inputs section.
A setting of 0 will enter a position as soon as the conditions are met,
whereas a setting of 5 will wait 5 bars after the conditions are met before entering the positions.