CRYPTO Trend Direction Multiple EMA'sToday I bring an indicator specialized in crypto markets.
Its made of multiples EMA : very fast, fast, normal, slow, very slow
The logic behind its simple :
For long : we check that the EMA are in ascending order like EMA 5 > EMA 10 > EMA 20 .... and at the same time that last close of candle is above all of them.
For short : we check that the EMA are in descending order like EMA 5 < EMA 10 < EMA 20 .... and at the same time last close of candle is below all of them.
It can be used with all time frames.
Enjoy it !
Cripto

Crypto EMA+MA+MACS by hobbeLeThis is an indicator that includes several EMAs and MAs (Used in Cryptotrading).
In addition, the Golden and Death Cross are also displayed.
Used MAs
MA 7 - Orange Line
MA 21 - Yellow Line
MA 25 - Grey Line
MA 99 - Blue Line
MA 200 - Green Line
Used EMAs
EMA 200 - Grey Dotted Line
EMA 222 - Pink Dotted Line
Golden Cross
Crossover MA25 + MA200
Death Cross
Crossunder MA25 + MA200
What is a Moving Average (MA) ?
A moving average (MA) is a widely used indicator in technical analysis that helps smooth out price action by filtering out the “noise” from random short-term price fluctuations.
Moving average is a trend-following, or lagging, indicator because it is based on past prices. The most common applications of moving averages are:
to identify the trend direction
to determine support and resistance levels
The two basic and commonly used moving averages are the simple moving average ( SMA ), which is the arithmetic average of a security over a defined number of time periods, and the exponential moving average ( EMA ), which gives greater weight to more recent prices.
What is a Golden Cross?
The golden cross is a candlestick pattern that is a bullish signal in which a relatively short-term moving average crosses above a long-term moving average. The golden cross is a bullish breakout pattern formed from a crossover involving a security's short-term moving average (such as the 15-day moving average) breaking above its long-term moving average (such as the 50-day moving average) or resistance level. As long-term indicators carry more weight, the golden cross indicates a bull market on the horizon and is reinforced by high trading volumes.
What Is a Death Cross?
The death cross is a technical chart pattern indicating the potential for a major selloff. The death cross appears on a chart when a stock’s short-term moving average crosses below its long-term moving average.
Source; Investopedia

Percent Drop from Highest HighBuy and hold investors may decide to use trailing stops to protect profits and capital from market crashes, especially during bull markets.
The purpose of this indicator is to hep investors to identify a location to place them. The indicator plots the highest high from 'x' bars ago. It then plots a trailing stop loss 'y' percent below that line.
The indicator enables its users to input different 'x' and 'y' values to observe what they think works best for them in different markets.
Users might choose to pair the indicator with trend confirming indicators, such as moving average cross overs, to determine that the market is trending and not ranging.
There is no magic in this indicator, only maths. Like every indicator, it has no ability to predict anything. Just because the market is doing one thing now, it might do something different later. The past does not equal the present nor the future. Make your own decisions and be responsible for them.
All the best to you and your family.

Ultimate VWAP Bands- Ultimate VWAP Bands is a script that helps to decide and further clarify areas of oversold and overbought conditions.
- For example, when the price is in the lowest band it is extremely oversold relative to the VWAP . Hence it should be considered a good place to buy with a high risk to reward payoff.
- Each band is set at a fixed offset away from the VWAP . The "VWAP Band Multiplier" adjusts this and is a key part of the script. This allows the indicator to be adjusted based on the assets volatility . For example, with Crypto. A multiplier of 1 would be strongly advised. Whilst a multiplier of 0.1-0.25 would be useful for currency pairs.
- This indicator can be used for all manners of trading. However, it is most effective when used for scalping and swing trading.

Bitcoin DAA OscillatorAn oscillator of Bitcoin's Daily Active Addresses (DAA) and fundamental metric of the utilization of the Bitcoin network.
Helps to identify:
Potential buy zones (green) - when the network utilization is low & increasing
Potential sell zones (red) - when the network utilization is high & decreasing

Dynamic Dots Dashboard (a Cloud/ZLEMA Composite)The purpose of this indicator is to provide an easy-to-read binary dashboard of where the current price is relative to key dynamic supports and resistances. The concept is simple, if a dynamic s/r is currently acting as a resistance, the indicator plots a dot above the histogram in the red box. If a dynamic s/r is acting as support, a dot is plotted in the green box below.
There are some additional features, but the dot graphs are king.
_______________________________________________________________________________________________________________
KEY:
_______________________________________________________________________________________________________________
Currently the dynamic s/r's being used in the dot plots are:
Ichimoku Cloud:
Tenkan (blue)
Kijun (pink)
Senkou A (red)
Senkou B (green)
ZLEMA (Zero Lag Exponential Moving Average)
99 ZLEMA (lavender)
200 ZLEMA (salmon)
You'll see a dashed line through the middle of the resistances section (red) and supports section (green). Cloud indicators are plotted above the dashed line, and ZLEMA's are below.
_______________________________________________________________________________________________________________
How it Works - Visual
_______________________________________________________________________________________________________________
As stated in the intro - if a dynamic s/r is currently above the current price and acting as a resistance, the indicator plots a dot above the histogram in the red box. If a dynamic s/r is acting as support, a dot is plotted in the green box below. Additionally, there is an optional histogram (default is on) that will further visualize this relationship. The histogram is a simple summation of the resistances above and the supports below.
Here's a visual to assist with what that means. This chart includes all of those dynamic s/r's in the dynamic dot dashboard (the on-chart parts are individually added, not part of this tool).
You can see that as a dynamic support is lost, the corresponding dot is moved from the supports section at the bottom (green), to the resistances section at the top (red). The opposite being true as resistances are being overtaken (broken resistances are moved to the support section (red)). You can see that the raw chart is just... a mess. Which kinda of accentuates one of the key goals of this indicator: to get all that dynamic support info without a mess of a chart like that.
_______________________________________________________________________________________________________________
How To Use It
_______________________________________________________________________________________________________________
There are a lot of ways to use this information, but the most notable of which is to detect shifts in the market cycle.
For this example, take a look at the dynamic s/r dots in the resistances category (red background). You can see clearly that there are distinctive blocks of high density dots that have clear beginnings and ends. When we transition from a high density of dots to none in resistances, that means we are flipping them as support and entering a bull cycle. On the other hand, when we go from low density of dots as resistances to high density, we're pivoting to a bear cycle. Easy as that, you can quickly detect when market cycles are beginning or ending.
Alternatively, you can add your preferred linear SR's, fibs, etc. to the chart and quickly glance at the dashboard to gauge how dynamic SR's may be contributing to the risk of your trade.
_______________________________________________________________________________________________________________
Who It's For
_______________________________________________________________________________________________________________
New traders: by looking at dot density alone, you can use Dot Dynamics to spot transitionary phases in market cycles.
Experienced traders: keep your charts clean and the information easy to digest.
Developers: I created this originally as a starting point for more complex algos I'm working on. One algo is reading this dot dashboard and taking a position size relative to the s/r's above and below. Another cloud algo is using the results as inputs to spot good setups.
Colored Bars
There is an option (off by default, shown in the headline image above) to fill the bar colors based on how many dynamic s/r's are above or below the current price. This can make things easier for some users, confusing for others. I defaulted them to off as I don't want colors to confuse the primary value proposition of the indicators, which is the dot heat map. You can turn on colored bars in the settings.
One thing to note with the colored bars: they plot the color purely by the dot densities. Random spikes in the gradient colors (i.e. red to lime or green) can be a useful thing to notice, as they commonly occur at places where the price is bouncing between dynamic s/r's and can indicate a paradigm shift in the market cycle.
_______________________________________________________________________________________________________________
Timeframes and Assets
_______________________________________________________________________________________________________________
This can be used effectively on all assets (stocks, crypto, forex, etc) and all time frames. As always with any indicator, the higher TF's are generally respected more than lower TF's.
Thanks for checking it out! I've been trading crypto for years and am just now beginning to publish my ideas, secret-sauce scripts and handy tools (like this one). If you enjoyed this indicator and would like to see more, a like and a follow is greatly appreciated 😁.

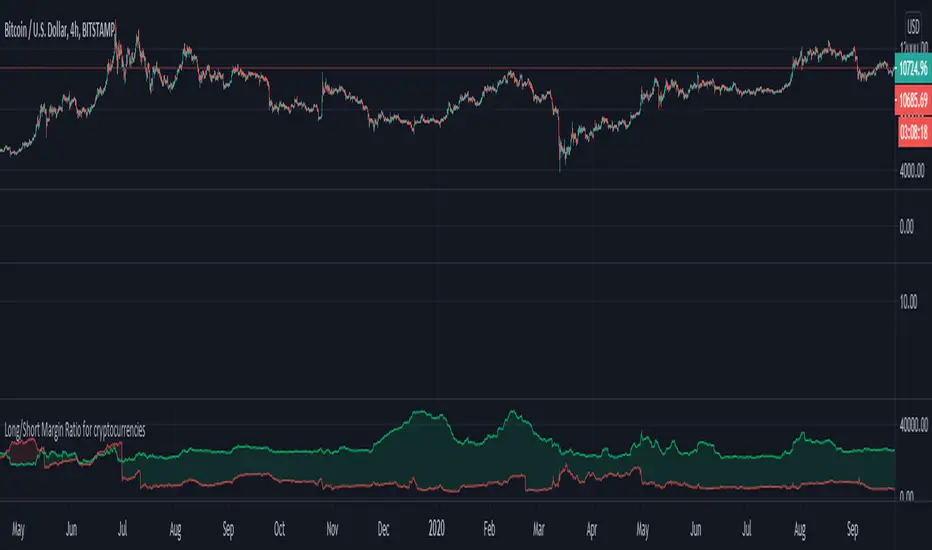
Long/Short Margin Ratio for cryptocurrenciesBTCUSDSHORTS and BTCUSDLONGS are like datasets provided by Bitfinex exchange. They record the number of margined for longs and shorts and they are measured in BTC (in case using BTCUSD ).
Margin is Like any loan, the borrower may pay interest while the loan is outstanding, and must eventually pay the loan back.
Red Area: More short margin than long margin.
Green Area: More long margin than short margin.
Note: Can only be used with cryptocurrencies that have such dataset within Bitfinex exchange like BTCUSD , ETHUSD , XRPUSD and a few more.
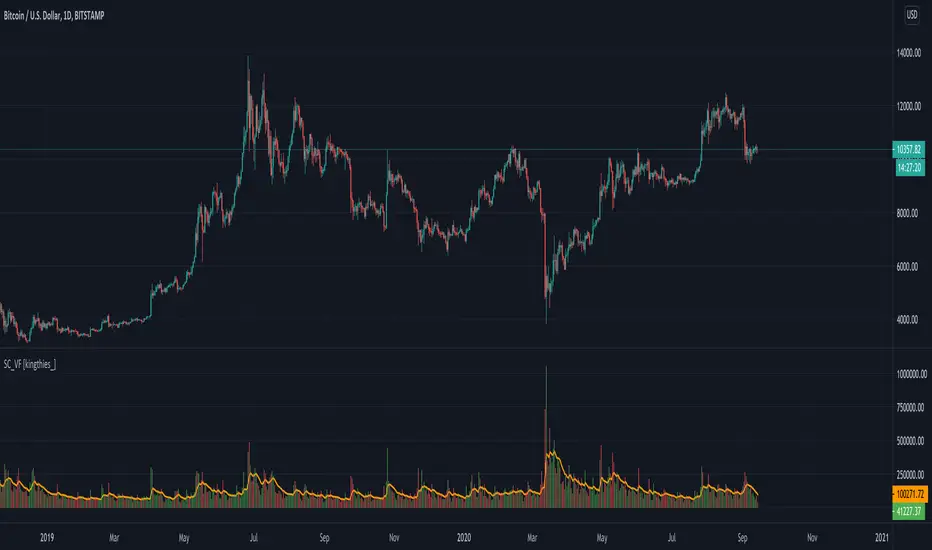
Stablecoin Volume Flow [kingthies_]Stablecoin Volume Flow into BTCUSD/BTC-Stablecoin pairings
Exchanges Used
Coinbase
Kraken
Bittrex
Binance
Huobi
Bitstamp
Gemini
Bitfinex
Our aim here is simple...to combine the overall volume flow from Fiat or stable currencies into the crypto-markets.
This is the first portion of a series I plan to share involving a holistic approach to understanding the overall crypto-ecosystem. I've included several of the highest ranking by volume exchanges and their accompanying older/well known stablecoins.
Also, the historic data for the newer stable coins made the study invalid due to limited sample size. That included coins like USDC, DAI, GUSD, BUSD and more. For this reason, the 10 sources of data here adequately provide the data needed to see a full view of the market volume going in and out of bitcoin at any given moment
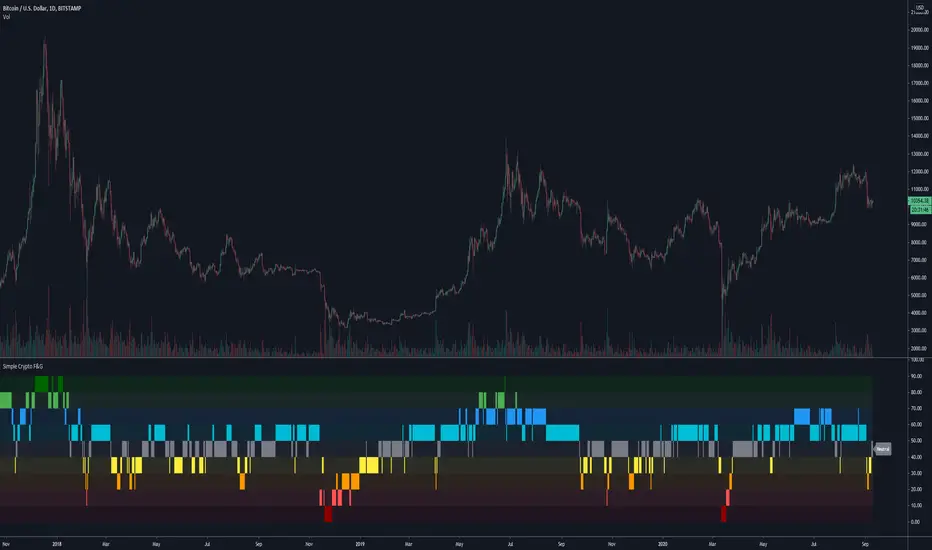
Simplified Crypto Fear & Greed DisplayA more simplified view of a Fear & Greed index.
This script has been made public because it uses Trading Psychology - Fear & Greed Index by DGT as the basis/inspiration for it.
I've re-imagined the visuals in order to display F&G data differently to the more traditional versions of the indicator floating around, as well as adapting it's calculations and reference assets for use with Crypto markets.
It's aim is to show the current status / mindset of market participants at a quick glance.
When there is a lot of fear in the market it is usually a good time to look for buying opportunities.
On the flip side you can use it to spot selling opportunities when there is too much greed / FOMO in the markets.
This indicator has the option for Traditional and Crypto markets.
The Traditional option uses the tickers VIX and GOLD as part of it's calculations, where as Crypto uses BVOL24H and BTC.D in order to base it's decisions off of more relevant data.
There are also 10 levels of smoothing so play around with that to get the desired result. Depending on the asset you are looking at, smoothing of 1 or 2 may work much better than 5+
Have a play around, customize it, use it and let me know what you think.
RSI + MFI - Crypto Bull and Bear market A fancy styled version of the RSI (Relative Stochastic Index) + MFI (Money Flow Index) oscillators in order to emphasize buy and sell opportunities.
The 80 and 20 Bands are meant to be used in Bull or Bear markets. Better performing in D timeframes.
The circles represent the cross between RSI and MFI .
Designed for Crypto Markets
Thanks @micheleprandina
Credits:

Risk Metrics: Crypto VersionRisk Metrics for Crypto.
Market can be set to BTCUSD, BTCEUR, BTCCHF, BTCGBP, BTC1!, BTC2!, SPX, and DTB3
Beta
Correlation
Standard Deviation
Variance
R-squared

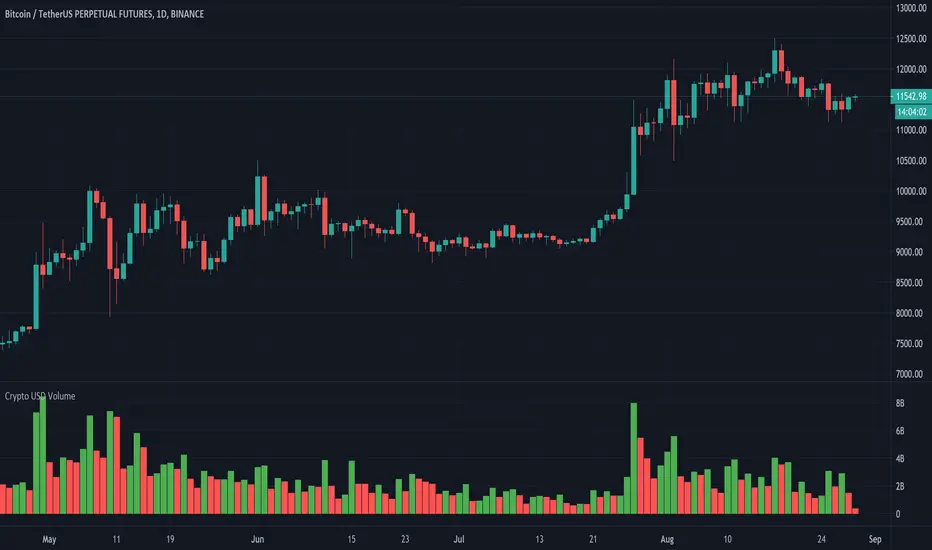
Crypto USD VolumeOften times I need to check the volume in cryptocurrency exchanges and I find myself checking which type of volume I am looking at, I need to manually make sense what the data is and converting it into USD volume which I end up going to CoinMarketCap website to verify whether my calculation is right.
Today I thought it was about time I created an automatic way to find the volume in USD Dollars. This is what this script does.
1 - It removes the base currency from the symbol (e.g., "BTCUSD", it would remove "BTC", leaving us with the "USD" part.). This is important because it helps us identify the currency the pair uses.
2 - It has different pair's variables, each is given a specific currency that the final volume is calculated from. (BTC, ETH, BNB and USD are the default currencies, for other ones, it must be added manually).
This works with all crypto symbols that include BTC, ETH, BNB and USD as currencies. If you modify it, please make sure to compare data with the exchange's one.
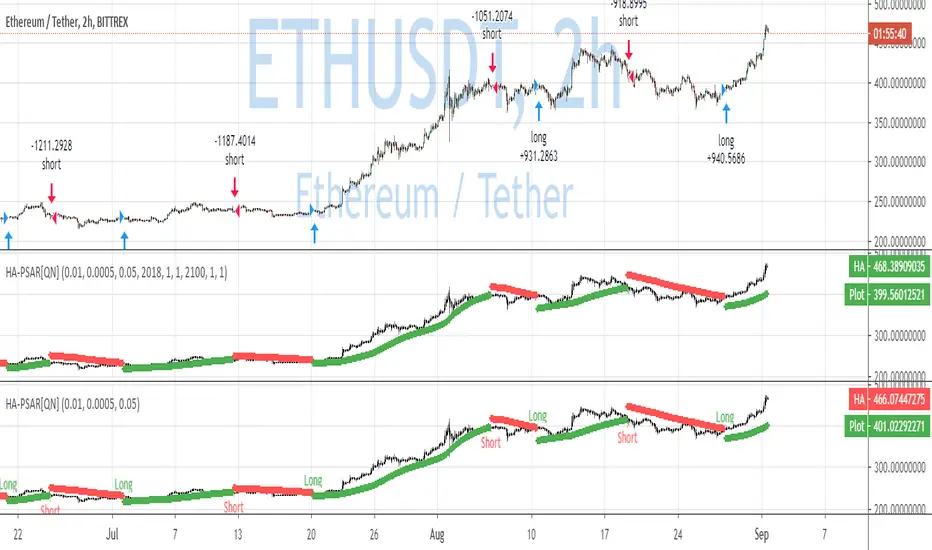
QuantNomad - Heikin-Ashi PSAR AlertsUsing this script you can create alerts for my Heikin-Ashi PSAR Strategy:
When creating alerts use "Once Per Bar Close" in parameters.
####################
Disclaimer
Please remember that past performance may not be indicative of future results.
Due to various factors, including changing market conditions, the strategy may no longer perform as good as in historical backtesting.
This post and the script don’t provide any financial advice.
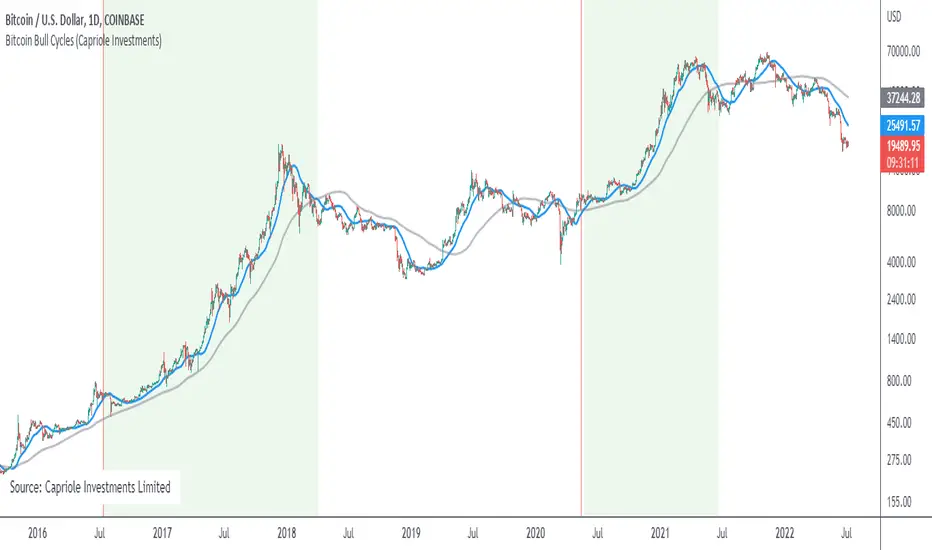
Bitcoin Bull CyclesA simple indicator that identifies the primary upswing of Bitcoin following each Halving, the "Bull Cycle".
A "Bull Cycle" is identified as the first period of positive momentum after each Halving date, defined as the 50 Daily Moving Average (DMA) being above the 200 DMA.
ICT Killzone For Crypto Markets.Adjusted for Crypto 24/7 markets
Adjusted for UTC
i have hidden the asian open range and daily bars on my charts , you can choose to have them on
Less screen clutter
London Open 8:00 - 4:30 - Killzone 7:00 - 9:00
NewYork Open 9:30 - 4:00 Killzone 8:00 - 10:00
Shanghai open 9:15 Killzone 8:00 - 10:00
NOT MY ORIGINAL SCRIPT. JUST MODIFIED VERSION

TA Night Bot AlertsThe absolutely most insane indicator for the Cryptoassets
With this script signals for short and long positions are recognized. It still has some false signals during extreme market movements, furthermore it runs best in the 15min & 5min chart. You can increase your risk limit in the settings. The indicator is based on different indicator values.
the indicator is a component of a superordinate algorithm and therefore not perfect.
who would like to test it pm
BTC
ETH
EOS
XRP

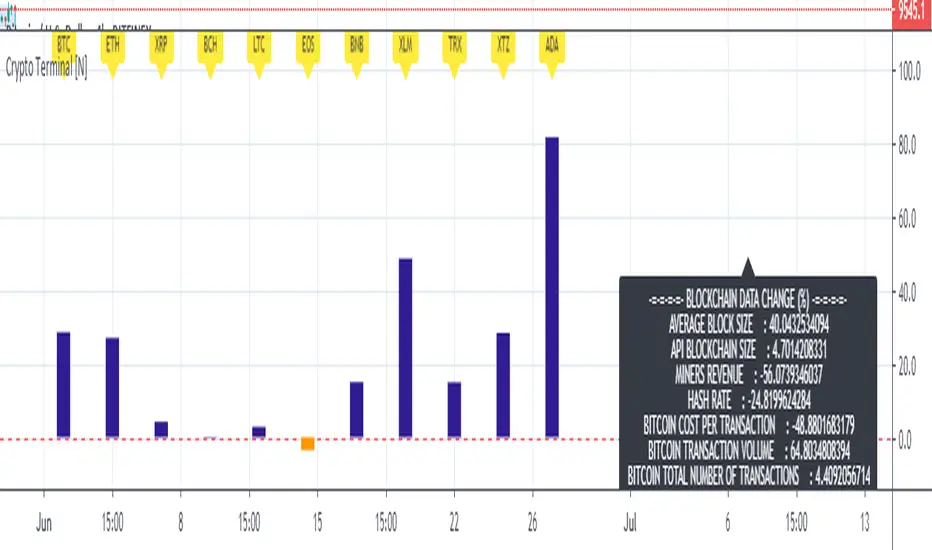
Basic Cryptocurrency TerminalHello,
This script is a simple Cryptocurrency Terminal.
It serves the same purpose as Heatmaps.
You can also set the period to look back manually in the menu.
Major Cryptocurrencies are taken into account.
And various Blockchain data are shown in the information panel.
In this way, an idea can be obtained about Cryptocurrency Market.
It is visually more convenient and clear to use in an indicator window under the chart, not on the chart, as follows:
Regards.
ADX and DI For Cryptocustomized version to add my favourite settings for crypto
Best time frame is daily followed by 4H
ADX Near 20 or less means trend is choppy and weak
ADX Cross over 30 means trend is starting to gain momentum
ADX Near 75 means momentum is near maximum, trend needs to rest for a while ( The area between 70~90 )
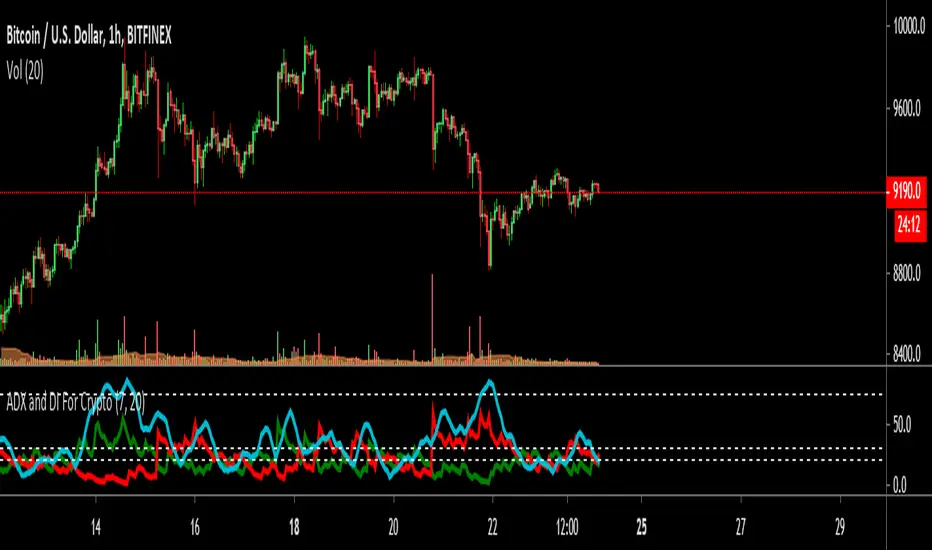
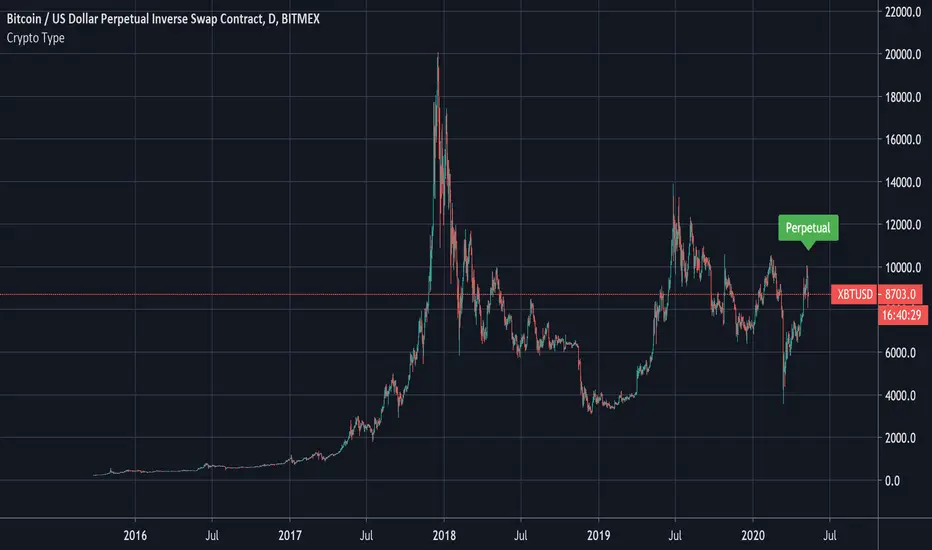
Crypto Type: Regular, Perpetual, Or Futures?A simple way to find out if the security in question is a regular, perpetual, or futures pair.
This reads the data of the security's description and sees if the word perpetual or futures is mentioned.
The method to check if a string has the letters we seek was first introduced by MichelT .
Thank you for checking this out and I hope this helps unlocking new hidden potential.
Crypto Market CorrelationThis script utilized some new functions in Pine Script, which compares the correlation between the current symbol to a basket of crypto indexes that are listed on the FTX exchange.
By tracking these indexes we can gauge the reaction across markets that have a different market cap. By that I mean we can have a better idea about where the money is flowing into a specific market.
This script uses data from FTX:BTCPERP, FTX:ALTPERP, FTX:MIDPERP, FTX:SHITPERP, FTX:EXCHPERP, FTX:DRGNPERP.
A value closer to 1 equals to more correlation, closer to 0 equals to less correlation.

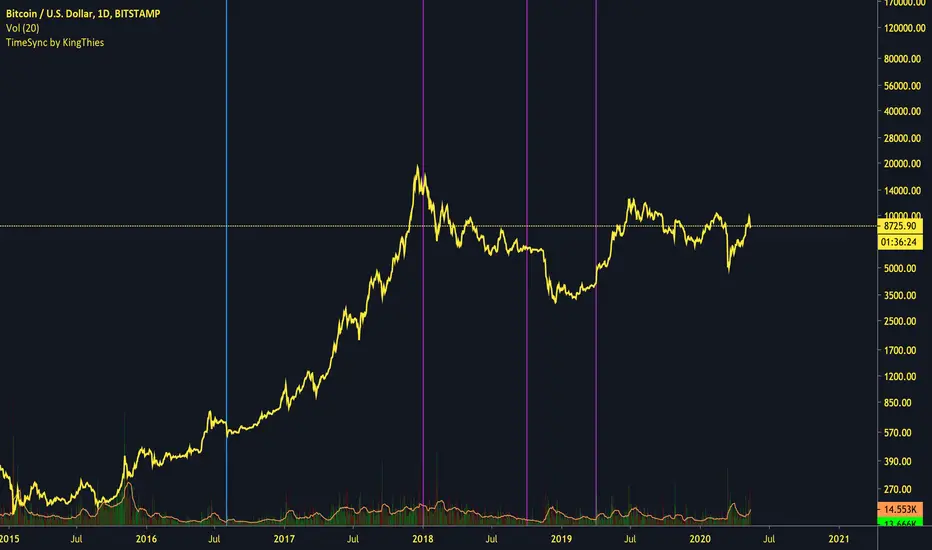
TimeSync by KingThies TimeSync by Kingthies
Written in Pine v4
Applies one function that was published in the Tradingview Pinescript Manual
The Motivation behind this script - Time is 50% of your chart. Many ignore it entirely. This should help give an idea on how to read it and incorporate it in their analysis.
TimeSync by KingThies takes a simple concept and turns it into a visual tracking system of when timeframes of significant impact, all close at the same time.
By utilizing several high time-frames, we see overlaps in periods and more significant events occurring when multiple periods close at once.
The TFs included are 3D,1W,2W and 1M. When users use the timeframes above intraday, the resolution for these HTF's is shown. When using the LTFs, anything lower than 1D/is intraday, the user sees a similar concept but comprised of the 4H, 6H,8H and 10H charts.
Users can adjust the settings to show the HTFs in sync AND also factor in if the event was on a business quarter or new year, which adds more significance to the occurrence.
By seeing when these periods end in sync, we can assume more volatility is present in a given market, presenting various opportunities for traders to take advantage of a given situation.
Apologies in advance for any questions that come up - I will do my best to reply or respond here on Tradingview.com.
Additional Resources for this topic can be found in my account signature, located at the bottom of this post.
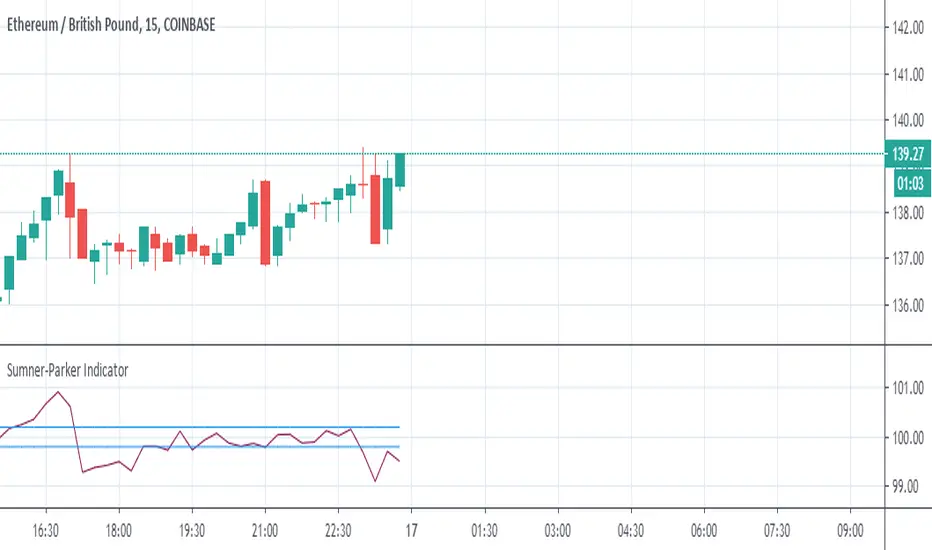
Sumner-Parker Indicator (Over/Under Priced BTC or ETH)This is to be used when trading between ETH/GBP, BTC/GBP and ETH/BTC .
It compares ETH/GBP and BTC/GBP with each other to determine if the ETH/BTC price matches.
From it you can predetermine whether the value of the asset you are watching is overpriced or underpriced and therefore predict the candle to follow.
When watching ETH:
If the value is high, the value of BTC is too high and ETH should raise to match in the next bar and vice versa.
When watching BTC:
If the value is high, the value of BTC is too high and should drop on the next bar and vice versa.
The Upper and Lowers are set at double the percentage fees on the exchange you use. This just helps in recognising beneficial trades.