Share USD group first to composite a 8 screens of strength.
share the USD group strength to compare the strength between pairs in USD group.
The 8 group could composite to a 8 screens of currency to look at whole situation.
If needed, the following currency is going on release.
Currency

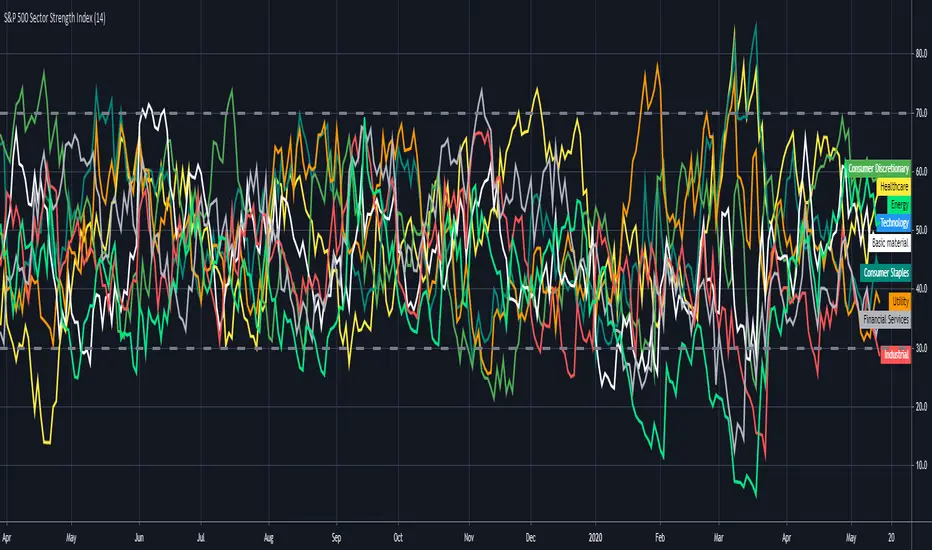
S&P 500 Sector Strength IndexHi traders , this is lonelygrass again 😄, and I am going to show what you don't often see out there and share it with you.
This indicator is called "s&p 500 sector strength index"😎 , which allows you to distinguish strengths and weaknesses between different sectors in s&p500, and to create meaningful trading frameworks around it.
Similar to the RSI indicator , it also has overbought and oversold levels , you can clearly figure out the degree of crowd behaviors in various sectors' stocks .
For me 🤣, I will use it to "BUY LOW⬇️ , SELL HIGH⬆️". When a sector is oversold at the moment, I will try to buy those stocks when I find price actions and chart patterns in comply with the analysis by this indicator , the opposite for shortselling.
Also, for sake of being more user-friendly 👍, I added a function which enables you to only select the sector(s) you want to look at in order to make it less messy.
If you can't help to know what I will share with you coming up, then FOLLOW my account 😙 . Also , your likes and shares are really important 🎊. I will get more motivated to bring you new thing every day!!! ✍
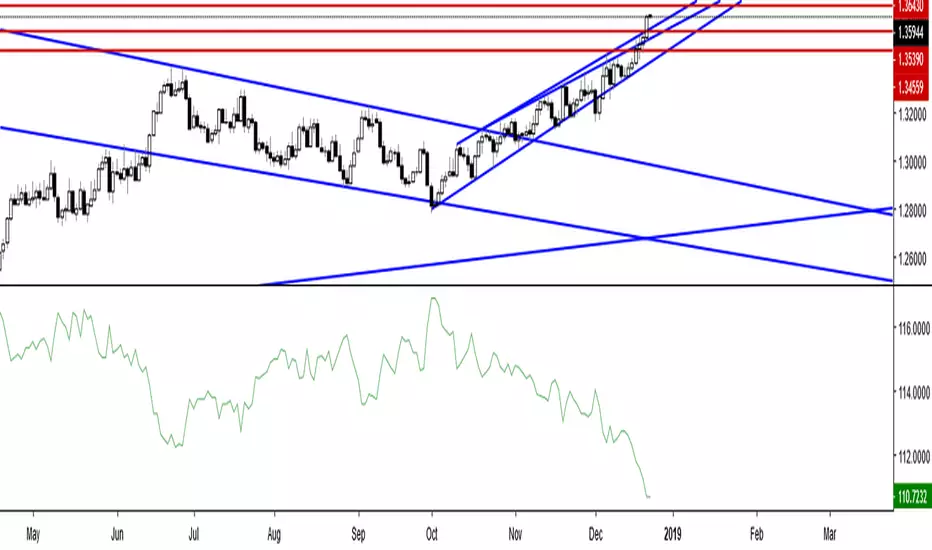
[HCSI] Hiubris Currency Strength IndicatorHow to Use
Depending on the timeframe that you trade, it’s highly recommendable that you constantly monitor the turns of the slopes, that’s the best way to spot the currency shift of flows.
- For instance, if you are trading off the hourly chart, look to enter at key decision points, aligning technicals to exploit the opportunities of the strongest currencies vs the weakest .
If we were to take the chart below as a reference, judging by the slopes of the Daily trends, one would think that looking for buy-side opportunities in the GBP and USD against the NZD and EUR would be the best combination of currencies to stay on the right side of the market flows.
- If you are an intraday trader using the 5m chart to trade, what you then want to do is to constantly monitor the granular trend in the currency index off the 5m timeframe to identify in almost real time the potential changes in currency flows. Prior to that, you should have defined what are the best currencies to pair with one another, as shown above.
* We recommend using a Lookback Length of 90 for higher timeframes (1H+) and 60 for intraday timeframes


TTPro CurrencyImpulse V12TTPro CurrencyImpulse V12 is a currency strength indicator with multiTimeFrame capabilities and variable periods (non repainting). Currently includes but not limited to AUD USD EUR CHF JPY NZD CAD GBP.

You Jun's Currency Strength Indicator 2Script for calculating the cumulative RSI for 8 popular forex currencies.

You Jun's Currency Strength IndicatorCompare the relative strength (RSI) of 8 popular forex currencies, GBP, JPY, EUR, USD, CHF, CAD, NZD, AUD.
Adjust the RSI period, default 7.
Red: GBP
Green: JPY
Blue: EUR
Black: USD
Orange: CAD
Yellow: CHF
Purple: NZD
Teal: AUD

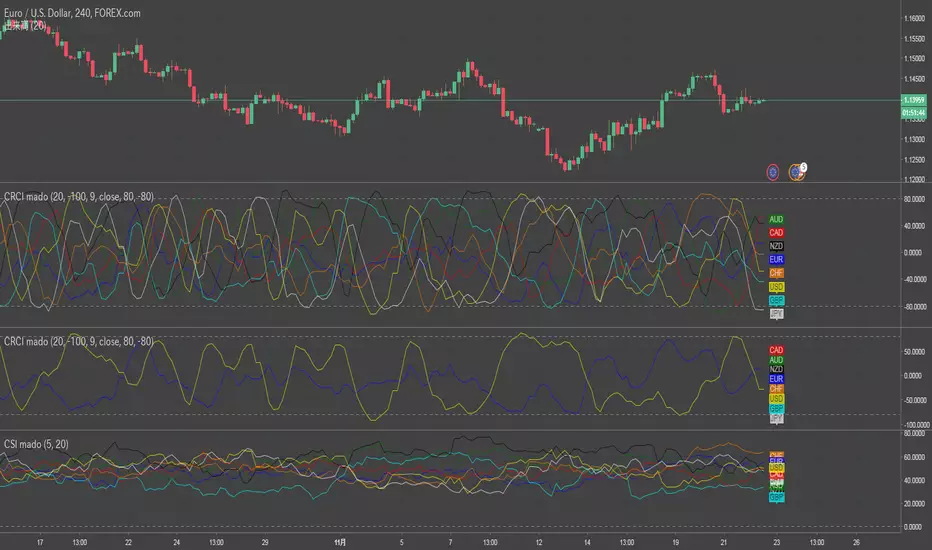
Forex Environment Recognition[mado]It's for Forex Environment Recognition.
six symbols strength indicator( like a CSI)
default setting for USDJPY
symbol1 : US02Y
symbol2 : US10Y
symbol3 : JP10Y
symbol4 : JPN225
symbol5 : DJI
symbol6 : GOLD
if you want to recognite another currency pair, you can change these symbols :)

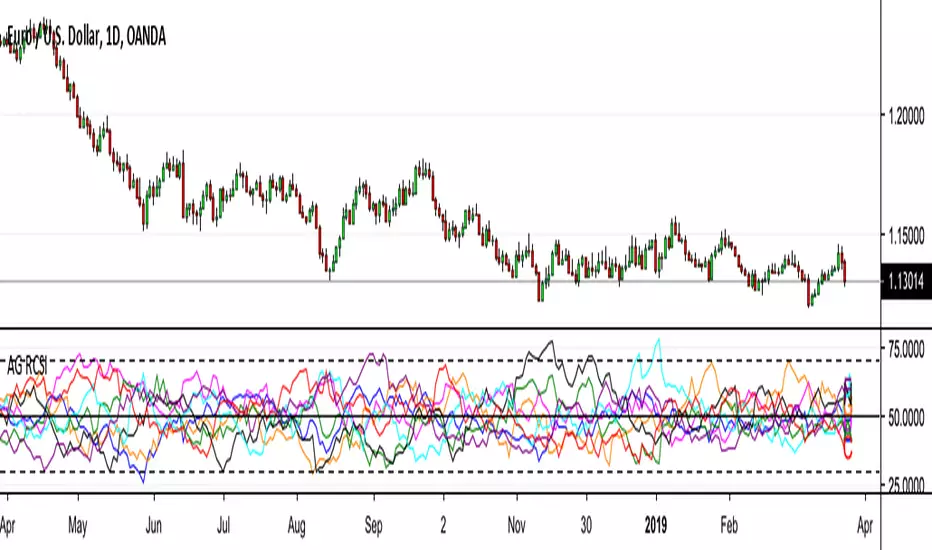
AG Relative Currency Strength IndicatorThis is an indicator that we've been using for a while to pinpoint currencies that are strong/weak. By knowing which currencies are strong and weak, you can focus your attention on the currency pairs that are actually moving, or plan ahead when researching trades.
This indicator gives the Relative Currency Strength, on any timeframe, for every major currency: USD, EUR, GBP, JPY, CHF, CAD, AUD, and NZD.
The indicator includes labels if you need them (you can toggle on/off - default=off), but you will quickly get used to which colour line represents which currency.
You can also choose to show/hide any currency, for isolation or clarity, e.g. only showing USD, EUR and JPY if that's all you're interested in.
Note: due to how much data is being pulled in and processed, this indicator does take a while to load.
TTPro CurrencyImpulse V11// TTPro CurrencyImpulse V11 is a powerful indicator that measures the strength or weakness of the seven major currencies.
// Trading opportunities can be spotted very quickly when the currency lines cross over.

Canadian Dollar Currency IndexCanadian Dollar Currency Index updates in real time and doesn't close like tradingview.com's currency indexes. Based off of the Bank of Canada's CEER methodology and tracks it quite closely, although not perfectly. It seems to be higher than the Bank of Canada's index by 2 points. This could be due to using different data for the currencies and as I am not proficient in PineScript, I don't think I was able to replicate the formula exactly...? Regardless ,it works well and is more than close enough to suit one's purpose of tracking the Canadian dollar against a basket of currencies that are weighted according to the Bank of Canada's total weights (The total weight of a country j in year t is a weighted average of the their import, export and third-market competition weights). For more information on the actual Bank of Canada's index: www.bankofcanada.ca

Quantum Currency Strength Indicator (CSI)If there is only one TradingView indicator you ever buy for trading forex – this has to be it.
Your success as a forex trader depends on being able to identify when a currency or currency pair is oversold or overbought. If it is strong or weak. It is this concept which lies at the heart of forex trading. Without the Quantum Currency Strength indicator, it’s almost impossible. There are simply too many currencies and too many pairs to do this quickly and easily yourself. You need help. The Quantum Currency Strenght indicator breaks this complex market down into the building blocks, the currencies themselves, from which you can then identify quickly, clearly and easily those pairs offering the best opportunities, which to ignore for the time being, and which to add to your watchlist. It’s your radar on the currency market.
The Quantum Currency Strength indicator has been designed with one simple objective in mind. To give you a bird’s eye view of the eight major currencies. To show you in a simple, quick and easy way, when a currency is either oversold or overbought, rising or falling strongly, or just going nowhere.
To help you, the indicator defines the overbought and oversold regions for you, with a simple horizontal line. One near the top at 80, and the other near the bottom at 20. When a currency reaches the upper grey line, it’s approaching an overbought state, and when a currency touches the lower grey line, conversely it’s approaching an oversold state.
It is at these points a trend is likely to reverse, offering you low-risk trading opportunities. Something you could never do quickly or easily yourself.
It displays the eight currencies individually, giving you endless combinations of trading opportunities from scalping to swing and trend trading in all the various currency pairs and in every timeframe.
US dollar – red
Euro – orange
British pound – yellow
Swiss franc – green
Japanese yen – magenta
Canadian dollar – purple
Australian dollar – blue
New Zealand dollar – white
Whilst this concept is simple, its use is sophisticated, and one which you can apply in a variety of ways. In fact four very different, but equally powerful ways, all of which will help you make money, confidently and without emotion:
First – the indicator tells you when an individual currency is overbought or oversold. Strong or weak. Unlike some assets, currencies never go to zero. It is when they reach these extreme points, that currencies offer the lowest risk trading opportunities. These are the regions at which a currency is likely to reverse from a previous trend, giving you the potential to get into a low-risk trading position early.
Second – the indicator will also tell you when it’s time to exit. After all, if it’s good enough to get you in, it’s good enough to get you out as well.
Third – when the currencies are all bunched together in the middle of the indicator – guess what. It’s time to sit on the sidelines and wait.
Finally, take your trading to another level using multiple timeframes. After all, if a currency is moving higher, or lower, across three timeframes, then even more reason to take a low-risk trade, so using the indicator in multiple timeframes is key.
And if this wasn’t enough. There is even more!
You can configure the indicator to your own personal trading style. Think of it like the volume control on your radio. You adjust it to your own personal preference. Well it’s the same here. If you are a scalping trader, simply adjust one of the indicator settings to speed up the indicator. If you are a swing or trend trader, tweak the controls to slow it down a little – the choice is yours. More control means one thing – more consistency and greater profits.
After all, why buy an indicator that you cannot match to your trading style? It would be like buying a radio with no volume control.
That’s why we call them the next generation of trading indicators for TradingView.
The Quantum Currency Strength indicator works in all timeframes from seconds and ticks to minutes and months, and the colour of each currency line on the indicator can be changed to your own personal preferences.

Currency Rank Correlation Index -CRCICurrency Rank Correlation Index based below multi pair RCI average.
compare usd/eur/gbp/aud/jpy/cad/chf/nzd.
Use like Currency Strength Indicator -CSI :)
config label position only.(default 20/-100)
Forex Correlations HeatmapHello friends,
This tool is built for forex traders who want a clean, visual way to understand how currency pairs move together. It builds a color-coded correlation matrix between your current chart symbol and a customizable list of forex pairs, helping you quickly spot strong positive or negative relationships across majors, crosses, and extended FX watchlists.
🛠️ How It Works
You provide a comma-separated watchlist of forex tickers (e.g., EURUSD,USDJPY,GBPUSD,...). The script then:
Filters this list based on your selected Display Mode (All pairs, or only AUD, CAD, CHF, EUR, GBP, JPY, NZD, or USD-related pairs).
Paginates long watchlists into pages of up to 40 tickers , so you can scroll through large FX universes without overloading the chart.
For each pair on the current page, it calculates the Pearson correlation over a user-defined lookback window, using your chosen price source (close, HL2, HLC3, etc. via the custom source selector).
The resulting correlations are plotted as a heatmap: each cell's color and intensity reflect the strength and direction of the relationship.
You can switch between multiple professional color palettes to better match your visual preferences and quickly distinguish strong positive, strong negative, and neutral correlations.
🔥 Key Features
Custom watchlist input via a simple text area (paste or type your pairs)
Pagination support - view up to 40 symbols per page for smoother performance
Flexible Display Modes : All pairs, or focused views like AUD pairs, EUR pairs, USD pairs, etc.
Configurable correlation lookback period
Customizable correlation source via an advanced source selector module
Multiple professional color palettes : Blue/Red, Blue/White/Red, Green/Pink, Green/Red, Green/Yellow/Red, Purple/Orange, Spectral, Viridis
Clear visual mapping of correlation strength and sign through color intensity
👋 Good luck and happy trading!
Script a pagamento

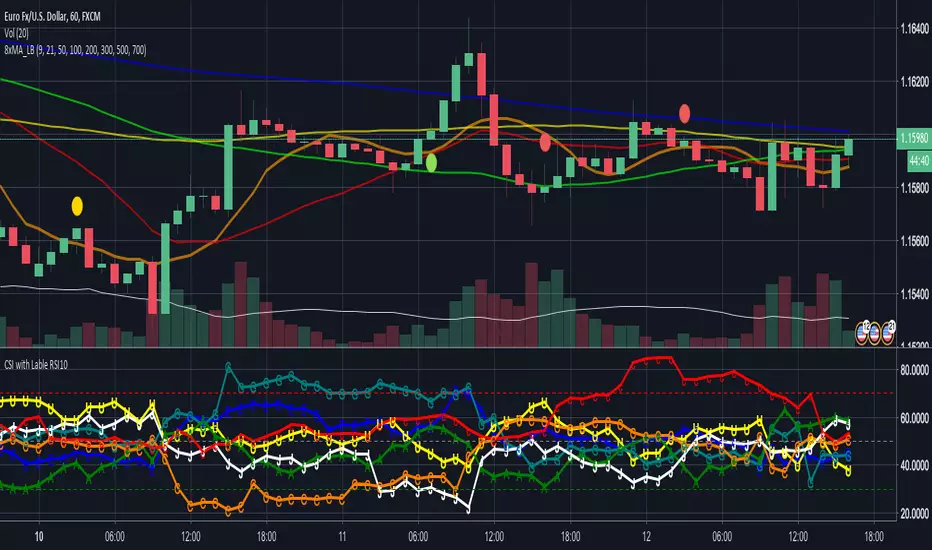
CSI - Currency strength indicator RSI 10This Indicator shows you the strength of the Currency in comparison for all other Main Currencys at the timeframe you choose.
The Currencys in this Indicator is: EUR, USD, GBP, CHF, AUD, CAD, JPY
The Base is the RSI (relative strength Indicator) with the following Currency pairs:
eurusd, eurgbp, euraud, eurjpy, eurcad, eurchf
usdeur, usdgbp, usdaud, usdjpy, usdcad, usdchf
gbpeur, gbpusd, gbpaud, gbpjpy, gbpcad, gbpchf
audeur, audusd, audgbp, audjpy, audcad, audchf
jpyeur, jpyusd, jpyaud, jpygbp, jpycad, jpychf
cadeur, cadusd, cadaud, cadgbp, cadjpy, cadchf
chfeur, chfusd, chfaud, chfgbp, chfjpy, chfcad
The letters in the LineChart:
EUR = E
USD = U
GBP = G
CHF = C
AUD = A
CAD = C
JPY = J
The CSI can help to see, if your trading pair have the potential to breakout on the support and resistance or if it more likely go back.
Some people say that the banks use this indicator.
NZD is missing there because Tradingview only support 6 variables.
If you have a solution for than, please let me know.
Thanks

WeTrade. Trend Alerts 2.0
Данные сигналы были созданы для понимания начала и разворота тренда. Не забывайте правило: The trend is your friend. Стрелки НЕ ПЕРЕРИСОВЫВАЮТСЯ. Как и большинство индикаторов, данный нуждается в поддержке тех. анализом и строгом алгоритме торговле. Используется для маржинальной торговли на криптовалютных парах BTC/USD, ETH/BTC 5.24% , ADA/BTC, BCH/BTC, LTC/BTC, а так же на валютных парах EUR/USD, GBP/USD. НЕ (!) используйте индикатор на инструментах, в которых идёт жёсткий флэт и сильные pump and dump. Такие монеты были созданы не для движения по тренду! А для использования робота и накачки!
Торговля по системе идёт со строгим управлением капиталом.
Советую использовать стратегию Мартингейла. Увеличивать позиции не более чем на 40%. С кредитным плечом до X10. Контролируйте свои риски. В этом главный успех.
Всем большого дохода!
------------------------------------------------------------------------------------------------------------------------------------
This alerts is created to understand the beginning and the reversal of the trend. Do not forget the rule: The trend is your friend. The arrows do not re-painting! Like most indicators, this one needs the support of technical analysis and strict algorithm of trade. Used for margin trading on BTC 0.97% / USD, ETH / BTC 0.97% , ADA / BTC 0.97% , BCH / BTC 0.97% , LTC / BTC 0.97% , and also in currency pairs like EUR/USD -0.05% , GBP/USD 0.10% . DO NOT (!) Use the indicator on tools, in which there is a rigid flat and strong pump and dump. Such coins were not created for movement on the trend! They are created for using a robot and pumping!
Trade in the system goes with strict management of capital.
Write comments, I will answer your questions.
Thank you.

MOMENTUM + strong vs weak momentumThis is a unique custom indicator that shows the real momentum of a currency
With this indicator you can easily trade the strong vs the weak momentum
Each line is a currency pair
aqua= eur
yellow=dollar
purple= pound
green=australian dollar
white=yen
orange=canadian dollar
if the square has one of these colors it means moment UP for this currency
If the square is red it means momentum down for the related currency
The trading signal is at the change of color from previous square against one other currency with opposite color
You can access this indicator for a trial period, just ask for access in comments
Trading is a risky business, i'm not responsible for any profit or loss
Currency StrengthRepublished: The original script violated house rules by including an external link to Backtest Rookies.
Background
The currency strength indicator takes up to 4 forex pairs and calculates the average strength across all pairs. The indicator uses the pair's daily percentage change to calculate the overall strength. For flexibility, it can accept any instrument as an input. This means you can use multiple instances to track various currency strengths. It was designed with the major pairs in mind but there is no reason why it cannot be used for other FX pairs.
Note: The indicator defaults to GBP. When setting it up for other currencies, be sure to flag whether the currency is a counter currency or not.
The code is provided free and open source. Please modify it as you see fit.
Screenshots
Defaults with Annotation
Yen strength beating pound strength
Opposing Trends

Ichimoku Cloud Score v1.0This script calculates a simple Ichimoku Score based on the signals documented here , with a few additions. Each of the score components can be individually weighted via the script inputs . The output is a plot of the normalized Ichimoku score, in the range of -100 to 100.
This script has been heavily modified from 'Ichimoku Cloud Signal Score v2.0.0 '. Credit to user 'dashed' for the initial implementation.
This has been modified with several refinements:
Clean/Organized Code
Simplified Inputs
Improved Style
Scores normalized to a range (-100, 100)
Bugfixes and Improvements
Script Inputs: i.imgur.com

Convert Yuan value symbols to USDIGNORE PREVIOUS SCRIPT/POST (titled: "yuan normiz")
If you like to look add symbols that are valued in China's Yuan and want to convert them to USD accurately then this is the perfect script for you.
"I'm not sure if this script is for me. Does my setup apply here?"
If either of these resemble your chart setup then this is for you:
Example 1: You have COINBASE:BTCUSD on your main chart often add to compare Bitstamp:btcusd and Okcoin:btccny.
Example 2: You have SPY or SPX (or DJIA etc) as your main chart but like to add other composites to compare like SSE(Shanghai Stock Exchange index) to your main chart.
This takes the symbol of your choice (default is BTCCHINA:BTCCNY) that is expressed in Yuan and divides it by the corresponding value of IDC's USDCNH ticker. Not the last value of USDCNH, but the respective tick mark----BTCCNY's close 3 months ago is divided by USDCNH's close 3 months ago.
