[blackcat] L2 Ehlers Phase Accumulator Cycle Period MeasurerLevel: 2
Background
John F. Ehlers introuced Phase Accumulation technique of cycle period measurement in his "Rocket Science for Traders" chapter 7. It is perhaps the easiest to comprehend. In this technique, John Ehlers measures the phase at each sample by taking the arctangent of the ratio of the Quadrature component to the In-phase component. A delta phase is generated by taking the difference of the phase between successive samples. At each sample Dr. Ehlers then looks backward, adding up the delta phases. When the sum of the delta phases reaches 360 degrees (2*pi in tradingview), we must have passed through one full cycle, on average. The process is repeated for each new sample.
Function
blackcat L2 Ehlers Phase Accumulator Cycle Period Measurer is used to measure Dominant Cycle (DC). This is one of John Ehlers three major methods to measure DC. The Phase Accumulation method of cycle measurement always uses one full cycle’s worth of historical data. This is both an advantage and disadvantage. The advantage is the lag in obtaining the answer scales directly with the cycle period. That is, the measurement of a short cycle period has less lag than the measurement of a longer cycle period. However, the number of samples used in making the measurement means the averaging period is variable with cycle period. Longer averaging reduces the noise level compared to the signal. Therefore, shorter cycle periods necessarily have a higher output Signal-to-Noise Ratio (SNR).
Key Signal
Smooth --> 4 bar WMA w/ 1 bar lag
Detrender --> The amplitude response of a minimum-length HT can be improved by adjusting the filter coefficients by
trial and error. HT does not allow DC component at zero frequency for transformation. So, Detrender is used to remove DC component/ trend component.
Q1 --> Quadrature phase signal
I1 --> In-phase signal
Period --> Dominant Cycle in bars
Pros and Cons
100% John F. Ehlers definition translation of original work, even variable names are the same. This help readers who would like to use pine to read his book. If you had read his works, then you will be quite familiar with my code style.
Remarks
The 2nd script for Blackcat1402 John F. Ehlers Week publication.
Readme
In real life, I am a prolific inventor. I have successfully applied for more than 60 international and regional patents in the past 12 years. But in the past two years or so, I have tried to transfer my creativity to the development of trading strategies. Tradingview is the ideal platform for me. I am selecting and contributing some of the hundreds of scripts to publish in Tradingview community. Welcome everyone to interact with me to discuss these interesting pine scripts.
The scripts posted are categorized into 5 levels according to my efforts or manhours put into these works.
Level 1 : interesting script snippets or distinctive improvement from classic indicators or strategy. Level 1 scripts can usually appear in more complex indicators as a function module or element.
Level 2 : composite indicator/strategy. By selecting or combining several independent or dependent functions or sub indicators in proper way, the composite script exhibits a resonance phenomenon which can filter out noise or fake trading signal to enhance trading confidence level.
Level 3 : comprehensive indicator/strategy. They are simple trading systems based on my strategies. They are commonly containing several or all of entry signal, close signal, stop loss, take profit, re-entry, risk management, and position sizing techniques. Even some interesting fundamental and mass psychological aspects are incorporated.
Level 4 : script snippets or functions that do not disclose source code. Interesting element that can reveal market laws and work as raw material for indicators and strategies. If you find Level 1~2 scripts are helpful, Level 4 is a private version that took me far more efforts to develop.
Level 5 : indicator/strategy that do not disclose source code. private version of Level 3 script with my accumulated script processing skills or a large number of custom functions. I had a private function library built in past two years. Level 5 scripts use many of them to achieve private trading strategy.
Cycle

Shenlong V2.3 - Trend cycleShenlong V2 is a script developed to facilitate the interpretation of long and short entries according to various conditionals that play with the trend.
The use of trend clouds has been implemented, which can be used as dynamic support / resistance . They also allow us to identify the current price cycle according to these guidelines, marking with a LONG or SHORT depending on the cycle in question. The appearance settings are user configurable. You can set alerts (long o short) to be aware of movements.
The use of recommended stop loss has been implemented, this can be used as a trailing stop to ensure profits or give the possibility of catching the trend, since it will move as the price forms its structure.
An information panel on stop prices has been implemented for ease of use.

Strategy - Uber STC - Schaff Trend Cycle [UTS]Backtesting of Uber STC - Schaff Trend Cycle
Backtest with focus win/loss profitability.
Formula: profitability = win / (win+loss)
Default equity 100k USD
Default 2% Risk per trade
Default currency USD
Define backtest interval precisely by month, year, day
LONG and SHORT positions
Visualize SL and TP on chart
ATR (len: 14, smooth: SMA)
ATR based Stop-Loss, if hit trade will be closed and considered as loss
ATR based Take-Profit, if hit trade will be closed and considered as win
On TP or SL hit the trade is closed and marked as win/loss
Uber STC - Schaff Trend Cycle [UTS]Desc:
The Schaff Trend Cycle (STC) is a charting indicator that is commonly used to identify market trends and provide
buy and sell signals to traders.
Developed in 1999 by noted currency trader Doug Schaff, STC is a type of oscillator and is based on the assumption that,
regardless of time frame, currency trends accelerate and decelerate in cyclical patterns.
This indicators source code is based on Releasing the Code to the Schaff Trend Cycle.pdf
Executive Summary
Schaff Trend Cycle is a charting indicator used to help spot buy and sell points in the markets.
Compared to the popular MACD indicator, STC will react faster to changing market conditions.
A drawback to STC is that it can stay in overbought or oversold territory for long stretches of time.
General Usage
There are two lines indicating overbought and oversold conditions, default at 75 and 25 which is customizable of course.
Signals are created on line crosses. They that can be used to enter LONG/SHORT or EXIT a trade.
If the STC crosses the lower line upwards a LONG signal is triggered and if it crosses the upper line a SHORT signal is triggered.
Line crosses in the other direction than the current trade also work as EXIT signal.
Alerts
Traders can easily use the reversal signal to trigger alerts from:
Cross Up
Cross Down
Those values are > zero if a condition is triggered.
Alert condition example: "Cross Up" - "Greater Than" - "0"
Moving Averages
16 different Moving Averages are available:
ALMA (Arnaud Legoux Moving Average)
DEMA (Double Exponential Moving Average)
EMA (Exponential Moving Average)
FRAMA (Fractal Adaptive Moving Average)
HMA (Hull Moving Average)
JURIK (Jurik Moving Average)
KAMA (Kaufman Adaptive Moving Average)
Kijun (Kijun-sen / Tenkan-sen of Ichimoku)
LSMA (Least Square Moving Average)
RMA (Running Moving Average)
SMA (Simple Moving Average)
SuperSmoothed (Super Smoothed Moving Average)
TEMA (Triple Exponential Moving Average)
VWMA (Volume Weighted Moving Average)
WMA (Weighted Moving Average)
ZLEMA (Zero Lag Moving Average)
A freely determinable length allows for sensitivity adjustments that fits your own requirements.
Ehlers Cyber Cycle [CC]The Cyber Cycle was created by John Ehlers (Cybernetic Analysis For Stocks And Futures pg 34) and this is one of my favorite Ehlers indicators. I use it personally for exits but it has several uses. It gives great entry and exit signals when you enter when it is at the bottom or at the very top during a cycle. When it is above 0 then the stock is in a strong uptrend and when it is below 0 then the stock is in a strong downtrend. It is also very reactive as well with zero lag according to Ehlers. Buy when the indicator line is green and sell when it is red.
Let me know if there are other scripts you would like to see me publish or if you want something custom done!

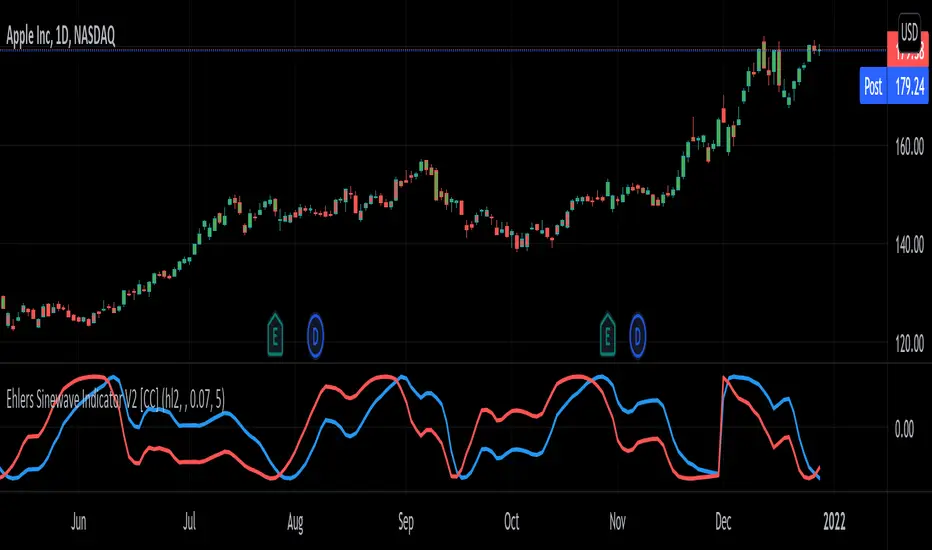
Ehlers Sinewave Indicator V2 [CC]The Sinewave Indicator was created by John Ehlers (Cybernetic Analysis For Stocks And Futures pgs 154-155) and this is an updated version of his original Sinewave Indicator which in my opinion seems to be more reactive to changes. Buy when the blue line crosses over the red line and sell when the blue line crosses under the red line. Also keep in mind that this indicator is based on cycles so it won't act the same as a typical indicator.
Let me know if there are other scripts you would like to see me publish or if you want something custom done!
Mercury Retrograde Cycles V2 [Moon]Plots Mercury Retrograde cycles from start to end.
What is Mercury Retrograde?
Mercury Retrograde is when the planet Mercury appears to be traveling in reverse or backwards across the night sky with respect to the stars, the zodiac, and other bodies in the celestial canopy.
It happens when Mercury goes in between the Earth and the Sun. Basically, Mercury is lapping or passing Earth during this period.
An illusion created by the way that Earth and Mercury orbit around the sun. In reality, this is both planets perpetually orbiting in the same uniform direction.
In ancient Roman mythology Mercury is supposed to rule all types of communication including - buying, selling, speaking, reading or contractual agreements.
Does this work or mean anything
I don't hold the answers to the universe you'll have to go looking for yourself.
Works best right now on the Daily (D) timeframe.
Send me a DM if interested.

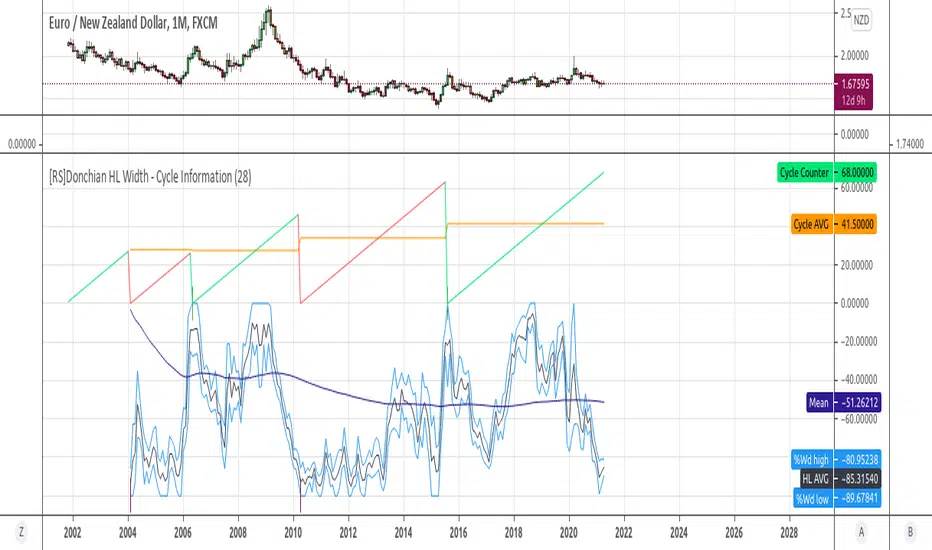
[RS]Donchian HL Width - Cycle InformationExperimental:
some information on cyclical new peaks using Donchian Channel % Widths.
Price Distance to its MA by DGTPrices high above the moving average (MA) or low below it are likely to be remedied in the future by a reverse price movement as stated in an Article by Denis Alajbeg, Zoran Bubas and Dina Vasic published in International Journal of Economics, Commerce and Management
Here comes a study to indicate the idea of this article, Price Distance to its Moving Averages (P/MA Ratio)
The analysis expressed in the paper indicates that there is a connection between the distance of the prices to moving averages and subsequent returns : portfolios of stocks with lower prices to moving averages generally outperformed portfolios of stocks with higher prices to moving averages. This “overextended” effect is more pronounced when using shorter moving averages of 20 and 50 days, and is especially strong in short-term holding periods like one and two weeks. The highest annual returns are recorded when buying in the range of 0-5% below shorter moving averages of 20/50 days, and 0-10% below longer moving averages of 100/200 days. However, buying very far below almost all moving averages on almost all holding periods produces the lowest returns.
The concept of this study recognizes three different modes of action.
In a clearly established upward trend traders should be buying when prices are near or below the MA line and selling when prices move too far above the MA.
Conversely, in downward trend stocks should be shorted when reaching or going above the moving average and covered when they drop too far below the MA line.
In a sideways movement traders are advised to buy if the price is too low below the moving average and sell when it goes too far above it
Short-term traders can expect to outperform in a one or two week time window if buying stocks with lower prices compared to their 20 and 50 SMA/EMA, one to two-week holding periods is quite high, ranging from 72,09% to 90,61% for the SMA(20, 50) and 85,03% to 87,5% for the EMA(20, 50). The best results for the SMA 20 and 50, on average, are concentrated in the region of 0-5% below the MA for the majority of holding periods. Buying very far below almost all MA in almost all holding periods turns out to be the worst possible option
Candle patterns, momentum could be used in conjunction with this indicator for better results. Try Colored DMI and Ichimoku colored SuperTrend by DGT

[RS]Cyclic Interval Average PriceEXPERIMENTAL:
Cyclic interval price averaging at every x bars.
Lines for trend line and intra trend slope(not working as intended).

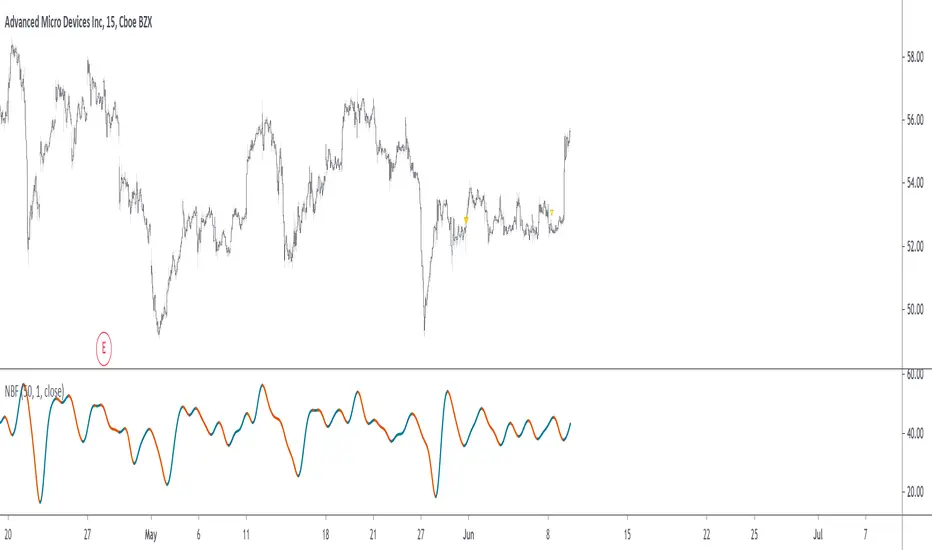
Narrow Bandpass FilterIn technical analysis most bandpass filters like the MACD, TRIX, AO, or COG will have a non-symmetrical frequency response, in fact, this one is generally right-skewed. As such these oscillators will not fully remove lower and higher frequency components from the input signal, the following indicator is a bandpass filter with a more symmetrical frequency response with the possibility to have a narrow bandwidth, this allows the indicator to potentially isolate sinusoids from the input signal.
Indicator & Settings
The filter is calculated via convolution, if we take into account that the frequency response of a filter is the Fourier transform of its weighting function we can deduce that we can get a narrow response by using a sinusoid sin(2𝛑nf) as the weighting function, with the peak of the frequency response being equal to f , this makes the filter quite easy to control by the user, as this one can choose the frequency to be isolated. The length of the weighting function controls the bandwidth of the frequency response, with a higher length returning an ever-smaller frequency response width.
In the indicator settings the "Cycle Period" determine the period of the sinusoid used as a weighting function, while "Bandwidth" determine the filter passband width, with higher values returning a narrower passband, this setting also determine the length of the convolution, because the sum of the weights must add to 0 we know that the length of the convolution must be a multiple of "Cycle Period", so the length of the convolution is equal to "Cycle Period × Bandwidth".
Finally, the windowing option determines if a window is applied to the weighting function, a weighting function allow to remove ripples in the filter frequency response
Above both indicators have a Cycle period of 100 and a Bandwidth of 4, we can see that the indicator with no windowing don't fully remove the trend component in the price, this is due to the presence of ripples allowing lower frequency components to pass, this is not the case for the windowed version.
In theory, an ultra-narrow passband would allow to fully isolate pure sinusoids, below the cycle period of interest is 20
using a bandwidth equal to 10 allow to retain that sinusoid, however, note that this sinusoid is subject to phase shift and that it might not be a dominant frequency in the price.
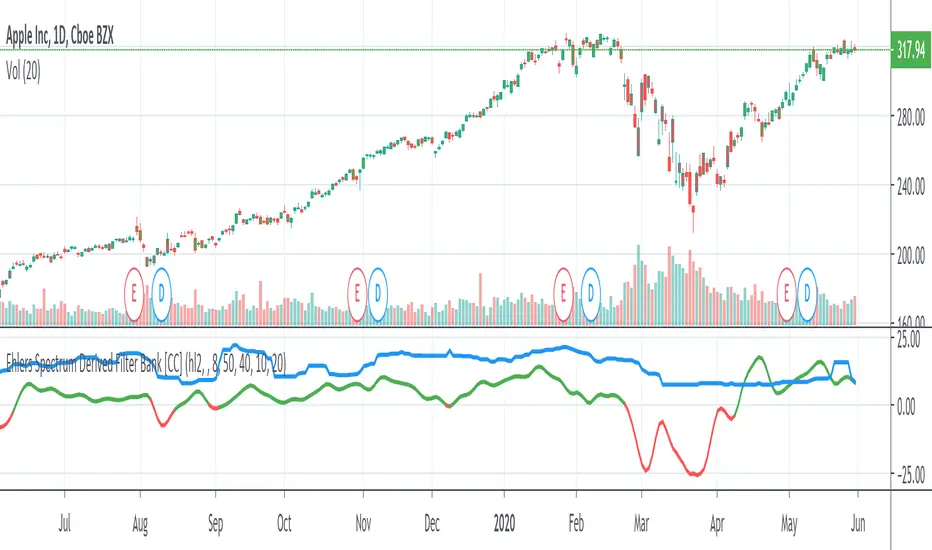
Ehlers Spectrum Derived Filter Bank [CC]The Spectrum Derived Filter Bank was created by John Ehlers (Stocks & Commodities V. 26:3 (16-22)) and this is technically two indicators in one. This will let you know the current cycle period which is in blue and the other indicator will let you know if you should buy the stock or not. Buy when it is green and sell when it is red.
Let me know if you would like me to publish other scripts or if you want something custom done!
Note: I'm republishing this because the original script couldn't be found in searches so this will fix that.
Ehlers Dominant Cycle Tuned Bypass Filter [CC]The Dominant Cycle Tuned Bypass Filter was created by John Ehlers (Stocks & Commodities V. 26:3 (16-22)) and this is a particularly unique indicator because this does a pretty good job at predicting the future stock movements. If the blue line crosses over the red then a few bars from now the stock price will most likely go up and if the blue line crosses below the red then a few bars from now the stock price should go down. Since this is such a unique indicator to use with entry and exit points, I don't have them color coded but try this out and let me know what you think.
This was a special request so let me know what other scripts you would like to see me publish or if you want anything custom done!
Note: I'm republishing this because the original script couldn't be found in searches so this will fix that.

Week Start - Highlights the first candle of the weekSome users asked in PM about a script that highlights the start of the week. Consequently, I decided to publish it open for anyone finding it useful.
Furthermore, I will update the script soon with more useful features and customisation options.

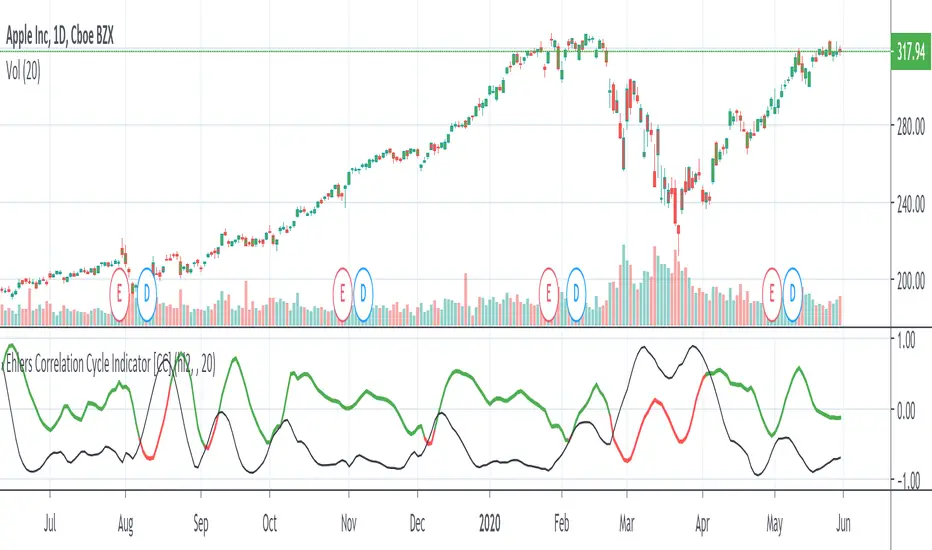
Ehlers Correlation Cycle IndicatorThe Correlation Cycle Indicator was created by John Ehlers (Stocks & Commodities V. 38:06 (8–15)) and this is technically part of three indicators in one so I'm splitting each one to a separate script. This particular indicator was designed for trend direction and trend strength and simply buy when it is green and sell when it turns red. Also keep in mind that the higher the indicator is above the signal then the stronger the trend and when they are close together, conditions get choppy.
Let me know if you would like to see me publish other scripts or if you want something custom done!
Correlation Cycle, CorrelationAngle, Market State - John EhlersHot off the press, I present this "Correlation Cycle, CorrelationAngle, and Market State" multicator employing PSv4.0, originally formulated by Dr. John Ehlers for TASC - June 2020 Traders Tips. Basically it's an all-in-one combination of three Ehlers' indicators. This power packed triplet indicator, being less than a 100 line implementation at initial release, is a heavily modified version of the original indicator using novel techniques that surpass John Ehlers' original intended design.
This is also a profound script in numerous ways. First of all, these three indicators are directly from the illustrious mastermind himself Dr. John Ehlers. Secondarily, this is my "50th" script published on TV, which makes it even more significant. I'm especially proud of this script to "degrees" of imagination I once didn't know was theoretically possible in code. My intellect has once again been mathemagically unlocked pondering new innovations with this code revelation. Thirdly, this PSv4.0 script shows the empowering beauty and elegance of hacking the stock markets with TV's ultra utilitarian Pine Editor(PE) in a common browser! Some of you may be wondering if I worked on this for days... nope! This only took a few hours, followed by writing this description for another hour plus.
I have created many of Ehlers' indicators in PE, a few of which I have published in my profile, but I wanted to show how programming with Pine Script can be an artistic form of craftsmanship and poetry. None of this would be possible without the ingeniously minded Tradingview staff revolutionizing algorithmic trading at it's finest. If you should ever encounter them by chance, ponder humbly thanking these computing wizards for their diligence and dedication. They are providing, and shall award to us members, some of the most fascinating conceptualized tech imaginable in the coming future. I can assure you, much, much more is yet to be unveiled for us TV members/enthusiasts. Thank you TV and all you offer to this community.
As always, I have included advanced Pine programming techniques that conform to proper "Pine Etiquette" by example. There are so many Pine mastery techniques included, I don't have an abundance of time to elaborate on all of them. For those of you are code savvy, you may have notice I only used one "for" loop for increased server efficiency, instead of the two "for" loops in the original formulation. For those of you who are newcomers to Pine Script, this code release may also help you comprehend the immense "Power of Pine" by employing advanced programming techniques while exhibiting code utilization in a most effective manner. This is commonly what my dense intricate code looks like behind the veil. If you are wondering why there is hardly any notes, that's because the notation is primarily in the variable naming.
Features List Includes:
Dark Background - Easily disabled in indicator Settings->Style for "Light" charts or with Pine commenting
AND a few more... Why list them, when you have the source code!
The comments section below is solely just for commenting and other remarks, ideas, compliments, etc... regarding only this indicator, not others. When available time provides itself, I will consider your inquiries, thoughts, and concepts presented below in the comments section, should you have any questions or comments regarding this indicator. When my indicators achieve more prevalent use by TV members, I may implement more ideas when they present themselves as worthy additions. As always, "Like" it if you simply just like it with a proper thumbs up, and also return to my scripts list occasionally for additional postings. Have a profitable future everyone!

Bitcoin: Top & Bottom Mini-AlgoHere we have a mini-algorithm that tries to show absolute 4-year-cycle top and bottom zones for the case of the BraveNewCoin Liquid Index (BLX) for Bitcoin on the weekly (W) timeframe by using several oscillators as RSI, VPCI etc. employed with a custom logic. When the background gets red we might be near to a cycle peak, and when it gets green we might be near to the absolute bottom of the current cycle. Note that only absolute top/bottoms are indicated (at least since the end of 2013), so that the current strong drop in March 2020 was correctly not tagged, as it wasn't the lowest price of the current cycle.
It is best to combine this mini-algorithm with some of my boundary indicators for BLX, e.g. "Bitcoin: Price Action Integrals", for confluence . For the next peak one could then watch for the mini-algo to go red and for the price to hit the boundary. You can change the background transparency if you like to have this indicator be more unobstrusive on the chart.
For access please contact me via DM on TradingView or on Twitter (linked on my TradingView profile and my signature).

Extended Golden Ratio Fibonacci Multiplier + Pi Cycle TopHere I present the Golden Ratio Multiplier and Pi Cycle Top Indicator originally conceptualized by Philip Swift, and extend it. Due to popular demand for a nicer looking color scheme and added MAs & functionalities, I decided to publish this indicator, of course with free access for everyone as the discovery is attributed to Philip. The indicator works best for BLX (BraveNewCoin Liquid Index for Bitcoin) on daily (D) or weekly (W) timeframe. Other timeframes are not supported (and also generally not needed as this is a rather high timeframe indicator).
Added functionality:
- Additional Fibonacci MAs for Bottom: 0.618*MA(50W) and 0.382*MA(50W), which seem to be distinct high timeframe support MAs
- Pi Cycle Top and all Fibonacci MAs can be plotted or hidden individually
- Correct MA values for daily (D) and weekly (W) timeframes are automatically assigned, so you do not need to change anything when you switch between those timeframes.
It is generally said that Bitcoin's peaks always only reach a lower yearly Fibonacci MA. The next one to eye would be the 3*MA(50W) = 3*MA(350D) here plotted in dark green. Historically when the MA(16W) = MA(111D) (here plotted in magenta) line crossed the 2*MA(50W) = 2*(350D) line (plotted in cyan) from below a cycle peak is reached. This indicator might therefore be a good high timeframe indicator for Bitcoin trading. Of course this is no financial advice.
Bitcoin: Price Action Integral BandsThis indicator tries to display absolute tops and bottoms for Bitcoin. The price action gets integrated with two custom functions resulting in the blue top and red bottom price action integrals. From those integral values we allow 5% deviation in up and down direction, leading to price action integral bands of some non-zero width.
Even in the current liquidity crisis with abnormal price movements, Bitcoin had no weekly candle close below the support band. One thing to note is that in the here presented model, up until now only one single weekly candle touches the blue band in each of Bitcoin's cycles. For longer-term trades it might be a good idea to buy BTC when price is around the red band, and sell/go short when BTC is around the blue band, although this is no financial advice and one should always cross-check with other indicators/informations.
There's the option to plot or hide the bands individually.
The integral bands are specifically designed for the Bitcoin BLX (BraveNewCoin Liquid Index) ticker on weekly timeframe. For other assets, tickers and timeframes the functionality of this indicator cannot be guaranteed and will most probably not deliver meaningful results.

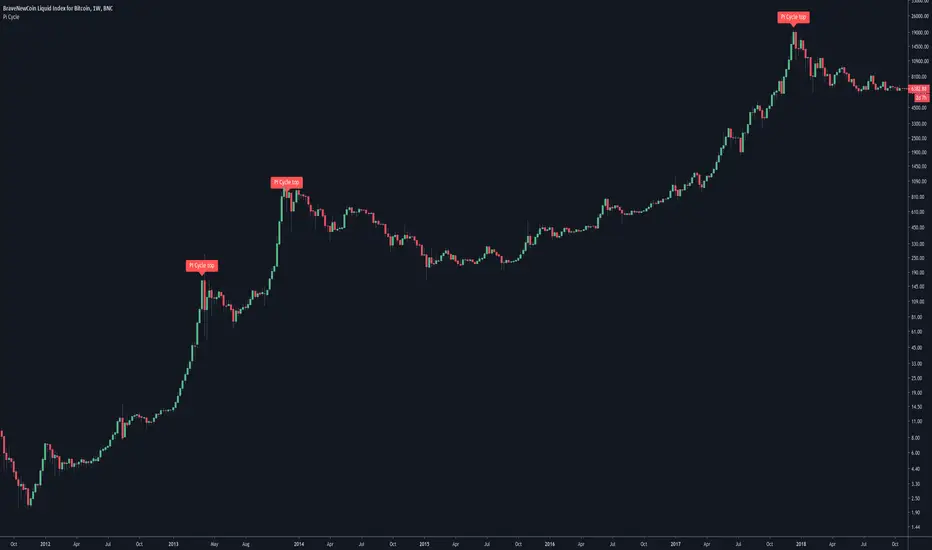
Pi Cycle Bitcoin top indicatorThe Pi Cycle Top Indicator has historically been effective in picking out the timing of market cycle highs to within 3 days.
It uses the 111 day moving average (111DMA) and a newly created multiple of the 350 day moving average, the 350DMA x 2.
Note: The multiple is of the price values of the 350DMA not the number of days.
For the past three market cycles, when the 111DMA moves up and crosses the 350DMA x 2 we see that it coincides with the price of Bitcoin peaking.
It is also interesting to note that 350 / 111 is 3.153, which is very close to Pi = 3.142. In fact, it is the closest we can get to Pi when dividing 350 by another whole number.
It once again demonstrates the cyclical nature of Bitcoin price action over long time frames. Though in this instance it does so with a high degree of accuracy over the past 7 years.
Full Credit to PositiveCrypto
Moon phases 2020 for JapanMoon phases 2020 for Japan
月の満ち欠け 2020年度 日本向け
Full Moon is Purple line
満月は紫色
New Moon is Red line
新月は赤色

Reflex Oscillator - Dr. John EhlersHot off the press, I present this NEW "Reflex Oscillator" employing PSv4.0, originally formulated by Dr. John Ehlers for TASC - February 2020 Traders Tips. John Ehlers might describe it's novel characteristics as being a reversal sensitive near zero-lag averaging indicator retaining the CYCLE component. Also, I would add that irregardless of the sampling interval, this indicator has a bound range between +/-2.0 on "1 second" candles all the way up to "1 month" candle durations. This indicator also has a companion indicator entitled "TrendFlex Oscillator". I have published it in tandem with this one in my scripts profile.
One notable difference between this and the original formulation is that I have added an independent control for the Super Smoother. This "tweak" is enabled by applying the override and adjusting it's period. There is a "Post Smooth" input() that "tweaks" the internal Reflex EMA too. Keep in mind that my intention of adding tweaks is solely for experimentation with the original formulation.
I also added adjustable levels for those of you that may wish to employ alertcondition()s to this indicator somehow. Providing a more utilitarian approach, I created this with an easy to use reusable function named reflex(). As always, I have included advanced Pine programming techniques that conform to proper "Pine Etiquette". Being this is one of John Ehlers' first two simultaneously released indicators for 2020, I felt a few more bells and whistles were appropriate as a proper contribution to the Tradingview community.
Features List Includes:
Dark Background - Easily disabled in indicator Settings->Style for "Light" charts or with Pine commenting
AND much, much more... You have the source!
The comments section below is solely just for commenting and other remarks, ideas, compliments, etc... regarding only this indicator, not others. When available time provides itself, I will consider your inquiries, thoughts, and concepts presented below in the comments section, should you have any questions or comments regarding this indicator. When my indicators achieve more prevalent use by TV members, I may implement more ideas when they present themselves as worthy additions. As always, "Like" it if you simply just like it with a proper thumbs up, and also return to my scripts list occasionally for additional postings. Have a profitable future everyone!

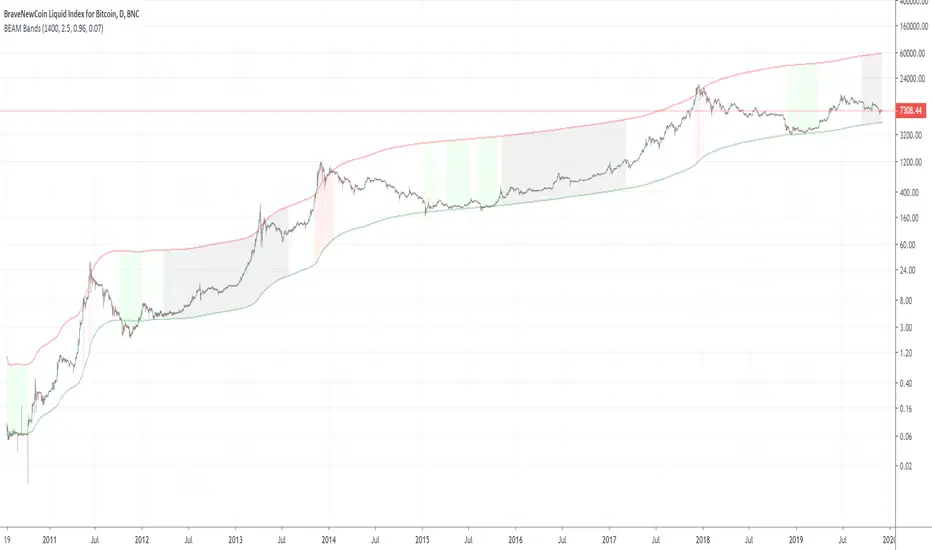
BEAM BandsBEAM Bands is a version of the BEAM indicator that is drawn directly on the price chart. It is a more visual representation of BEAM and lets you compare it directly to the price.
Disclaimer: This is not financial advice. For educational purposes only.