Holy GrailThis is a long-only educational strategy that simulates what happens if you keep adding to a position during pullbacks and only exit when the asset hits a new All-Time High (ATH). It is intended for learning purposes only — not for live trading.
🧠 How it works:
The strategy identifies pullbacks using a simple moving average (MA).
When price dips below the MA, it begins monitoring for the first green candle (close > open).
That green candle signals a potential bottom, so it adds to the position.
If price goes lower, it waits for the next green candle and adds again.
The exit happens after ATH — it sells on each red candle (close < open) once a new ATH is reached.
You can adjust:
MA length (defines what’s considered a pullback)
Initial buy % (how much to pre-fill before signals start)
Buy % per signal (after pullback green candle)
Exit % per red candle after ATH
📊 Intended assets & timeframes:
This strategy is designed for broad market indices and long-term appreciating assets, such as:
SPY, NASDAQ, DAX, FTSE
Use it only on 1D or higher timeframes — it’s not meant for scalping or short-term trading.
⚠️ Important Limitations:
Long-only: The script does not short. It assumes the asset will eventually recover to a new ATH.
Not for all assets: It won't work on assets that may never recover (e.g., single stocks or speculative tokens).
Slow capital deployment: Entries happen gradually and may take a long time to close.
Not optimized for returns: Buy & hold can outperform this strategy.
No slippage, fees, or funding costs included.
This is not a performance strategy. It’s a teaching tool to show that:
High win rate ≠ high profitability
Patience can be deceiving
Many signals = long capital lock-in
🎓 Why it exists:
The purpose of this strategy is to demonstrate market psychology and risk overconfidence. Traders often chase strategies with high win rates without considering holding time, drawdowns, or opportunity cost.
This script helps visualize that phenomenon.
Cicli

HMA Crossover + ATR + Curvature (Long & Short)📏 Hull Moving Averages (Trend Filters)
- fastHMA = ta.hma(close, fastLength)
- slowHMA = ta.hma(close, slowLength)
These two HMAs act as dynamic trend indicators:
- A bullish crossover of fast over slow HMA signals a potential long setup.
- A bearish crossunder triggers short interest.
⚡️ Curvature (Acceleration Filter)
- curv = ta.change(ta.change(fastHMA))
This calculates the second-order change (akin to the second derivative) of the fast HMA — effectively the acceleration of the trend. It serves as a filter:
- For long entries: curv > curvThresh (positive acceleration)
- For short entries: curv < -curvThresh (negative acceleration)
It helps eliminate weak or stagnating moves by requiring momentum behind the crossover.
📈 Volatility-Based Risk Management (ATR)
- atr = ta.atr(atrLength)
- stopLoss = atr * atrMult
- trailStop = atr * trailMult
These define your:
- Initial stop loss: scaled to recent volatility using ATR and atrMult.
- Trailing stop: also ATR-scaled, to lock in gains dynamically as price moves favorably.
💰 Position Sizing via Risk Percent
- capital = strategy.equity
- riskCapital = capital * (riskPercent / 100)
- qty = riskCapital / stopLoss
This dynamically calculates the position size (qty) such that if the stop loss is hit, the loss does not exceed the predefined percentage of account equity. It’s a volatility-adjusted position sizing method, keeping your risk consistent regardless of market conditions.
📌 Execution Logic
- Long Entry: on bullish HMA crossover with rising curvature.
- Short Entry: on bearish crossover with falling curvature.
- Exits: use ATR-based trailing stops.
- Position is closed when trend conditions reverse (e.g., bearish crossover exits the long).
This framework gives you:
- Trend-following logic (via HMAs)
- Momentum confirmation (via curvature)
- Volatility-aware execution and exits (via ATR)
- Risk-controlled dynamic sizing
Want to get surgical and test what happens if we use curvature on the difference between HMAs instead? That might give some cool insights into trend strength transitions.

LANZ Strategy 1.0 [Backtest]🔷 LANZ Strategy 1.0 — Time-Based Session Trading with Smart Reversal Logic and Risk-Controlled Limit Orders
This backtest version of LANZ Strategy 1.0 brings precision to session-based trading by using directional confirmation, pre-defined risk parameters, and limit orders that execute overnight. Designed for the 1-hour timeframe, it allows traders to evaluate the system with configurable SL, TP, and risk settings in a fully automated environment.
🧠 Core Strategy Logic:
1. Directional Confirmation at 18:00 NY:
At 18:00 NY, the system compares the 08:00 open vs the 18:00 close:
If the direction matches the previous day, the signal is reversed.
If the direction differs, the current day's trend is kept.
This logic is designed to avoid momentum exhaustion and capture corrective reversals.
2. Entry Level Definition:
Based on the confirmed direction:
For BUY, the Low of the day is used as Entry Point (EP).
For SELL, the High of the day becomes EP.
The system plots a Stop Loss and Take Profit based on user-defined pip inputs (default: SL = 18 pips, TP = 54 pips → RR 1:3).
3. Time-Limited Entry Execution (LIMIT Orders):
Orders are sent after 18:00 NY and can be triggered anytime between 18:00 and 08:00 NY.
If EP is not touched before 08:00, the order is automatically cancelled.
4. Manual Close Feature:
If the trade is still open at the configured hour (default 09:00 NY), the system closes all positions, simulating realistic intraday exit scenarios.
5. Lot Size Calculation Based on Risk:
Lot size is dynamically calculated using the account size, risk percentage, and SL distance.
This ensures consistent risk exposure regardless of market volatility.
⚙️ Step-by-Step Flow:
08:00 NY → Captures the open of the day.
18:00 NY → Confirms direction and defines EP, SL, and TP.
After 18:00 NY → If conditions are met, a LIMIT order is placed at EP.
Between 18:00–08:00 NY → If price touches EP, the trade is executed.
At 08:00 NY → If EP wasn’t touched, the order is cancelled.
At Configured Manual Close Time (default 09:00 NY) → All open positions are force-closed if still active.
🧪 Backtest Settings:
Timeframe: 1-hour only
Order Type: strategy.entry() with limit=
SL/TP Configurable: Yes, in pips
Risk Input: % of capital per trade
Manual Close Time: Fully adjustable (default 09:00 NY)
👨💻 Credits:
Developed by LANZ
Strategy logic and trading concept built with clarity and precision.
Code structure and documentation by Kairos, your AI trading assistant.
Designed for high-confidence execution and clean backtesting performance.

[Mustang Algo] Channel Strategy# Mustang Algo Channel Strategy - Universal Market Sentiment Oscillator
## 🎯 ORIGINAL CONCEPT
This strategy employs a unique market sentiment oscillator that works on ALL financial assets. It uses Bitcoin supply dynamics combined with stablecoin market capitalization as a macro sentiment indicator to generate universal timing signals across stocks, forex, commodities, indices, and cryptocurrencies.
## 🌐 UNIVERSAL APPLICATION
- **Any Asset Class:** Stocks, Forex, Commodities, Indices, Crypto, Bonds
- **Market-Wide Timing:** BTC/Stablecoin ratio serves as a global risk sentiment gauge
- **Cross-Market Signals:** Trade any instrument using macro liquidity conditions
- **Ecosystem Approach:** One oscillator for all financial markets
## 🧮 METHODOLOGY
**Core Calculation:** BTC Supply / (Combined Stablecoin Market Cap / BTC Price)
- **Data Sources:** DAI + USDT + USDC market capitalizations
- **Signal Generation:** RSI(14) applied to the ratio, double-smoothed with WMA
- **Timing Logic:** Crossover signals filtered by overbought/oversold zones
- **Multi-Timeframe:** Configurable timeframe analysis (default: Daily)
## 📈 TRADING STRATEGY
**LONG Entries:** Bullish crossover when market sentiment is oversold (<48)
**SHORT Entries:** Bearish crossover when market sentiment is overbought (>55)
**Universal Timing:** These macro signals apply to trading any financial instrument
## ⚙️ FLEXIBLE RISK MANAGEMENT
**Three SL/TP Calculation Modes:**
- **Percentage Mode:** Traditional % based (4% SL, 12% TP default)
- **Ticks Mode:** Precise tick-based calculation (50/150 ticks default)
- **Pips Mode:** Forex-style pip calculation (50/150 pips default)
**Realistic Parameters:**
- Commission: 0.1% (adjustable for different asset classes)
- Slippage: 2 ticks
- Position sizing: 10% of equity (conservative)
- No pyramiding (single position management)
## 📊 KEY ADVANTAGES
✅ **Universal Application:** One strategy for all asset classes
✅ **Macro Foundation:** Based on global liquidity and risk sentiment
✅ **False Signal Filtering:** Overbought/oversold zones reduce noise
✅ **Flexible Risk Management:** Multiple SL/TP calculation methods
✅ **No Lookahead Bias:** Clean backtesting with realistic results
✅ **Cross-Market Correlation:** Captures broad market risk cycles
## 🎛️ CONFIGURATION GUIDE
1. **Asset Selection:** Apply to stocks, forex, commodities, indices, crypto
2. **Timeframe Setup:** Daily recommended for swing trading
3. **Sentiment Bounds:** Adjust 48/55 levels based on market volatility
4. **Risk Management:** Choose appropriate SL/TP mode for your asset class
5. **Direction Filter:** Select Long Only, Short Only, or Both
## 📋 BACKTESTING STANDARDS
**Compliant with TradingView Guidelines:**
- ✅ Realistic commission structure (0.1% default)
- ✅ Appropriate slippage modeling (2 ticks)
- ✅ Conservative position sizing (10% equity)
- ✅ Sustainable risk ratios (1:3 SL/TP)
- ✅ No lookahead bias (proper historical simulation)
- ✅ Sufficient sample size potential (100+ trades possible)
## 🔬 ORIGINAL RESEARCH
This strategy introduces a revolutionary approach to financial markets by treating the BTC/Stablecoin ratio as a global risk sentiment gauge. Unlike traditional indicators that analyze individual asset price action, this oscillator captures macro liquidity flows that affect ALL financial markets - from stocks to forex to commodities.
## 🎯 MARKET APPLICATIONS
**Stocks & Indices:** Risk-on/risk-off sentiment timing
**Forex:** Global liquidity flow analysis for major pairs
**Commodities:** Risk appetite for inflation hedges
**Bonds:** Flight-to-safety vs. risk-seeking behavior
**Crypto:** Native application with direct correlation
## ⚠️ RISK DISCLOSURE
- Designed for intermediate to long-term trading across all timeframes
- Market sentiment can remain extreme longer than expected
- Always use appropriate position sizing for your specific asset class
- Adjust commission and slippage settings for different markets
- Past performance does not guarantee future results
## 🚀 INNOVATION SUMMARY
**What makes this strategy unique:**
- First to use BTC/Stablecoin ratio as universal market sentiment indicator
- Applies macro-economic principles to technical analysis across all assets
- Single oscillator provides timing signals for entire financial ecosystem
- Bridges traditional finance with digital asset insights
- Combines fundamental liquidity analysis with technical precision

LANZ Strategy 3.0 [Backtest]🔷 LANZ Strategy 3.0 — Asian Range Fibonacci Scalping Strategy
LANZ Strategy 3.0 is a precision-engineered backtesting tool tailored for intraday traders who rely on the Asian session range to determine directional bias. This strategy implements dynamic Fibonacci projections and strict time-window validation to simulate a clean and disciplined trading environment.
🧠 Core Components:
Asian Range Bias Definition: Direction is established between 01:15–02:15 a.m. NY time based on the candle’s close in relation to the midpoint of the Asian session range (18:00–01:15 NY).
Limit Order Execution: Only one trade is placed daily, using a limit order at the Asian range high (for sells) or low (for buys), between 01:15–08:00 a.m. NY.
Fibonacci-Based TP/SL:
Original Mode: TP = 2.25x range, SL = 0.75x range.
Optimized Mode: TP = 1.95x range, SL = 0.65x range.
No Trade After 08:00 NY: If the limit order is not executed before 08:00 a.m. NY, it is canceled.
Fallback Logic at 02:15 NY: If the market direction misaligns with the setup at 02:15 a.m., the system re-evaluates and can re-issue the order.
End-of-Day Closure: All positions are closed at 15:45 NY if still open.
📊 Backtest-Ready Design:
Entries and exits are executed using strategy.entry() and strategy.exit() functions.
Position size is fixed via capital risk allocation ($100 per trade by default).
Only one position can be active at a time, ensuring controlled risk.
📝 Notes:
This strategy is ideal for assets sensitive to the Asian/London session overlap, such as Forex pairs and indices.
Easily switch between Fibonacci versions using a single dropdown input.
Fully deterministic: all entries are based on pre-defined conditions and time constraints.
👤 Credits:
Strategy developed by rau_u_lanz using Pine Script v6. Built for traders who favor clean sessions, directional clarity, and consistent execution using time-based logic and Fibonacci projections.

Range Filter + ATR Strategy (Low Drawdown)Key Features for Low Drawdown:
Range Filter: Identifies trends while filtering out market noise
ATR-based Position Sizing: Adjusts position size based on volatility to risk a fixed percentage of capital
Trailing Stops: Uses ATR-based trailing stops to lock in profits and limit losses
Conservative Risk Parameters: Defaults to 1% risk per trade (adjustable)
Trend Confirmation: Requires two consecutive closes above/below the range filter
How to Use:
The strategy enters long when price is above the upper range filter for two consecutive bars
Enters short when price is below the lower range filter for two consecutive bars
Uses ATR to size positions appropriately for current volatility
Implements trailing stops based on ATR to protect profits
Optimization Tips:
Adjust the Range Filter period based on your timeframe
Modify the risk percentage (1% is conservative)
Tweak the ATR multiple for trailing stops (1.5 is moderate)
Consider adding a time-based exit if drawdown is still too high

LANZ Strategy 2.0 [Backtest]🔷 LANZ Strategy 2.0 — Structural Breakout Logic with Dynamic Swing Protection
LANZ Strategy 2.0 is a precision-focused backtesting system built for intraday traders who rely on structural confirmations before the London session to guide directional bias. This tool uses smart swing detection, risk-defined position sizing, and strict time-based execution to simulate real trading conditions with clarity and control.
🧠 Core Components:
Structural Confirmation (Trend & BoS): Detects trend direction and break of structure (BoS) using a three-swing logic, aligning trade entries with valid structural movement.
Time-Based Execution: Trades are triggered exclusively at 02:00 a.m. New York time, ensuring disciplined and repeatable intraday testing.
Swing-Based SL Models: Traders can select between three stop-loss protection types:
First Swing: Most recent structural level
Second Swing: Prior level
Full Coverage: All recent swing levels + configurable pip buffer
Dynamic TP Calculation: Take-Profit is projected as a risk-based multiple (RR), fully adjustable via input.
Capital-Based Risk Management: Risk is defined as a percentage of a fixed account size (e.g., $100 per trade from $10,000), and lot size is automatically calculated based on SL distance.
Fallback Entry Logic: If structural breakout is present but trend is not confirmed, a secondary entry is triggered.
End-of-Session Management: Any open trades are automatically closed at 11:45 a.m. NY time, with optional manual labeling or review.
📊 Visual Features (Optional in Indicator Version):
(Note: Visuals apply to the indicator version of LANZ 2.0, not this backtest script)
Swing level labels (1st, 2nd) and dynamic SL/TP lines.
Real-time session coloring for clarity: Pre-London, Entry Window, and NY Close.
Outcome labels: +RR, -RR, or net % at close.
Auto-cleanup of previous drawings for a clean chart per session.
⚙️ How It Works:
Detects last trend and BoS using swing logic before 02:00 a.m. NY.
At 02:00 a.m., evaluates directional bias and executes BUY or SELL if confirmed.
Applies selected SL logic (1st, 2nd, or full swing protection).
Sets TP based on the RR multiplier.
Closes the trade either on SL, TP, or at 11:45 a.m. NY manually.
🔔 Alerts:
Time-of-day alert at 02:00 a.m. NY to monitor execution.
Can be extended to cover SL/TP triggers or new BoS events.
📝 Notes:
Designed for backtesting precision and discretionary decision-making.
Ideal for Forex pairs, indices, or assets active during the London session.
Fully customizable: session timing, swing logic, SL buffer, and RR.
👤 Credits:
Strategy built by @rau_u_lanz using Pine Script v6, combining structural logic, capital-based risk control, and London-session timing in a backtest-ready framework for traders who demand accuracy and structure.

VWAP Breakout Strategy + EMAs + Clean Cycle/TP/SL PlotsHere’s a quick user-guide to get you up and running with your “VWAP Breakout Strategy + EMAs + Clean Cycle/TP/SL Plots” script in TradingView:
⸻
1. Installing the Script
1. Open TradingView, go to Pine Editor (bottom panel).
2. Paste in your full Pine-v6 code and hit Add to chart.
3. Save it (“Save as…”): give it a memorable name (e.g. “VWAP Breakout+EMAs”).
⸻
2. Configuring Your Inputs
Once it’s on the chart, click the ⚙️ Settings icon to tune:
Setting Default What it does
ATR Length 14 Period for average true range (volatility measure)
ATR Multiplier for Stop 1.5 How many ATRs away your stop-loss sits
TP1 / TP2 Multipliers (ATR) 1.0 / 2.0 Distance of TP1 and TP2 in ATR multiples
Show VWAP / EMAs On Toggles the blue VWAP line & EMAs (100/34/5)
Full Cycle Range Points 200 Height of the shaded “cycle zone”
Pivot Lookback 5 How many bars back to detect a pivot low
Round Number Step 500 Spacing of your dotted horizontal lines
Show TP/SL Labels On Toggles all the “ENTRY”, “TP1”, “TP2”, “STOP” tags
Feel free to adjust ATR multipliers and cycle-zone size based on the instrument’s typical range.
⸻
3. Reading the Signals
• Long Entry:
• Trigger: price crosses above VWAP
• You’ll see a green “Buy” tag at the low of the signal bar, plus an “ENTRY (Long)” label at the close.
• Stop is plotted as a red dashed line below (ATR × 1.5), and TP1/TP2 as teal and purple lines above.
• Short Entry:
• Trigger: price crosses below VWAP
• A red “Sell” tag appears at the high, with “ENTRY (Short)” at the close.
• Stop is the green line above; TP1/TP2 are dashed teal/purple lines below.
⸻
4. Full Cycle Zone
Whenever a new pivot low is detected (using your Pivot Lookback), the script deletes the old box and draws a shaded yellow rectangle from that low up by “Full Cycle Range Points.”
• Use this to visualize the “maximum expected swing” from your pivot.
• You can quickly see whether price is still traveling within a normal cycle or has overstretched.
⸻
5. Round-Number Levels
With Show Round Number Levels enabled, you’ll always get horizontal dotted lines at the nearest multiples of your “Round Number Step” (e.g. every 500 points).
• These often act as psychological support/resistance.
• Handy to see confluence with VWAP or cycle-zone edges.
⸻
6. Tips & Best-Practices
• Timeframes: Apply on any intraday chart (5 min, 15 min, H1…), but match your ATR length & cycle-points to the timeframe’s typical range.
• Backtest first: Use the Strategy Tester tab to review performance, tweak ATR multipliers or cycle size, then optimize.
• Combine with context: Don’t trade VWAP breakouts blindly—look for confluence (e.g. support/resistance zones, higher-timeframe trend).
• Label clutter: If too many labels build up, you can toggle Show TP/SL Labels off and rely just on the lines.
⸻
That’s it! Once you’ve added it to your chart and dialed in the inputs, your entries, exits, cycle ranges, and key levels will all be plotted automatically. Feel free to experiment with the ATR multipliers and cycle-zone size until it fits your instrument’s personality. Happy trading!

Rawstocks 15 Minute ModelRawstocks 15-Minute Model
The Rawstocks 15-Minute Model is a precision intraday trading strategy designed for the US stock market (9:30 AM - 4:00 PM ET), optimized for the 15-minute timeframe. It combines institutional order flow concepts with Fibonacci retracements to identify high-probability reversal setups while enforcing strict risk management and session-based rules.
Key Features
Time-Based Execution
Trading Hours: 9:30 AM - 4:00 PM ET (no new entries after 4:00 PM)
Force Close: All positions auto-exit at 4:30 PM ET (prevents overnight risk)
Entry Logic
Order Block + Fib Confluence:
Identifies institutional order blocks (previous swing highs/lows)
Requires price pullback to 61.8% or 79% Fibonacci level
Liquidity Confirmation:
Waits for stop runs (liquidity sweeps) before reversal entries
Exit Rules
Stop Loss: 1x ATR (14) from entry
Take Profit: 2:1 Risk-Reward (adjustable)
Visual Signals
Green Triangle: Valid long setup (pullback to bullish OB + Fib)
Red Triangle: Valid short setup (pullback to bearish OB + Fib)
Blue/Purple Background: Highlights active trading vs. close period
How It Works
Identify the Setup
Wait for a strong impulse move (break of structure)
Mark the order block (institutional zone)
Confirm Pullback
Price must retrace to 61.8% or 79% Fib level
Must occur within trading hours (9:30 AM - 4:00 PM)
Enter on Confirmation
Long: Break of pullback candle high (stop below recent swing low)
Short: Break of pullback candle low (stop above recent swing high)
Manage the Trade
Trail stop or exit at 2R (risk-to-reward)
All positions close at 4:30 PM sharp

Gaussian Channel StrategyGaussian Channel Strategy — User Guide
1. Concept
This strategy builds trades around the Gaussian Channel. Based on Pine Script v4 indicator originally published by Donovan Wall. With rework to v6 Pine Script and adding entry and exit functions.
The channel consists of three dynamic lines:
Line Formula Purpose
Filter (middle) N-pole Gaussian filter applied to price Market "equilibrium"
High Band Filter + (Filtered TR × mult) Dynamic upper envelope
Low Band Filter − (Filtered TR × mult) Dynamic lower envelope
A position is opened when price crosses a user-selected line in a user-selected direction.
When the smoothed True Range (Filtered TR) becomes negative, the raw bands can flip (High drops below Low).
The strategy automatically reorders them so the upper band is always above the lower band.
Visual colors still flip, but signals stay correct.
2. Entry Logic
Choose a signal line for longs and/or shorts: Filter, Upper band, or Lower band.
Choose a cross direction (Cross Up or Cross Down).
A signal remains valid for Lookback bars after the actual cross, as long as price is still on the required side of the line.
When the opposite signal appears, the current position is closed or reversed depending on Reverse on opposite.
3. Parameters
Group Setting Meaning
Source & Filter Source Price series used (close, hlc3, etc.)
Poles (N) Number of Gaussian filter poles (1-9). More poles ⇒ smoother but laggier
Sampling Period Main period length of the channel
Filtered TR Multiplier Width of the bands in fractions of smoothed True Range
Reduced Lag Mode Adds a lag-compensation term (faster but noisier)
Fast Response Mode Blends 1-pole & N-pole outputs for quicker turns
Signals Long → signal line / Short → signal line Which line generates signals
Long when price / Short when price Direction of the cross
Lookback bars for late entry Bars after the cross that still allow an entry
Trading Enable LONG/SHORT-side trades Turn each side on/off
On opposite signal: reverse True: reverse -- False: flat
Misc Start trading date Ignores signals before this timestamp (back-test focus)
4. Quick Start
Add the strategy to a chart. Default: hlc3, N = 4, Period = 144.
Select your signal lines & directions.
Example: trend trading – Long: Filter + Cross Up, Short: Filter + Cross Down.
Disable either side if you want long-only or short-only.
Tune Lookback (e.g. 3) to catch gaps and strong impulses.
Run Strategy Tester, optimise period / multiplier / stops (add strategy.exit blocks if needed).
When satisfied, connect alerts via TradingView webhooks or use the builtin broker panel.
5. Notes
Commission & slippage are not preset – adjust them in Properties → Commission & Slippage.
Works on any market and timeframe, but you should retune Sampling Period and Multiplier for each symbol.
No stop-loss / take-profit is included by default – feel free to add with strategy.exit.
Start trading date lets you back-test only recent history (e.g. last two years).
6. Disclaimer
This script is for educational purposes only and does not constitute investment advice.
Use entirely at your own risk. Back-test thoroughly and apply sound risk management before trading real capital.

Price Flip StrategyPrice Flip Strategy with User-Defined Ticker Max/Max
This strategy leverages an inverted price calculation based on user-defined maximum and minimum price levels over customizable lookback periods. It generates buy and sell signals by comparing the previous bar's original price to the inverted price, within a specified date range. The script plots key metrics, including ticker max/min, original and inverted prices, moving averages, and HLCC4 averages, with customizable visibility toggles and labels for easy analysis.
Key Features:
Customizable Inputs: Set lookback periods for ticker max/min, moving average length, and date range for signal generation.
Inverted Price Logic: Calculates an inverted price using ticker max/min to identify trading opportunities.
Flexible Visualization: Toggle visibility for plots (e.g., ticker max/min, prices, moving averages, HLCC4 averages) and last-bar labels with user-defined colors and sizes.
Trading Signals: Generates buy signals when the previous original price exceeds the inverted price, and sell signals when it falls below, with alerts for real-time notifications.
Labeling: Displays values on the last bar for all plotted metrics, aiding in quick reference.
How to Use:
Add to Chart: Apply the script to a TradingView chart via the Pine Editor.
Configure Settings:
Date Range: Set the start and end dates to define the active trading period.
Ticker Levels: Adjust the lookback periods for calculating ticker max and min (e.g., 100 bars for max, 100 for min).
Moving Averages: Set the length for exponential moving averages (default: 20 bars).
Plots and Labels: Enable/disable specific plots (e.g., Inverted Price, Original HLCC4) and customize label colors/sizes for clarity.
Interpret Signals:
Buy Signal: Triggered when the previous close price is above the inverted price; marked with an upward label.
Sell Signal: Triggered when the previous close price is below the inverted price; marked with a downward label.
Set Alerts: Use the built-in alert conditions to receive notifications for buy/sell signals.
Analyze Plots: Review plotted lines (e.g., ticker max/min, HLCC4 averages) and last-bar labels to assess price behavior.
Tips:
Use in trending markets by enabling ticker max for uptrends or ticker min for downtrends, as indicated in tooltips.
Adjust the label offset to prevent overlapping text on the last bar.
Test the strategy on a demo account to optimize lookback periods and moving average settings for your asset.
Disclaimer: This script is for educational purposes and should be tested thoroughly before use in live trading. Past performance is not indicative of future results.

Vinicius Setup ATR
Description:
This script is a strategy based on the Supertrend indicator combined with volume analysis, candle strength, and RSI. Its goal is to identify potential entry points for buy and sell trades based on technical criteria, without promising profitability or guaranteed results.
Script Components:
Supertrend: Used as the main trend compass. When the trend is positive (direction = 1), buy signals are considered; when negative (direction = -1), sell signals are considered.
Volume: Entries are only validated if the volume is above the average of the last 20 candles, adjusted with a 1.2 multiplier.
Candle Body: The candle body must be larger than a certain percentage of the ATR, ensuring sufficient strength and volatility.
RSI: Used as a filter to avoid trades in extreme overbought or oversold zones.
Support and Resistance: Identified based on simple pivots (5 periods before and after).
Customizable Parameters:
ATR Length and Multiplier: Controls the sensitivity of the Supertrend.
RSI Period: Adjusts the relative strength filter.
Minimum Volume and Candle Body: Settings to validate entry signals.
Entry Conditions:
Buy: Positive trend + strong candle + high volume + RSI below 70.
Sell: Negative trend + strong candle + high volume + RSI above 30.
Exit Conditions:
The trade is closed upon the appearance of an opposite signal.
Notes:
This is a technical system with no profit guarantees.
It is recommended to test with realistic capital values and parameters suited to your risk management.
The script is not optimized for specific profitability, but rather to support study and the construction of setups with objective criteria.

EMA 34 Crossover with Break Even Stop LossEMA 34 Crossover with Break Even Stop Loss Strategy
This trading strategy is based on the 34-period Exponential Moving Average (EMA) and aims to enter long positions when the price crosses above the EMA 34. The strategy is designed to manage risk effectively with a dynamic stop loss and take-profit mechanism.
Key Features:
EMA 34 Crossover:
The strategy generates a long entry signal when the closing price of the current bar crosses above the 34-period EMA, with the condition that the previous closing price was below the EMA. This crossover indicates a potential upward trend.
Risk Management:
Upon entering a trade, the strategy sets a stop loss at the low of the previous bar. This helps in controlling the downside risk.
A take profit level is set at a 10:1 risk-to-reward ratio, meaning the potential profit is ten times the amount risked on the trade.
Break-even Stop Loss:
As the price moves in favor of the trade and reaches a 3:1 risk-to-reward ratio, the strategy moves the stop loss to the entry price (break-even). This ensures that no loss will be incurred if the market reverses, effectively protecting profits.
Exit Conditions:
The strategy exits the trade when either the stop loss is hit (if the price drops below the stop loss level) or the take profit target is reached (if the price rises to the take profit level).
If the price reaches the break-even level (entry price), the stop loss is adjusted to lock in profits and prevent any loss.
Visualization:
The stop loss and take profit levels are plotted on the chart for easy visualization, helping traders track the status of their trade.
Trade Management Summary:
Long Entry: When price crosses above the 34-period EMA.
Stop Loss: Set to the low of the previous candle.
Take Profit: Set to a 10:1 risk-to-reward ratio.
Break-even: Stop loss is moved to entry price when a 3:1 risk-to-reward ratio is reached.
Exit: The trade is closed either when the stop loss or take profit levels are hit.
This strategy is designed to minimize losses by employing a dynamic stop loss and to maximize gains by setting a favorable risk-to-reward ratio, making it suitable for traders who prefer a structured, automated approach to risk management and trend-following.

LUX CLARA - EMA + VWAP (No ATR Filter) - v6EMA STRAT SHOUT OUTOUTLIERSSSSS
Overview:
an intraday strategy built around two core principles:
Trend Confirmation using the 50 EMA (Exponential Moving Average) in relation to the VWAP (Volume-Weighted Average Price).
Entry Signals triggered by the 8 EMA crossing the 50 EMA in the direction of that confirmed trend.
Key Logic:
Bullish Trend if the 50 EMA is above VWAP. Only long entries are allowed when the 8 EMA crosses above the 50 EMA during that bullish phase.
Bearish Trend if the 50 EMA is below VWAP. Only short entries are allowed when the 8 EMA crosses below the 50 EMA during that bearish phase.
Intraday Focus: Trades are restricted to a user-defined session window (default 7:30 AM–11:30 AM), aligning entries/exits with peak intraday liquidity.
Exit Rule: Positions close automatically when the 8 EMA crosses back in the opposite direction of the entry.
Why It Works:
EMA + VWAP helps detect both immediate momentum (EMAs) and overall institutional bias (VWAP).
By confining trades to a set intraday window, the strategy aims to capture morning volatility while avoiding choppy afternoon or overnight sessions.
Customization:
Users can adjust EMA lengths, session times, or incorporate stops/targets for additional risk management.
It can be tested on various symbols and intraday timeframes to gauge performance and robustness.

Enhanced Range Filter Strategy with ATR TP/SLBuilt by Omotola
## **Enhanced Range Filter Strategy: A Comprehensive Overview**
### **1. Introduction**
The **Enhanced Range Filter Strategy** is a powerful technical trading system designed to identify high-probability trading opportunities while filtering out market noise. It utilizes **range-based trend filtering**, **momentum confirmation**, and **volatility-based risk management** to generate precise entry and exit signals. This strategy is particularly useful for traders who aim to capitalize on trend-following setups while avoiding choppy, ranging market conditions.
---
### **2. Key Components of the Strategy**
#### **A. Range Filter (Trend Determination)**
- The **Range Filter** smooths price fluctuations and helps identify clear trends.
- It calculates an **adjusted price range** based on a **sampling period** and a **multiplier**, ensuring a dynamic trend-following approach.
- **Uptrends:** When the current price is above the range filter and the trend is strengthening.
- **Downtrends:** When the price falls below the range filter and momentum confirms the move.
#### **B. RSI (Relative Strength Index) as Momentum Confirmation**
- RSI is used to **filter out weak trades** and prevent entries during overbought/oversold conditions.
- **Buy Signals:** RSI is above a certain threshold (e.g., 50) in an uptrend.
- **Sell Signals:** RSI is below a certain threshold (e.g., 50) in a downtrend.
#### **C. ADX (Average Directional Index) for Trend Strength Confirmation**
- ADX ensures that trades are only taken when the trend has **sufficient strength**.
- Avoids trading in low-volatility, ranging markets.
- **Threshold (e.g., 25):** Only trade when ADX is above this value, indicating a strong trend.
#### **D. ATR (Average True Range) for Risk Management**
- **Stop Loss (SL):** Placed **one ATR below** (for long trades) or **one ATR above** (for short trades).
- **Take Profit (TP):** Set at a **3:1 reward-to-risk ratio**, using ATR to determine realistic price targets.
- Ensures volatility-adjusted risk management.
---
### **3. Entry and Exit Conditions**
#### **📈 Buy (Long) Entry Conditions:**
1. **Price is above the Range Filter** → Indicates an uptrend.
2. **Upward trend strength is positive** (confirmed via trend counter).
3. **RSI is above the buy threshold** (e.g., 50, to confirm momentum).
4. **ADX confirms trend strength** (e.g., above 25).
5. **Volatility is supportive** (using ATR analysis).
#### **📉 Sell (Short) Entry Conditions:**
1. **Price is below the Range Filter** → Indicates a downtrend.
2. **Downward trend strength is positive** (confirmed via trend counter).
3. **RSI is below the sell threshold** (e.g., 50, to confirm momentum).
4. **ADX confirms trend strength** (e.g., above 25).
5. **Volatility is supportive** (using ATR analysis).
#### **🚪 Exit Conditions:**
- **Stop Loss (SL):**
- **Long Trades:** 1 ATR below entry price.
- **Short Trades:** 1 ATR above entry price.
- **Take Profit (TP):**
- Set at **3x the risk distance** to achieve a favorable risk-reward ratio.
- **Ranging Market Exit:**
- If ADX falls below the threshold, indicating a weakening trend.
---
### **4. Visualization & Alerts**
- **Colored range filter line** changes based on trend direction.
- **Buy and Sell signals** appear as labels on the chart.
- **Stop Loss and Take Profit levels** are plotted as dashed lines.
- **Gray background highlights ranging markets** where trading is avoided.
- **Alerts trigger on Buy, Sell, and Ranging Market conditions** for automation.
---
### **5. Advantages of the Enhanced Range Filter Strategy**
✅ **Trend-Following with Noise Reduction** → Helps avoid false signals by filtering out weak trends.
✅ **Momentum Confirmation with RSI & ADX** → Ensures that only strong, valid trades are executed.
✅ **Volatility-Based Risk Management** → ATR ensures adaptive stop loss and take profit placements.
✅ **Works on Multiple Timeframes** → Effective for day trading, swing trading, and scalping.
✅ **Visually Intuitive** → Clearly displays trade signals, SL/TP levels, and trend conditions.
---
### **6. Who Should Use This Strategy?**
✔ **Trend Traders** who want to enter trades with momentum confirmation.
✔ **Swing Traders** looking for medium-term opportunities with a solid risk-reward ratio.
✔ **Scalpers** who need precise entries and exits to minimize false signals.
✔ **Algorithmic Traders** using alerts for automated execution.
---
### **7. Conclusion**
The **Enhanced Range Filter Strategy** is a powerful trading tool that combines **trend-following techniques, momentum indicators, and risk management** into a structured, rule-based system. By leveraging **Range Filters, RSI, ADX, and ATR**, traders can improve trade accuracy, manage risk effectively, and filter out unfavorable market conditions.
This strategy is **ideal for traders looking for a systematic, disciplined approach** to capturing trends while **avoiding market noise and false breakouts**. 🚀

Supertrend + MACD CrossoverKey Elements of the Template:
Supertrend Settings:
supertrendFactor: Adjustable to control the sensitivity of the Supertrend.
supertrendATRLength: ATR length used for Supertrend calculation.
MACD Settings:
macdFastLength, macdSlowLength, macdSignalSmoothing: These settings allow you to fine-tune the MACD for better results.
Risk Management:
Stop-Loss: The stop-loss is based on the ATR (Average True Range), a volatility-based indicator.
Take-Profit: The take-profit is based on the risk-reward ratio (set to 3x by default).
Both stop-loss and take-profit are dynamic, based on ATR, which adjusts according to market volatility.
Buy and Sell Signals:
Buy Signal: Supertrend is bullish, and MACD line crosses above the Signal line.
Sell Signal: Supertrend is bearish, and MACD line crosses below the Signal line.
Visual Elements:
The Supertrend line is plotted in green (bullish) and red (bearish).
Buy and Sell signals are shown with green and red triangles on the chart.
Next Steps for Optimization:
Backtesting:
Run backtests on BTC in the 5-minute timeframe and adjust parameters (Supertrend factor, MACD settings, risk-reward ratio) to find the optimal configuration for the 60% win ratio.
Fine-Tuning Parameters:
Adjust supertrendFactor and macdFastLength to find more optimal values based on BTC's market behavior.
Tweak the risk-reward ratio to maximize profitability while maintaining a good win ratio.
Evaluate Market Conditions:
The performance of the strategy can vary based on market volatility. It may be helpful to evaluate performance in different market conditions or pair it with a filter like RSI or volume.
Let me know if you'd like further tweaks or explanations!

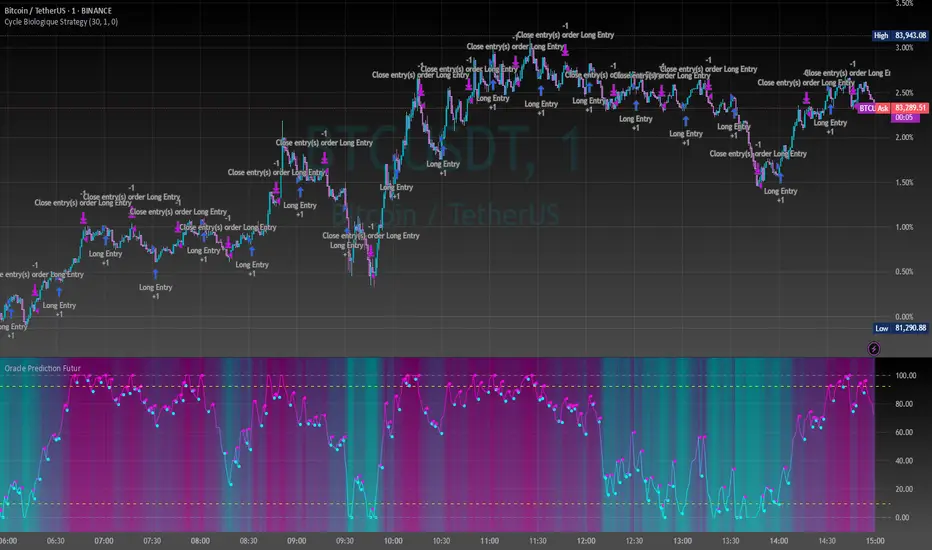
Cycle Biologique Strategy // (\_/)
// ( •.•)
// (")_(")
//@fr33domz
Experimental Research: Cycle Biologique Strategy
Overview
The "Cycle Biologique Strategy" is an experimental trading algorithm designed to leverage periodic cycles in price movements by utilizing a sinusoidal function. This strategy aims to identify potential buy and sell signals based on the behavior of a custom-defined biological cycle.
Key Parameters
Cycle Length: This parameter defines the duration of the cycle, set by default to 30 periods. The user can adjust this value to optimize the strategy for different asset classes or market conditions.
Amplitude: The amplitude of the cycle influences the scale of the sinusoidal wave, allowing for customization in the sensitivity of buy and sell signals.
Offset: The offset parameter introduces phase shifts to the cycle, adjustable within a range of -360 to 360 degrees. This flexibility allows the strategy to align with various market rhythms.
Methodology
The core of the strategy lies in the calculation of a periodic cycle using a sinusoidal function.
Trading Signals
Buy Signal: A buy signal is generated when the cycle value crosses above zero, indicating a potential upward momentum.
Sell Signal: Conversely, a sell signal is triggered when the cycle value crosses below zero, suggesting a potential downtrend.
Execution
The strategy executes trades based on these signals:
Upon receiving a buy signal, the algorithm enters a long position.
When a sell signal occurs, the strategy closes the long position.
Visualization
To enhance user experience, the periodic cycle is plotted visually on the chart in blue, allowing traders to observe the cyclical nature of the strategy and its alignment with market movements.
Dow Theory Trend StrategyDow Theory Trend Strategy (Pine Script)
Overview
This Pine Script implements a trading strategy based on the core principles of Dow Theory. It visually identifies trends (uptrend, downtrend) by analyzing pivot highs and lows and executes trades when the trend direction changes. This script is an improved version that features refined trend determination logic and strategy implementation.
Core Concept: Dow Theory
The script uses a fundamental Dow Theory concept for trend identification:
Uptrend: Characterized by a series of Higher Highs (HH) and Higher Lows (HL).
Downtrend: Characterized by a series of Lower Highs (LH) and Lower Lows (LL).
How it Works
Pivot Point Detection:
It uses the built-in ta.pivothigh() and ta.pivotlow() functions to identify significant swing points (potential highs and lows) in the price action.
The pivotLookback input determines the number of bars to the left and right required to confirm a pivot. Note that this introduces a natural lag (equal to pivotLookback bars) before a pivot is confirmed.
Improved Trend Determination:
The script stores the last two confirmed pivot highs and the last two confirmed pivot lows.
An Uptrend (trendDirection = 1) is confirmed only when the latest pivot high is higher than the previous one (HH) AND the latest pivot low is higher than the previous one (HL).
A Downtrend (trendDirection = -1) is confirmed only when the latest pivot high is lower than the previous one (LH) AND the latest pivot low is lower than the previous one (LL).
Key Improvement: If neither a clear uptrend nor a clear downtrend is confirmed based on the latest pivots, the script maintains the previous trend state (trendDirection := trendDirection ). This differs from simpler implementations that might switch to a neutral/range state (e.g., trendDirection = 0) more frequently. This approach aims for smoother trend following, acknowledging that trends often persist through periods without immediate new HH/HL or LH/LL confirmations.
Trend Change Detection:
The script monitors changes in the trendDirection variable.
changedToUp becomes true when the trend shifts to an Uptrend (from Downtrend or initial state).
changedToDown becomes true when the trend shifts to a Downtrend (from Uptrend or initial state).
Visualizations
Background Color: The chart background is colored to reflect the currently identified trend:
Blue: Uptrend (trendDirection == 1)
Red: Downtrend (trendDirection == -1)
Gray: Initial state or undetermined (trendDirection == 0)
Pivot Points (Optional): Small triangles (shape.triangledown/shape.triangleup) can be displayed above pivot highs and below pivot lows if showPivotPoints is enabled.
Trend Change Signals (Optional): Labels ("▲ UP" / "▼ DOWN") can be displayed when a trend change is confirmed (changedToUp / changedToDown) if showTrendChange is enabled. These visually mark the potential entry points for the strategy.
Strategy Logic
Entry Conditions:
Enters a long position (strategy.long) using strategy.entry("L", ...) when changedToUp becomes true.
Enters a short position (strategy.short) using strategy.entry("S", ...) when changedToDown becomes true.
Position Management: The script uses strategy.entry(), which automatically handles position reversal. If the strategy is long and a short signal occurs, strategy.entry() will close the long position and open a new short one (and vice-versa).
Inputs
pivotLookback: The number of bars on each side to confirm a pivot high/low. Higher values mean pivots are confirmed later but may be more significant.
showPivotPoints: Toggle visibility of pivot point markers.
showTrendChange: Toggle visibility of the trend change labels ("▲ UP" / "▼ DOWN").
Key Improvements from Original
Smoother Trend Logic: The trend state persists unless a confirmed reversal pattern (opposite HH/HL or LH/LL) occurs, reducing potential whipsaws in choppy markets compared to logic that frequently resets to neutral.
Strategy Implementation: Converted from a pure indicator to a strategy capable of executing backtests and potentially live trades based on the Dow Theory trend changes.
Disclaimer
Dow Theory signals are inherently lagging due to the nature of pivot confirmation.
The effectiveness of the strategy depends heavily on the market conditions and the chosen pivotLookback setting.
This script serves as a basic template. Always perform thorough backtesting and implement proper risk management (e.g., stop-loss, take-profit, position sizing) before considering any live trading.

RSI, Volume, MACD, EMA ComboRSI + Volume + MACD + EMA Trading System
This script combines four powerful indicators—Relative Strength Index (RSI), Volume, Moving Average Convergence Divergence (MACD), and Exponential Moving Average (EMA)—to create a comprehensive trading strategy for better trend confirmation and trade entries.
How It Works
RSI (Relative Strength Index)
Helps identify overbought and oversold conditions.
Used to confirm momentum strength before taking a trade.
Volume
Confirms the strength of price movements.
Avoids false signals by ensuring there is sufficient trading activity.
MACD (Moving Average Convergence Divergence)
Confirms trend direction and momentum shifts.
Provides buy/sell signals through MACD line crossovers.
EMA (Exponential Moving Average)
Acts as a dynamic support and resistance level.
Helps filter out trades that go against the overall trend.
Trading Logic
Buy Signal:
RSI is above 50 (bullish momentum).
MACD shows a bullish crossover.
The price is above the EMA (trend confirmation).
Volume is increasing (strong participation).
Sell Signal:
RSI is below 50 (bearish momentum).
MACD shows a bearish crossover.
The price is below the EMA (downtrend confirmation).
Volume is increasing (intense selling pressure).
Backtesting & Risk Management
The strategy is optimized for scalping on the 1-minute timeframe (adjustable for other timeframes).
Default settings use realistic commission and slippage to simulate actual trading conditions.
A stop-loss and take-profit system is integrated to manage risk effectively.
This script is designed to help traders filter out false signals, improve trend confirmation, and increase trade accuracy by combining multiple indicators in a structured way.

Sniper Trade Pro (ES 15-Min) - Topstep Optimized🔹 Overview
Sniper Trade Pro is an advanced algorithmic trading strategy designed specifically for E-mini S&P 500 (ES) Futures on the 15-minute timeframe. This strategy is optimized for Topstep 50K evaluations, incorporating strict risk management to comply with their max $1,000 daily loss limit while maintaining a high probability of success.
It uses a multi-confirmation approach, integrating:
✅ Money Flow Divergence (MFD) → To track liquidity imbalances and institutional accumulation/distribution.
✅ Trend Confirmation (EMA + VWAP) → To identify strong trend direction and avoid choppy markets.
✅ ADX Strength Filter → To ensure entries only occur in trending conditions, avoiding weak setups.
✅ Break-Even & Dynamic Stop-Losses → To reduce drawdowns and protect profits dynamically.
This script automatically generates Buy and Sell signals and provides built-in risk management for automated trading execution through TradingView Webhooks.
🔹 How Does This Strategy Work?
📌 1. Trend Confirmation (EMA + VWAP)
The strategy uses:
✔ 9-EMA & 21-EMA: Fast-moving averages to detect short-term momentum.
✔ VWAP (Volume-Weighted Average Price): Ensures trades align with institutional volume flow.
How it works:
Bullish Condition: 9-EMA above 21-EMA AND price above VWAP → Confirms buy trend.
Bearish Condition: 9-EMA below 21-EMA AND price below VWAP → Confirms sell trend.
📌 2. Liquidity & Money Flow Divergence (MFD)
This indicator measures liquidity shifts by tracking momentum changes in price and volume.
✔ MFD Calculation:
Uses Exponential Moving Average (EMA) of Momentum (MOM) to detect changes in buying/selling pressure.
If MFD is above its moving average, it signals liquidity inflows → bullish strength.
If MFD is below its moving average, it signals liquidity outflows → bearish weakness.
Why is this important?
Detects when Smart Money is accumulating or distributing before major moves.
Filters out false breakouts by confirming momentum strength before entry.
📌 3. Trade Entry Triggers (Candlestick Patterns & ADX Filter)
To avoid random entries, the strategy waits for specific candlestick confirmations with ADX trend strength:
✔ Bullish Entry (Buy Signal) → Requires:
Bullish Engulfing Candle (Reversal confirmation)
ADX > 20 (Ensures strong trending conditions)
MFD above its moving average (Liquidity inflows)
9-EMA > 21-EMA & price above VWAP (Trend confirmation)
✔ Bearish Entry (Sell Signal) → Requires:
Bearish Engulfing Candle (Reversal confirmation)
ADX > 20 (Ensures strong trending conditions)
MFD below its moving average (Liquidity outflows)
9-EMA < 21-EMA & price below VWAP (Trend confirmation)
📌 4. Risk Management & Profit Protection
This strategy is built with strict risk management to maintain low drawdowns and maximize profits:
✔ Dynamic Position Sizing → Automatically adjusts trade size to risk a fixed $400 per trade.
✔ Adaptive Stop-Losses → Uses ATR-based stop-loss (0.8x ATR) to adapt to market volatility.
✔ Take-Profit Targets → Fixed at 2x ATR for a Risk:Reward ratio of 2:1.
✔ Break-Even Protection → Moves stop-loss to entry once price moves 1x ATR in profit, locking in gains.
✔ Max Daily Loss Limit (-$1,000) → Stops trading if total losses exceed $1,000, complying with Topstep rules.

Dynamic Breakout Master by tradingbauhaus 🌟 Code Description:
This Pine Script implements a trading strategy called "Dynamic Breakout Master" 💥. The core idea of the strategy is to identify breakouts (price movements) at key support 💙 and resistance 🔴 levels, through a dynamic channel that adapts to the market’s conditions. Here's how it works:
🔧 Customizable Input Parameters:
🧭 Pivot Period: This defines the number of bars (candles) to the left and right used to detect pivots (highs and lows) that mark the support and resistance zones.
📊 Data Source: You can choose whether to use highs and lows or closes and opens of the candles to identify the pivots.
📏 Max Channel Width: Specifies the maximum width allowed for the support/resistance channel, expressed as a percentage over the last 300 bars.
💪 Minimum Pivot Strength: This defines the minimum number of pivots needed for a support or resistance level to be considered valid.
🏔 Max Support/Resistance Zones: Limits the number of key zones displayed on the chart.
📅 Lookback Period: Adjusts how many bars back the system should check to find and validate support and resistance levels.
🎨 Custom Colors: You can choose colors for the support, resistance, and in-channel zones.
📉 Moving Averages (MA): The strategy allows adding up to two moving averages (SMA or EMA) to assist in making trading decisions.
📊 Calculating Support/Resistance Levels:
The system uses an algorithm to identify pivots from prices and calculates dynamic support and resistance zones 🔒🔓.
The closer the pivots are and the stronger their influence, the more relevant the zone becomes for the strategy.
The dynamic channel is drawn on the chart, with a maximum width limit for these zones defined by the input parameter.
📈 Trading Logic:
🚀 Identifying Breakouts:
The strategy looks for when the price breaks (breakouts) a resistance or support level.
If the price breaks upward through the resistance level, a buy order 📈 is triggered.
If the price breaks downward through the support level, a sell order 📉 is triggered.
🔔 Alerts:
Resistance Break (ResBreak) and Support Break (SupBreak) alerts are configured to notify users when a significant breakout occurs.
💰 Commissions:
The strategy includes a commission (0.1%) to simulate transaction costs for each trade.
📊 Chart Visualization:
The support and resistance zones are displayed as colored rectangles:
🔴 Resistance (red) and
🔵 Support (blue).
Pivots of support and resistance can be labeled as P (for resistance) and V (for support).
Breakouts of support or resistance levels are marked with triangles that appear on the chart 🔺🔻.
📈 Trading Strategy:
If the price breaks upward through the resistance level, a long position (buy) 📈 is opened.
If the price breaks downward through the support level, a short position (sell) 📉 is opened.
🏆 Conclusion:
This script is a dynamic breakout strategy 💥 that allows traders to capture significant price movements when support or resistance channels break. The customizable parameters let users fine-tune the strategy according to their preferences, while the visual alerts on the chart make it easier to follow trading opportunities. The inclusion of moving averages and key price zones adds an extra layer of analysis to improve decision-making 💡.

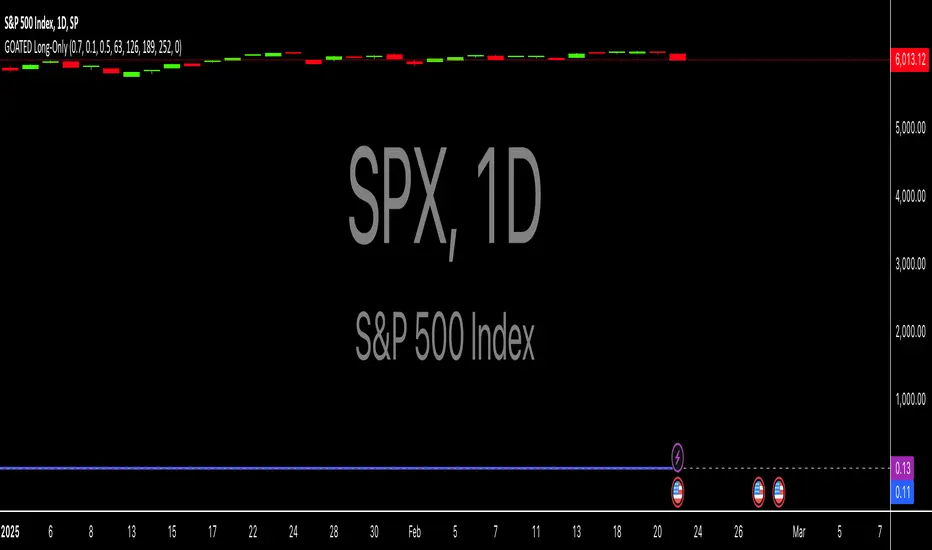
Long-Only For SPXThe "GOATED Long-Only" TradingView strategy, written in Pine Script v5, is designed for long-term momentum trading with a $50 initial capital. It identifies high-momentum stocks by calculating a composite momentum score across 3-month (63 days), 6-month (126 days), 9-month (189 days), and 12-month (252 days) periods, using the formula (current_price / past_price) - 1. The strategy filters stocks with annualized volatility below 0.5 (calculated as the standard deviation of daily returns, annualized by multiplying by the square root of 252 trading days) and requires momentum to exceed a customizable threshold (default 0.0). It enters long positions when momentum becomes positive and exits when it turns negative, using stop-loss (1%) and take-profit (50%) levels to manage risk. The strategy visualizes momentum and volatility on the chart, plotting entry/exit signals as green triangles (long entry) and red triangles (long exit) for backtesting and analysis.
EMA Scoring Strategy## **📊 EMA Scoring Strategy for Trend Analysis**
This strategy is designed to **identify bullish trends** based on multiple **Exponential Moving Averages (EMAs)**. It assigns a **score** based on how the price and EMAs interact, and highlights strong bullish conditions when the score reaches **4 or above**.
---
## **🔹 Strategy Logic**
### 1️⃣ **Calculating EMAs**
- **EMA 21** → Short-term trend
- **EMA 50** → Mid-term trend
- **EMA 100** → Long-term trend
---
### 2️⃣ **Scoring System**
For each trading day, the strategy assigns **+1 or -1 points** based on the following conditions:
| Condition | Score |
|-----------|-------|
| If **Price > EMA 21** | +1 |
| If **Price > EMA 50** | +1 |
| If **Price > EMA 100** | +1 |
| If **EMA 21 > EMA 50** | +1 |
| If **EMA 50 > EMA 100** | +1 |
| If **EMA 21 > EMA 100** | +1 |
| If **Price < EMA 21** | -1 |
| If **Price < EMA 50** | -1 |
| If **Price < EMA 100** | -1 |
| If **EMA 21 < EMA 50** | -1 |
| If **EMA 50 < EMA 100** | -1 |
| If **EMA 21 < EMA 100** | -1 |
---
### 3️⃣ **Bullish Confirmation** (Score ≥ 4)
- The **score is calculated every day**.
- When the **score reaches 4 or above**, it confirms a strong **bullish trend**.
- A **green background** is applied to highlight such days.
- A **histogram** is plotted **only when the score is 4 or higher** to keep the chart clean.
- A **buy signal** is generated when the score **crosses above 4**.
---
## **🔹 Visualization & Alerts**
### ✅ **What You See on the Chart**
1. **EMA Lines (21, 50, 100)** 📈
2. **Green Background for Strong Bullish Days (Score ≥ 4)** ✅
3. **Histogram Showing Score (Only for 4 and above)** 📊
4. **Buy Signal When Score Crosses Above 4** 💰
### 🔔 **Alerts**
- **An alert is triggered** when the score crosses **above 4**, notifying the user about a bullish trend.
---
## **📌 How to Use This Strategy**
1. **Identify Strong Bullish Trends:** When the score is **4 or above**, it suggests that price momentum is strong.
2. **Enter Trades on Buy Signals:** When the score **crosses above 4**, it could be a good time to buy.
3. **Stay in the Trade While Score is 4+:** The green background confirms a **strong uptrend**.
4. **Exit When Score Drops Below 4:** This suggests weakening momentum.
---
## **🔹 Advantages of This Strategy**
✅ **Simple & Objective** - Uses clear rules for trend confirmation
✅ **Filters Out Noise** - Only highlights strong bullish conditions
✅ **Works on Any Market** - Can be applied to stocks, indices, crypto, etc.
✅ **Customizable** - You can tweak EMAs or score conditions as needed
---
## **🚀 Next Steps**
Would you like me to add **stop-loss conditions**, **sell signals**, or any **extra confirmations like RSI or volume**? 😃
