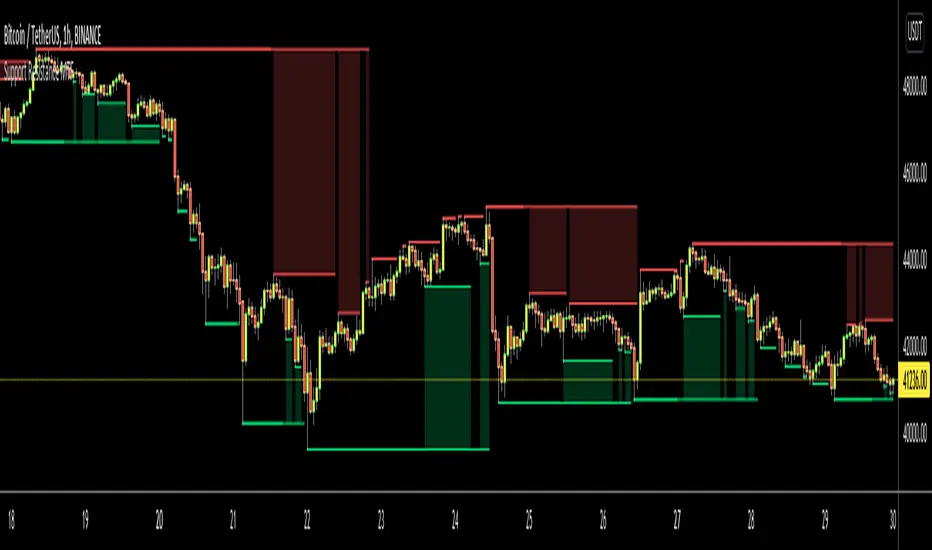
Support Resistance - Dynamic v2Hello Traders!
After the addition of "Arrays" to the Pine, I developed new and improved version of Support Resistance - Dynamic script as version 2. In this script Arrays were used. This can be used as Support Resistance tool, also it will be an example for the people who want to learn Array usage in Pine. Many thanks to Pine Team for adding Arrays!
The script finds the Pivot Points and check them in channels if there can be S/R or not, and draws mid line of the channel as S/R line. you can set number of PPs and channel width in the options. Each channel width is optimized dynamically according to Pivot Points. Also you can choose " High/Low " or " Close/Open " as source for Pivot Points.
There is an option for maximum number of S/R levels. S/R levels are found and sorted dynamically and number of S/R lines with enough strength changes dynamically.
Some other options for coloring and line width. (Solid, Dashed or Dotted)
S/R levels are shown in the Labels and Label colors are changed automatically, if S/R line is below the closing price then it's color is Green (as Support), otherwise its color is Red (as Resistance).
Examples:
Enjoy!
Pivot giornalieri

Trend Following with Moving AveragesHello Traders,
With the info "Trend is Your Friend ", you should not take position against the trend. This script checks multipte moving averages if they are above/below the closing price and try to find trend. The moving averages with the length 8, 13, 21, 34, 55, 89, 144, 233, 377 used. these are fibonacci numbers, but optionally you can change the lengths of each moving averages. while it's green you better take long positions, while it's red you better take short positions according to other indcators or tools.
Optionally you have "smoothing" option to get rid of whipsaws. it's enabled by default.
You have option to use following moving average types: EMA, SMA, RMA, WMA, VWMA. by default it's EMA
Also the script has "Resolution" option. with this option you can get the trend for other time frames, in following example 1h was set as for higher time frame on 15m chart:
This should not be used as buy/sell signal indicators as it's tries to find trend but not entry points, you should use other indicators (such RSI, Momentum) or other tools to find buy/sell signals.
Enjoy!

Support Resistance MTFHello Traders,
This is Support Resistance script that uses Multi Time Frame. While getting Close/Open/High/Low values of Higher Time Frames the script does NOT use Security function , instead it calculates them.
while choosing Higher Time Frame, you can use "Auto" option so it uses predefined Higher Time Frames, or you can choose the Higher Time Frame Manually from the list. options for HTF => 15mins, 30mins, 60mins, 120mins, 180mins, 240mins, 720mins, Day, Week, 2 Weeks, Months, 3 Months, 6 Months, 12 Months.
You have option to use High/Low or Close/Open values while calculating support resistance levels.
"Period for Highest/Lowest Bars" option is used as loopback period to check if it's Highest/lowest bars. smaller numbers = more sensitive result.
You have option for transparency and coloring of support/resistance levels/zone => Red, Lime, Blue, White, Black, Olive, Gray
An example for 15 min chart, 4hours selected as HTF
You can set transparency and colors as you wish:
You can choose Close/Open prices while calculating S/R levels instead of High/Low
Enjoy!
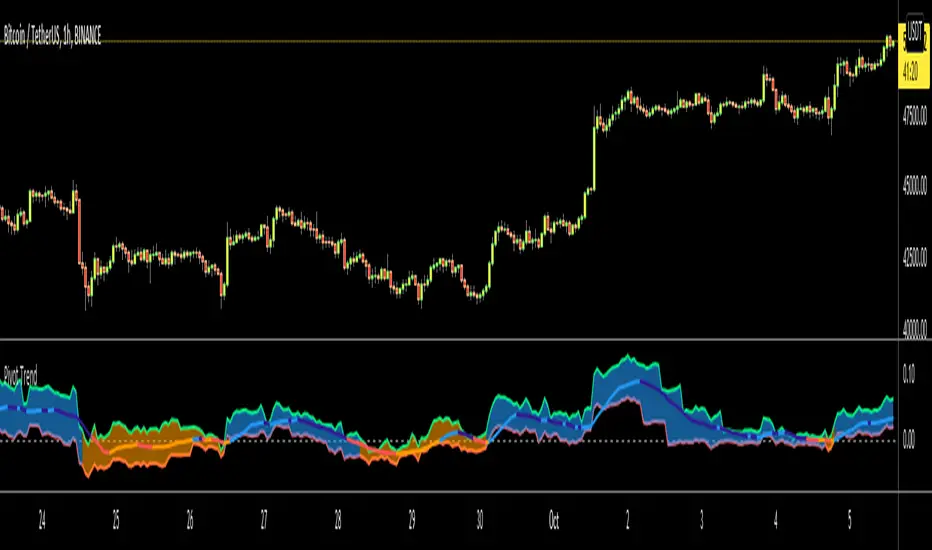
Pivot TrendHello Traders,
Another original idea is here with you. Actualy I can say that it's a breakout strategy that uses multiple Pivot Point's averages.
How it works?
- it finds the Pivot Points, you can set the length as you want
- it gets averages of Pivot Highs and Pivot Lows, you can set the number of Pivot Points to be included
- it compares the current closing price with averages of Pivot Highs and Pivot Lows
- if both are positive or negative then trend changes
You have two options:
- Pivot Point Period => is the length that is used to find Pivot Points. means it checks left/right bars if it's Pivot Point (4 by default)
- Number of PP to check => is the number of Pivot Points that the script finds and calculates the averages (3 by default)
An Example with the settings Pivot Point Period = 5 and Number of PP to check = 2
Play with settings as you wish. Comments are welcome, together we can improve it ;)
Enjoy!
(JS) Multi-Time Frame Pivot Point Detector 2.0So here's an updated version of my automatic Pivot Point detector.
If you don't like having a bunch of Pivots on your chart at once, or having to cycle through various resolutions to see different ones, this is for you!
What does this indicator do? It automatically detects the nearest daily, weekly, and monthly pivot points both above and below the current price and automatically plots them for you. It's really just as simple as that.
You select how far back you want it to plot with the "Pivot Point Look Back Period" option.
I also have transparency options for each type of pivot so its easy to find the opacity you prefer and save it as a default setting.
With "Turn Off Each Pivot Point On All Time Frames" turned on, as an example, if you were to uncheck "S1/R1" then it turns S1/R1 plots off across all 3 pivot resolutions. By default however, I have it set where you can pick and choose each one individually.
I also added the default "VWAP Periodic" script from TradingView in there with it (not in prior version). This works identical to the built in indicator (because it is identical).
Trading algorithms like to target pivot points and liquidity, so I figured they would pair together nicely for active trading.

Trend Following MAs 3DHello All,
This is Moving Averages Trend Following 3D indicator. The idea is based on direction of MAs and relation between 20 moving averages (5 to 100 period).
Option to show different type of MAs: EMA, SMA, RMA, WMA, VWMA.
As I haved tested it looks succesful at calculating trend direction and trend strength.
For a better look I tried to make it 3D, it looks good I think, waiting comments ;)
Some screenshots:
By using RMA type:
When it gets tiny it means there is no trend:
An example for down trend:
ENJOY!

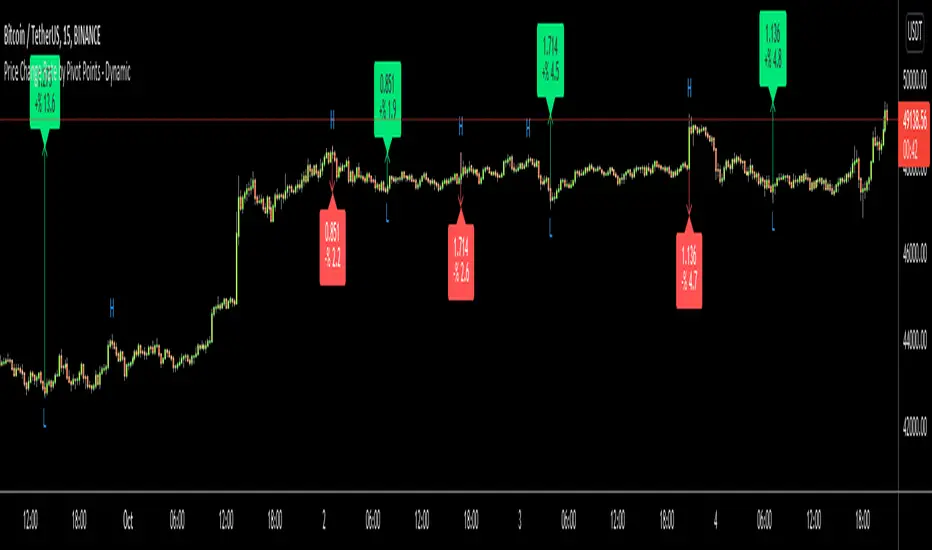
Price Change Rate by Pivot Points - DynamicHi Everyone
Usually I need Price Change info and I believe most of you need this info too. I want to see how it increased/decreased. I automate this by using Pivot Points.
it works dynamically and it uses Pivot Highs and Pivot Lows accordingly. That means it calculates which one to use.
Please watch following video:
Enjoy!
Pivot RSI - A trading strategy using Pivots Rel StrengthThis strategy uses a new concept called Relative Strength of Pivots.
The concept emanates from the fact that the market weakness starts from bottom to top when it comes to pivot as against top to bottom in conventional indicators.
It signals long if the daily pivot shows better strength than monthly pivots and short if the daily pivot shows weaker strength than monthly pivots.
The Strength of pivots is defined better if :
a) if relative strength of lower pivots are higher than higher pivots or crosses higher pivots.
b) if relative strength of lower pivots are sloping upwards and is above mid point (50).
This strength of pivots is combined with pivot shift indicator for additional confirmation which means that if pivot shift indicator is sloping upwards and the strength of pivots satisfies the above definition, then the long is signalled.
How to use this in trading?
The best way is to have this indicator along with the following
a) 50 period ema
b) 200 period ema
c) Daily CPR / Weekly pivot / monthly pivot (MUPS indicator preferred - Please refer to the same in public library)
d) Pivot Shift Indicator (IndianPivotBossPivotShiftIndicator - Please refer to the same in public library)
When a long is signalled, ensure that there are no immediate nearby resistances in the form of EMAs or Pivots. Similarly when a short is signalled, ensure that there are no immediate nearby supports in the form of EMAs or Pivots.
In other words when a long is signalled and if there is a nearby resistance, just wait for the resistance to break convincingly before going long and vice versa for shorts.
In general a blue color indicates that the strength of daily pivot is better alongwith a bullish pivotshift which facilitates a possible long and HENCE STRICTLY SHOULD NOT BE ON THE SHORT SIDE.
In general a red color indicates that the strength of daily pivot is better alongwith a bearish pivotshift which facilitates a possible short and HENCE STRICTLY SHOULD NOT BE ON THE LONG SIDE.
Please ensure that you use this with a proper Risk Management and Money Management guidelines.

Divergence for many indicator v3Hello Everyone. Almost one year later, with Pine version 4, I developed new version of the Divergence for many Indicator.
It analyses divergences for 10 predefined indicators and then draws line on the graph. Red for negatif divergence (means prices may go down or trend reversal), Lime for positive divergences (means prices may go up or trend reversal)
Divergences version 2 has latency because it waits higher time frame completion. in this new version the script uses Pivot Points and on every bar it checks divergence between last Pivot point and current bar and if it finds any then immediately draws line and removes old one. so there is no latency with this version.
There are predefined 10 indicators in the script, you have option to choose which indicators the script would analyse for divergence. (RSI , MACD , MACD Histogram, Stochastic , CCI , Momentum, OBV, Diosc, VWMACD and CMF)
In replay mode you can see how the script puts new divergence line and removes old one. you better see it for yourself by using replay mode.
Hope you Enjoy!

Trend LinesHello Everyone! This is my new trend lines script (after beta version that was published almost one year ago)
The idea is to find Pivot Highs (PH) and Pivot Lows(PL) first.
Then, If current PH is smaller then previous PH (means no new higher high and possible downtrend) then draw trend line using them. and also it checks previous trend line (if exits) and if current angle is smaller then don't extend previous one.
Same idea when using Pivot Lows, If current PL is higher then previous PL (means no new lower low and possible uptrend) then draw trend line using them. and also it checks previous trend line (if exits) and if current angle is smaller then don't extend previous one.
Optionally style of old trend lines drawn as dashed.
Hope you enjoy it!

Neru_MultiPivots_ForDarkThemeNeru_MultiPivots_ForDarkTheme
________________________________
This script is plotting the classic PivotPoints into the charts, two for each interval.
These Pivots are adjusting automatically when you change the interval.
The following are supported:
1, 3, 5, 15: H4 Pivots R5-S5
5, 15, 30, 60, H2: Daily Pivots R5-S5
30, 60, H2, H3, H4, H6: Weekly Pivots R4-S4
H3, H4, H6, D: Monthly Pivots R3-S3
D, 2D, 3D, W, 2W: Quarterly Pivots R3-S3
2D, 3D, W, 2W, M, 3M: Yearly Pivots R2-S2
You cannot change these settings, but disable them seperately.
This is a universal indicator and appropriate to use in any market, due to the fact classic calculations are used.
Additional: You are able to set alerts onto single Pivots OR an entire interval.
There is also a version for light themes: Neru_MultiPivots_ForLightTheme (simply search in indicator´s library)
_________________________________
Warm regards,
Neru

Higher High Lower Low Strategy (With Source Code)This script finds pivot highs and pivot lows then calculates higher highs & lower lows. And also it calculates support/resistance by using HH-HL-LL-LH points.
Generally HH and HL shows up-trend, LL and LH shows down-trend.
If price breaks resistance levels it means the trend is up or if price breaks support level it means the trend is down, so the script changes bar color blue or black. if there is up-trend then bar color is blue, or if down-trend then bar color is black. also as you can see support and resistance levels change dynamically.
If you use smaller numbers for left/right bars then it will be more sensitive.
source code of :

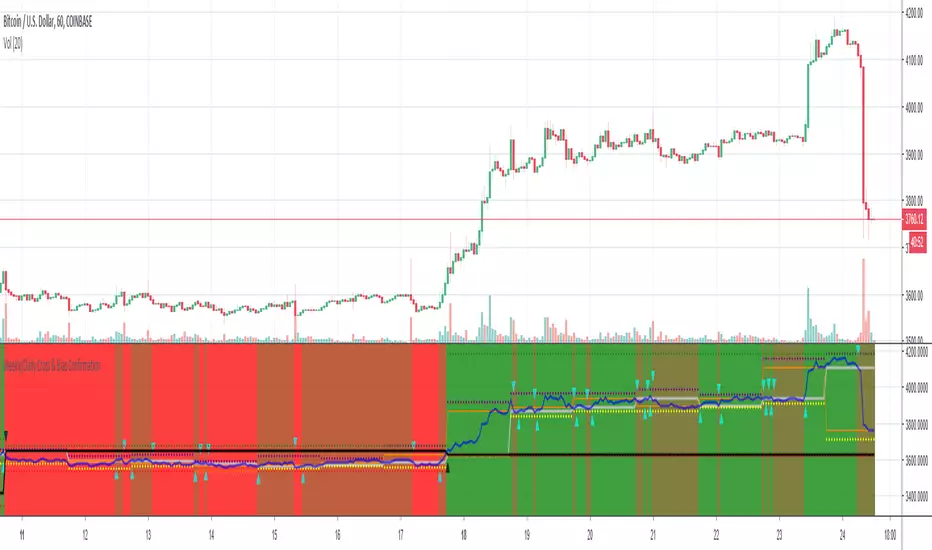
Weekly/Daily Cross & Bias ConfirmationThis indicator plots the weekly and daily open in addition to a current close price line.
It also signals when price closes above or below the daily and weekly opens.
Also, the bull/bear bias is painted on this indicator as well.
Black is the weekly open
Silver is the daily open
Weekly is default black arrows. Up is going above open, down is going below
Daily is default aqua arrows. Up is going above, down is going below
Dane: RSI MACD StrategyRSI / MACD Divergence Strategy . Published for customer verification and acceptance. Unfortunately, access can only be provided to the customer.
For those interested in custom development services, please visit the backtest-rookies (.com) website for more information.
Features
RSI & Price divergence detection
Open a trade window when trade conditions are met
Enter the trade on confirmation
Stop losses / take profit custom levels based of daily pivot values
