IOFin F-Score by zdmre🗣The IOFin F-Score is a discrete score between zero and ten that reflects ten criteria used to determine the strength of a firm's financial position.
🗣It is used to determine the best value stocks, with ten being the best and zero being the worst.
The IOFin F-Score broken down into the following categories:
Profitability
Equity, cash flow, liquidity, and source of funds
Operating efficiency
Criteria Include:
Price to book (P/B) lower than 3 (1 point)
Debt to Equity (D/E) lower than 0.5 (1 point)
Price to FreeCashFlow (P/FCF) equal to or lower than 20 (1 point)
Peg Ratio lower than 1 (1 point)
Sustainable Growth Rate higher than 0.3 (1 point)
Return on Assets (ROIC) higher than 0.07 (1 point)
Return on Equity (ROE) higher than 0.3 (1 point)
EnterpriseValue/Ebitda lower than 10 (1 point)
Quick Ratio equal to or higher than 1 (1 point)
Operating Margin higher than 0.15 (1 point)
Debt

Financial MetricsGives a sneak peak into some of the important financial ratios described below:
1. P/E : price to earnings ratio (Green when P/E<15)
2. PEG: Price to earnings growth ratio (Green when PEG<1)
3. P/S: Price to sales ratio (Green when P/S<2)
4. EV/FCF: Enterprise Value to Free Cashflow ratio
5. OPM: Operating Profit Margin % (Green when OPM>15%)
6. D/E: Debt to equity ratio (Green when D/E<1)
7. ROE: Return on equity % (Green when ROE>15%)
8. Div_Yield: Dividend yield
Disclaimer: All the limits defined are based on the widely accepted general values, but are subjective to particular sector or group of stocks. For example IT stocks command higher valuation than cyclical stocks like metal. So Compare with other stocks of the same sector to reach any conclusion.

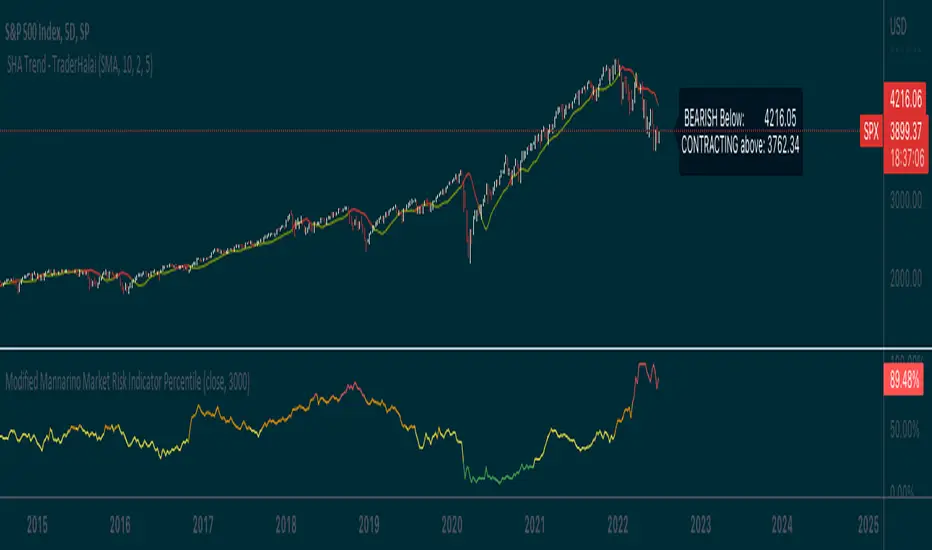
Modified Mannarino Market Risk IndicatorThis indicator is meant to give an overall indication of risk and a very basic implementation of the modified mannarino market risk indicator. I take no credit for the original formula, and just decided to hack this together so that it could be useful to the community
Silen's Financials Fair ValueIt is finally here! 🔥 My 3rd and most important script in my Financial series! 🚀
Ever imagined to see all fundamentals (or many that is) combined into one indicator that is right on your chart, showing you how your favorite stock is trading compared to its fundamentals?
Well, here is your answer! 📡
____________________________________________________________________________________________
This script shows you my own personal interpretation of fair value, based solely on the financial fundamentals of a company compared to market averages.
I don't believe that certain sectors of the market should be priced higher than others. If you look at historical data you'll see that favored sectors always rotate - placing insanely high P/E multiples on some sectors. Once they are "out" and people rotate away from those sectors you're left with nothing but the naked fundamentals that matter. So, you'll see many companies, that have been doing well on paper, see their share price decline by 70-90% for no other reasons than people favoring other sectors.
That's why it's even more important to focus on fair value that is solely fundamentals-based. Know when your stock gets to expensive. 🤯
____________________________________________________________________________________________
To give you some examples:
- Most Megacaps trade at historically high valuations, several times my fair value. Those include AAPL, MSFT, NVDA, AMZN, TSLA, JPM, TSM, V and so on. And no, in the past they partially traded below (my) fair value.
- Most Cybersecurity / Cloud companies are trading at truly massive multiples of my fair value. (NET, DDOG, etc)
- Many Smallcaps & Midcaps are trading several multiples (OESX, CODX, QFIN) below my fair value. And no, in the past they partially traded above (my) fair value.
Ok, so much about the market. You ultimately decide how much you want to orientate on fair value. 👨🏫
____________________________________________________________________________________________
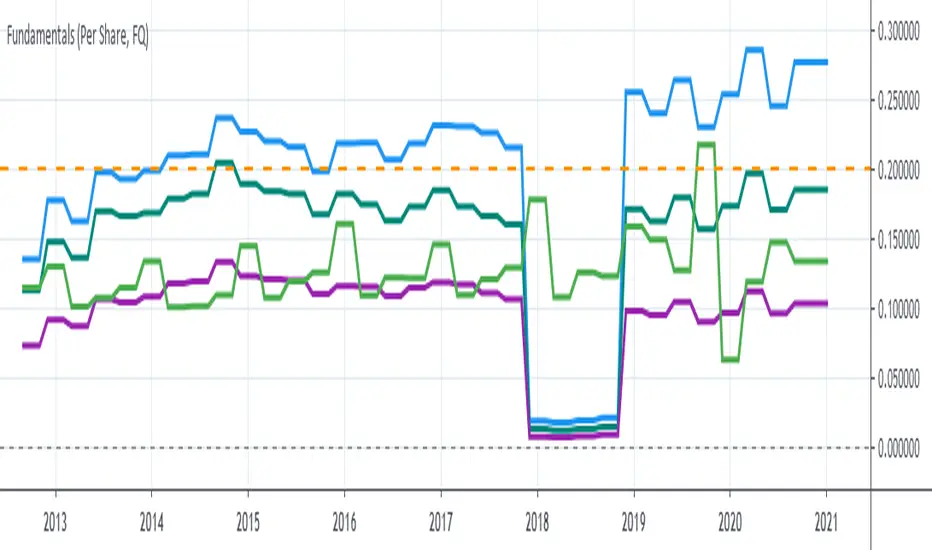
This fair value indicator (purple line):
Takes the P/E rate of the company and compares it to the market (50% weight)
Takes the P/S rate of the company and compares it to the market (50% weight)
Then adds boni and mali f or debt/equity rates and debt and equity itself
Also looks at past growth and calculates future P/E and P/S rates which adds , in some cases, value to the fair value (green line)
Also compares how historical valuations have behaved compared to fair value and simulates a fair value guideline (dark blue line)
____________________________________________________________________________________________
This script is part 3️⃣ of a series of indicators that work well together.
Script 1️⃣ of the series is:
P/E & P/S Rates
Script 2️⃣ of the series is:
Debt & Equity
If you use all 3 scripts together it will look like this, giving you truly deep and simple information about the fundamentals of a company:
Example 1 - AMD
Example 2 - HZO
Example 3 - APPS
I hope this script makes your investing and stock picks a lot easier! 🔆💹🕗
Disclaimer: Fair value is always subjective. There are many different approaches to fair value. This one is only my personal interpretation.
Disclaimer 2: This script works only for the Day-Timeframe.
Disclaimer 3: This script uses 17,5 P/E and 3,0 P/S as market averages. The actual average keeps changing but, historically speaking, these seemed to be good numbers.
Feel free to share your thoughts and feedback! 🙃

Silen's Financials Debt & EquityThis Script shows Debt (red) & Equity (green), as well as Total Equity and Net Income in a preformatted way for a symbol. Total revenue's and Net income's visibility is turned off by default and can be activated in the indicator settings. 🍳
Disclaimer: Any content in this script can be completely replicated by using Tradingview's Build-In Financial Indicators: Total debt, Total equity, Net income and Total revenue. It requires a lot of formatting work to get them to this state though. 👌
However, you are going to need 4 Financial Indicators clogging 🚽 your screen. With this indicator you have them preformatted as an overlay on your chart so you know exactly what's going on with your ticker's financials. 💰
I recommend only using Debt & Equity OR Total Equity & Net Income together. Although displaying all 4 indicators together is possible, it will make your chart quite messy.
This is how the indicator looks like for Total equity and Net Income:
This Script (2) is part of a Series that will contain 3 scripts to help you easily evaluate if a stock is trading in harmony with its fundamentals or not. ☯
Script 1 already exists:
Script 3 will be a Fair Value Indicator. 📣
Script 1 and 2 combined will look like this: 🌄
If you have any questions, let me know! 🙂

P1 FundamentalsP1 is because to me, this is a priority 1 indicator, so I have P1 and P2 indicators ordered on the favorite list.
What can you check on the selection pane?
On “period”, you can show the data related to:
the fiscal quarters
or the fiscal years.
You can select a pack of financial data that I have organized in sections:
Revenue & earnings
EPS & DPS (EPS, EPS estimate, DPS and dividend payout ratio )
Debt (total debt, total equity and cash & equivalents)
Returns (ROE, ROIC, ROA and R&D revenue to ratio)
I recommend to just select one of them, in other case the chart is a mess.
Any feedback on the code is welcome!!