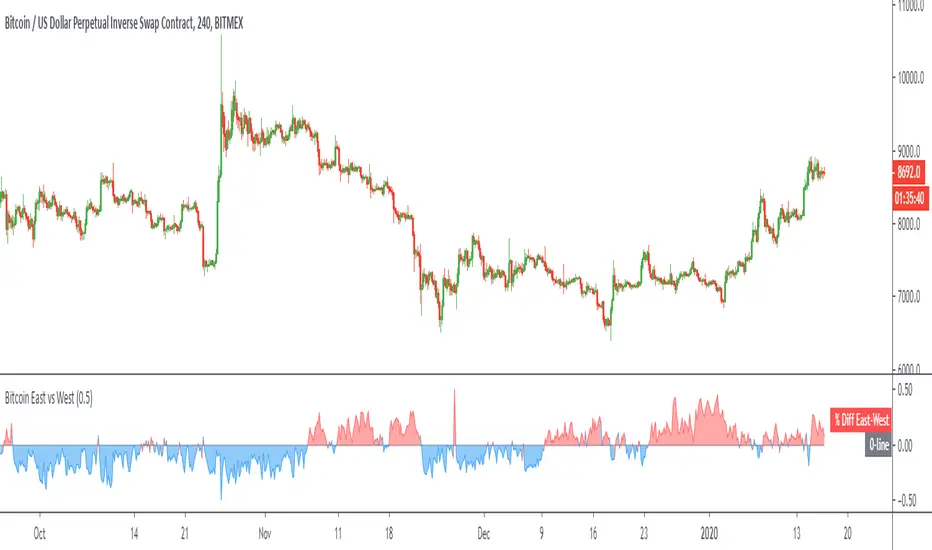
Bitcoin East vs WestPlots the volume weighted price difference between the top spot exchanges in the "East" (Asian markets) versus the "West" (US/UK/EU markets).
Optional: view the volume difference between the two.
Difference
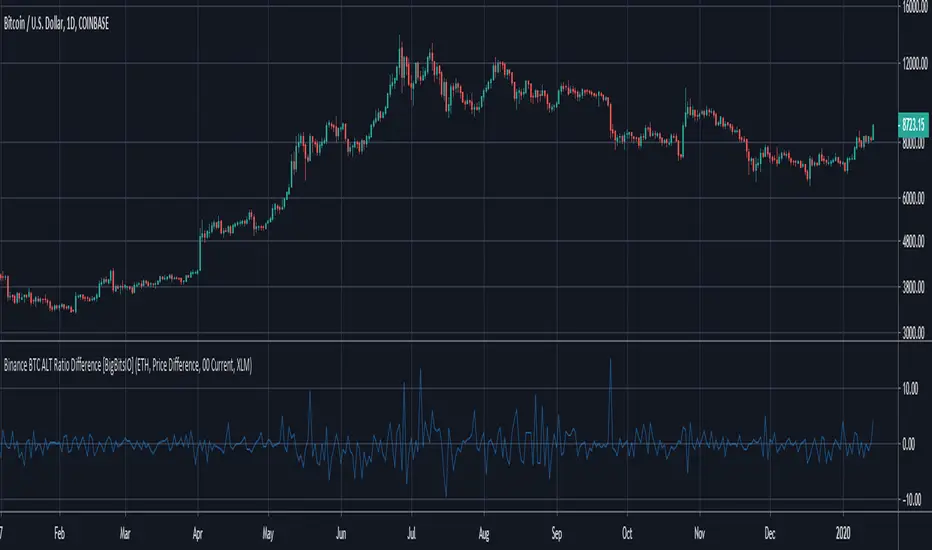
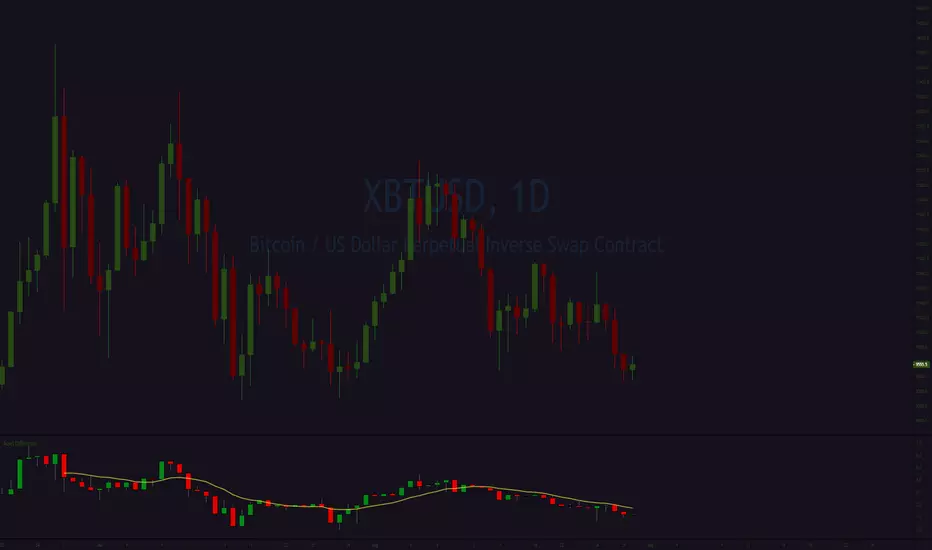
Binance BTC ALT Ratio Difference [BigBitsIO]This was a follower suggested script. This script compares the USDT and BTC relative prices of a particular altcoin traded on Binance by calculating it's USDT price comparative to BTC. This is a very simple calculation (ALT/USDT price divided by ALT/BTC price). From there, we simply subtract the BTC/USDT price from the ALT ration price and we can see if a coin is trading comparatively high or low compared to it's BTC relative price.
This indicator may or may not be useful for you. However, for the purposes of my development series for indicators, I have published it to highlight the ability to concatenate strings to manipulate securities.
Features:
- Dropdown to choose from several built-in altcoin selections.
- Dropdown to choose to show a USDT base difference in the ratio, or a percentage based difference (might be useful for considering fees).
- Dropdown to choose the resolution of the indicator.
- Checkbox to toggle the option to use a custom altcoin.
- Text input to allow entry of a custom altcoin from Binance. Please only use the prefix on its trading pair vs. BTC. I cannot guarantee this will work with all altcoins. They must be traded vs. USDT and BTC on Binance.
- Concatenated strings to manipulate selected securities.
*** DISCLAIMER: For educational and entertainment purposes only. Nothing in this content should be interpreted as financial advice or a recommendation to buy or sell any sort of security or investment including all types of crypto. DYOR, TYOB. ***
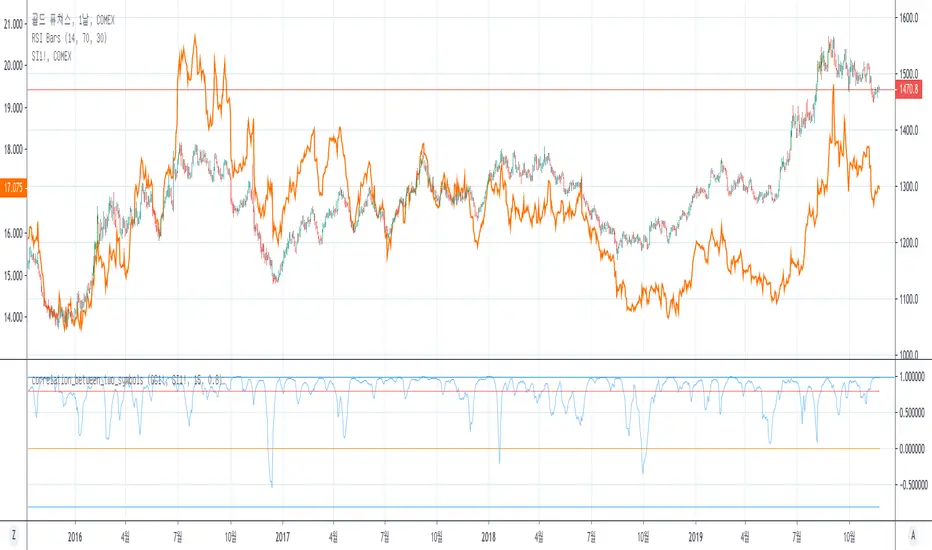
correlation_between_two_symbolsCorrelation between two symbols.
Notice: you can find more useful indicators by searching 'between_two_symbols'
Crypto - Candle Price Info PanelInfo Panel that displays difference in percentages between current candle open value and highest/lowest wick values in past "X" number of candles
Quickly glance at a simple and recent price action range. Due to displayed difference in percentages more useful on Crypto, stocks etc. than Forex
Put together as a learning project with help, code and advice from @jhanson107, @Zekis.

Forex - Candle Price Info PanelInfo Panel that displays difference in ticks between current candle open value and highest/lowest wick values in past "X" number of candles
Quickly glance at a simple and recent price action range.
Put together as a learning project with help, code and advice from @jhanson107, @Zekis.

SpreadTrade - Distance (ps4 ver. 2)This script implements a rebrushed distance-based pair trading strategy. In this strategy, normally they trade the difference between the prices of two instruments. This difference is also called spread. Here, however we’ll trade the difference between two time frames of one instrument. And that's the main trick. Common procedure consists of the following steps:
1. Select two CORRELATED stocks. Here we'll use the same instrument in different TFs.
2. Generate the spread by calculating the difference between the prices/instruments. For distance based pair trading, we need to (rescale the data first and then) check the distance between them.
3. Define the logic to trade the spread and generate the trading signals. In this example we’ll calculate the rolling mean and rolling standard deviation of the spread. Whenever the spread goes above a rolling mean by one standard deviation, we’ll short the spread expecting the mean reversion behavior to hold true. And whenever the spread goes below its rolling mean by one standard deviation, we’ll go long on the spread.
Mind that the meaning of the orange and blue signals depends on whether tf variable is smaller or larger than the built-in timeframe.multiplier variable, i.e. tf of the chart.
For details see analyticsprofile.com
Donate: PayPal (paypal.me)

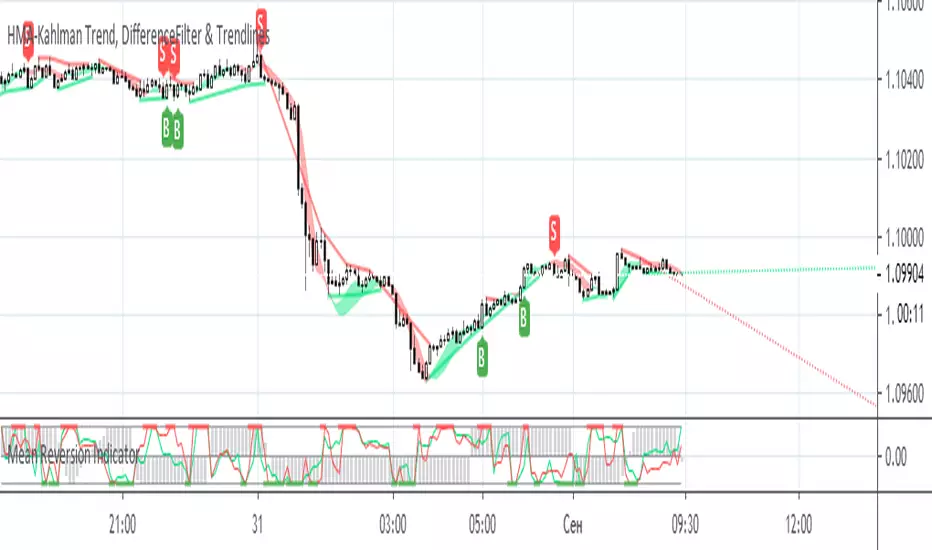
HMA-Kahlman Trend, DifferenceFilter & TrendlinesThis update to the previous HMA-Kahlman Trend, Clipping & Trendlines script features the same structure with the three modules:
- Trendlines module,
- NEW Winsorizing submodule using difference-based filtering.
- HMA-Kahlman Trend module.
The Winsorizing submodule filters signals by a volume level, eliminating the ones with the volume below a threshold. This module substitutes the previous 'low-level' filtering implementation. This time it filters out based on difference between scaled volume and its moving average.
Tested with BTCUSD.
Logistic Difference (ps4)This is an PS4 update to the Logistic Difference Indicator. It uses logistic function (sigmoid), which stabilizes the variance of data. The logistic function resembles the inverse Fisher transform. This version has a repaint/non-repaint switch and a scaling feature.

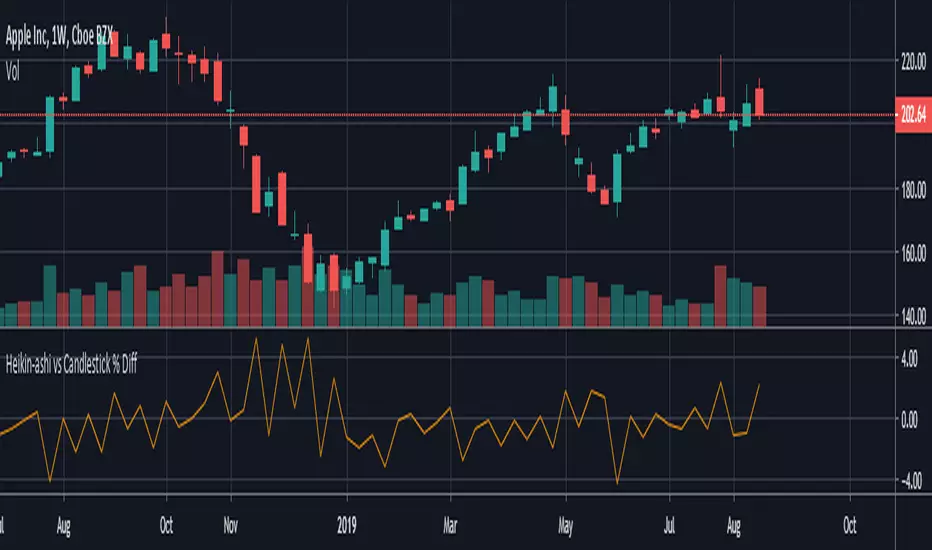
HeikinAshi - Candlestick % Difference This script shows the price difference ( %) between heikin ashi and candlestick for all investment instruments as Close, Open, High and Low. (Switchable )
In this way, you can see which instruments can easily use heikin ashi .
And by taking averages you can find the opportunity to compare which investment tools are more risk-free.


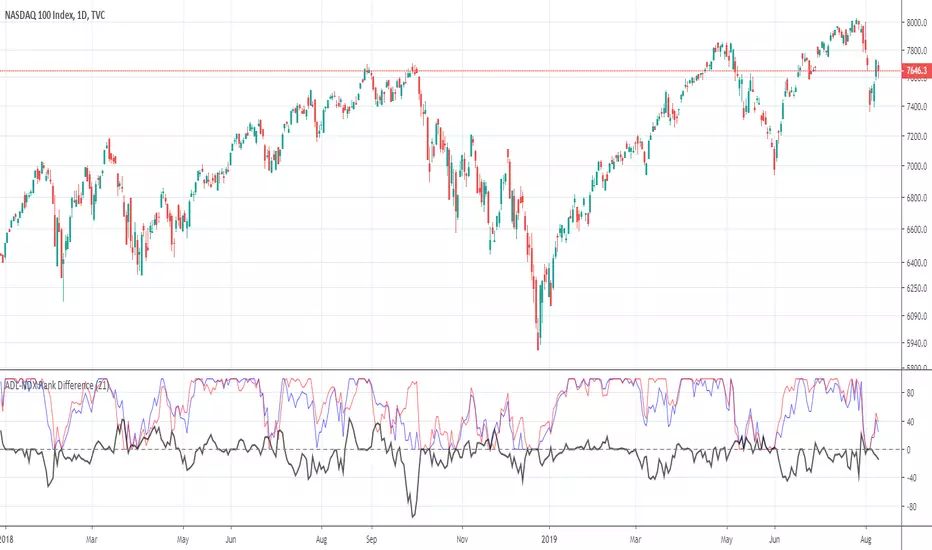
ADL-NDX Rank Difference-Buschi
English:
An expansion of the Advance Decline Line of the NASDAQ. It can be interesting to compare the Advance Decline Line with the corresponding benchmark index. I therefore made a ranking (0 to 100) based on the performance over the last days (default: 21 days). The difference is the target figure and ranges between -100 (bearish divergence) to +100 (bullish divergence).
Deutsch:
Eine Erweiterung der Advance Decline Line der NASDAQ. Oft möchte man den Verlauf der Advance Decline Line mit dem zugehörigen Leitindex vergleichen. Daher habe ich für beide ein Ranking (0 bis 100) erstellt auf Basis des Verlaufs über die letzten Tage (Standardwert: 21 Tage). Die Differenz stellt dabei die Zielgröße dar und schwankt zwischen -100 (bärische Divergenz) und +100 (bullische Divergenz).
ADL-SPX Rank Difference-Buschi
English:
An expansion of the Advance Decline Line of the NYSE. It can be interesting to compare the Advance Decline Line with the corresponding benchmark index. I therefore made a ranking (0 to 100) based on the performance over the last days (default: 21 days). The difference is the target figure and ranges between -100 (bearish divergence) to +100 (bullish divergence).
Deutsch:
Eine Erweiterung der Advance Decline Line der NYSE. Oft möchte man den Verlauf der Advance Decline Line mit dem zugehörigen Leitindex vergleichen. Daher habe ich für beide ein Ranking (0 bis 100) erstellt auf Basis des Verlaufs über die letzten Tage (Standardwert: 21 Tage). Die Differenz stellt dabei die Zielgröße dar und schwankt zwischen -100 (bärische Divergenz) und +100 (bullische Divergenz).

Difference in 2 Moving Averages (Oscillator)This is a simple script that takes 2 moving averages and calculates the difference between them.
Line1 - Line 2 = plot
I've made it so the numbers shown are in pips. this doesn't work for crypto because what is a pip in crypto?

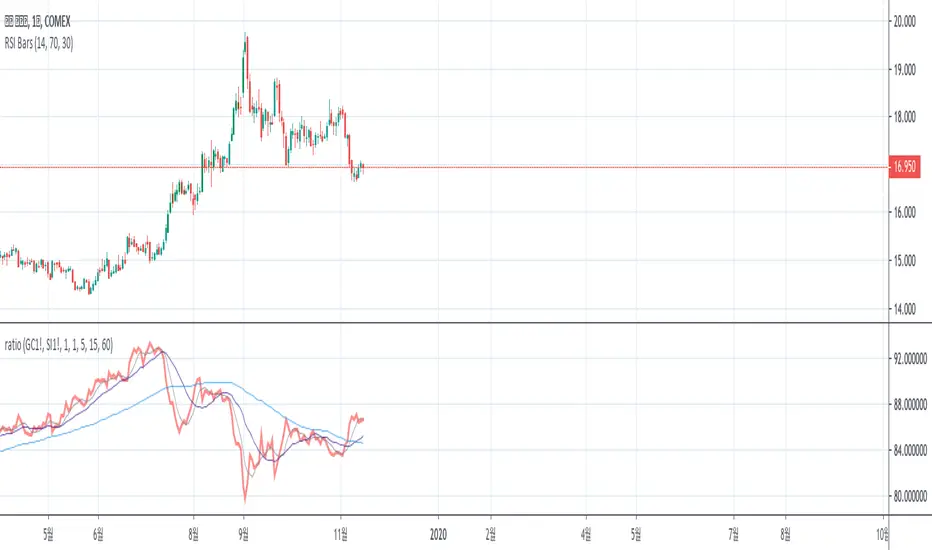
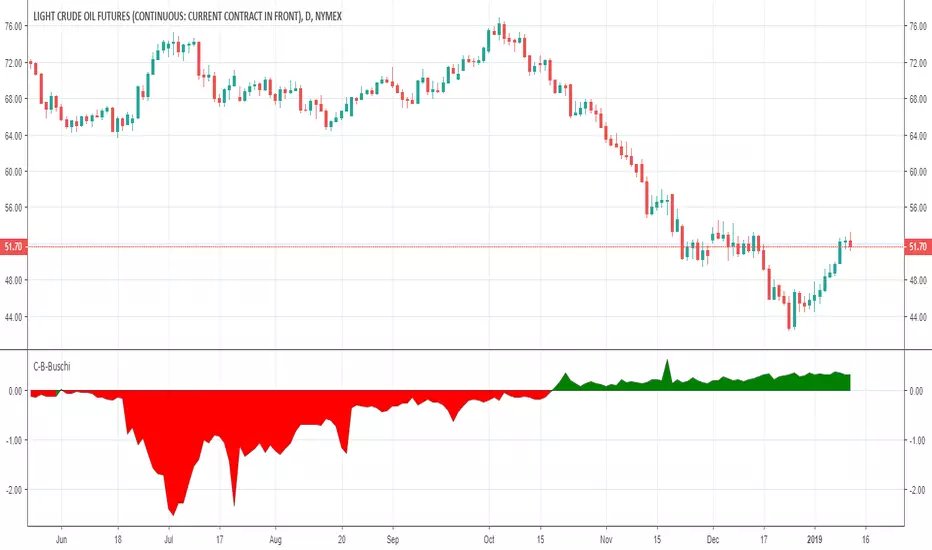
Contango-Backwardation-Buschi
English:
This script shows the difference between a future's continuous current contract (e. g. CL1!) and the continuous next contract (e. g. CL2!). Normally, the next contract is more expensive ("Contango" - shown in green). If the next contract is cheaper, the difference is negative ("Backwardation" - shown in red).
A change between Contango and Backwardation often corresponds with stronger price changes.
Deutsch:
Dieses Skript zeigt den Unterschied zwischen dem kontinuierlichen aktuellem Kontrakt eines Futures (z. B. CL1!) und dem kontinuierlichen Folgekontrakt (z. B. CL2!). Im Normalfall ist der Folgekontrakt teurer ("Contango" - angezeigt in grün). Wenn der Folgekontrakt billiger ist, ist die Differenz negativ ("Backwardation" - angezeigt in rot).
Ein Wechsel zwischen Contango und Backwardation korrespondiert häufig mit größeren Preisänderungen.
Symbol Difference-Buschi
English:
It's a very simple script to calculate the difference of the closing values of two symbols (symbol 1 - symbol 2).
Default values are AAPL vs. MSFT .
Deutsch:
Das ist ein sehr einfaches Skript, das die Differenz zweier Werte darstellt (Symbol 1 - Symbol 2).
Standardwerte sind AAPL vs. MSFT.

inwCoin Price Diff AlertJust simple alert script to compare candle with current candle for price change with leverage.

DEMA PRICE DİFFERENCE Strategy Strategy based on DPD indicator , price crossover the lower line , it means BUY signal. Price crossunder the upper line,it means SELL signal.
For @dpanday

Percent difference between price and MA Backtest Percent difference between price and MA
You can change long to short in the Input Settings
WARNING:
- For purpose educate only
- This script to change bars colors.

Percent difference between price and MA Strategy Percent difference between price and MA Strategy
WARNING:
- This script to change bars colors.

Price and EMA Difference Customizable [Requested script]
Easy options, you can toggle the lines and other things. Even turn of the histogram.
