CoinExpert TrendTrend Analysis, shows clear direction of the market
Includes automatic Zig-Zag tracement to show reversals coming up & also has a refined version of different variants of MA's to show really strong support/resistance channels.
Combined with CoinExpert Oscillator and CoinExpert Overlay it is possibly the best trading tool up to now.
This is not an indicator, this is a WINdicator!
For access and prices, add me on Discord, Amnesio#0001 or message me here, on Tradingview.
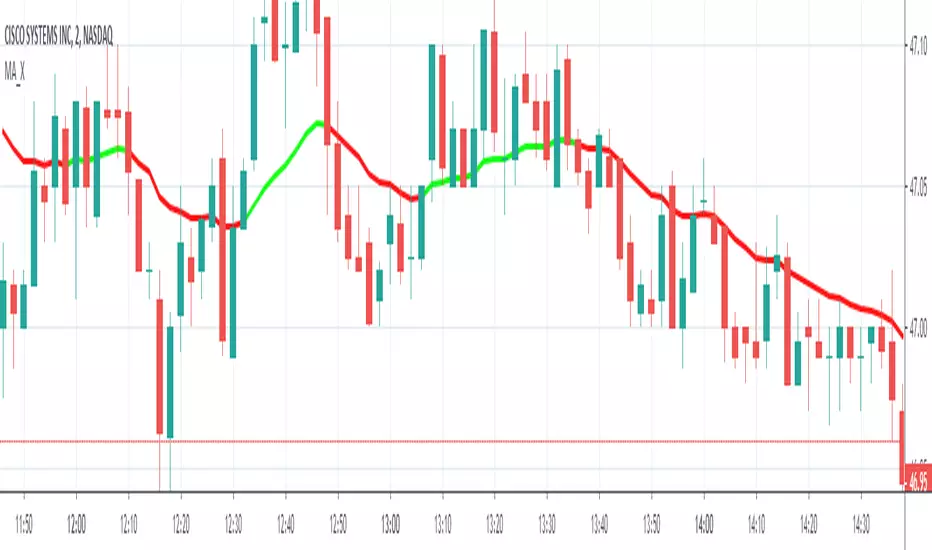
Direction

2 Moving Average Color Direction Detection 2 Moving Average Color Direction Detection, possibility to configure:
- Type: SMA , EMA , WMA , VWMA , SMMA , DEMA , TEMA , HULLMA, ZEMA, TMA, SSMA
- Lenght
- Source
- Color direction

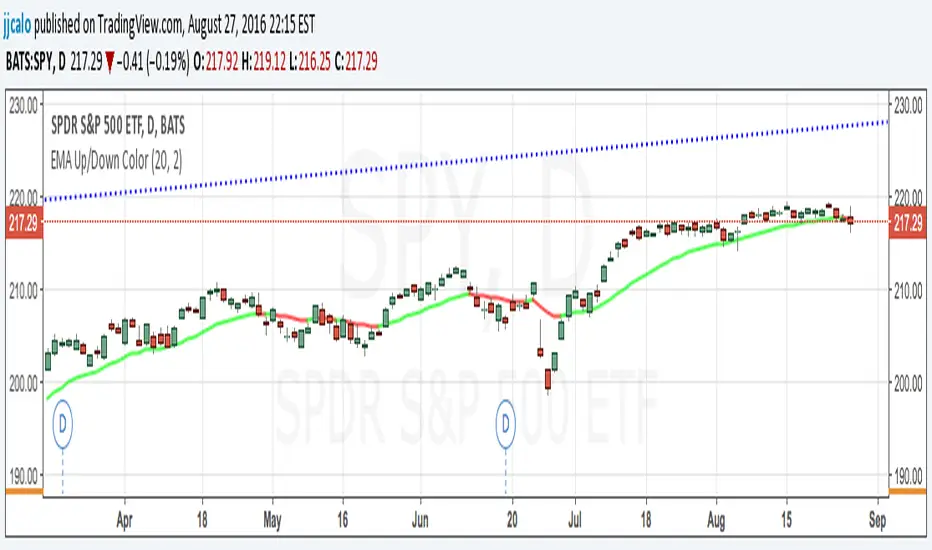
Moving Average Color Direction Detection Moving Average Color Direction Detection, possibility to configure:
- Type: SMA, EMA, WMA, VWMA, SMMA, DEMA, TEMA, HULLMA, ZEMA, TMA, SSMA
- Lenght
- Source
- Colour direction
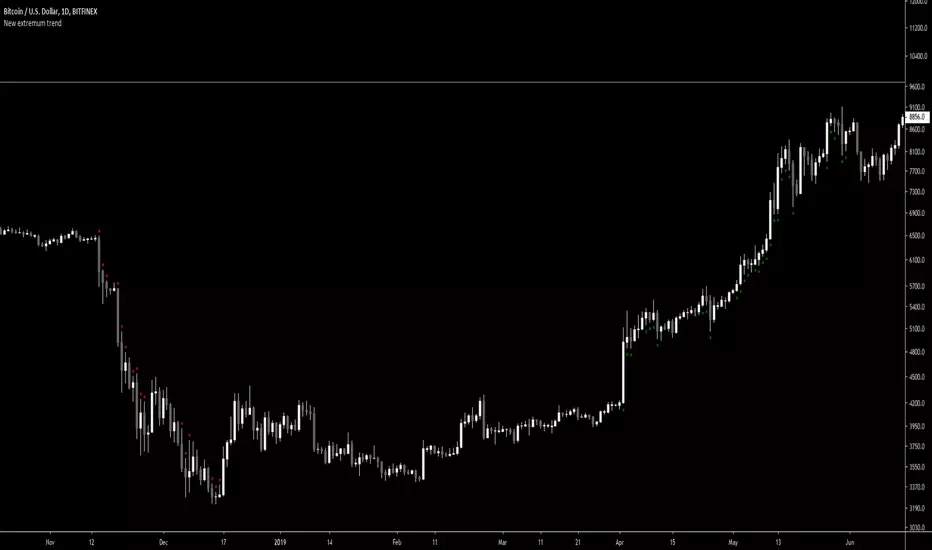
New extremum trendScript for filtering out periods when market is not trending.
It defines downtrend as following:
Lowest price of last 2 days is equal or lower then lowest price of last 100 days.
Values 2 and 100 are customizable.
Uptrend analogically with highs.
Trader Set - Volume TrendThis is a little GIFT from me to the community.
It uses one of the volume candle subtype formulas to define if there is a trend in the market or not.
Keep in mind that this script uses security on 60 minute (hourly) time frame, so, fundamentally it can have little repaint but as long as you don't update your charts, there shouldn't be any problem and even with chart update and refreshing, the chance for a repaint is really small.
Also, because this uses 60 minute time frame to determine if there is a trend or not, you can't use it on time frames higher than hourly charts, even on hourly chart it's not acceptable for most conditions. but on minute charts, it should be a nice helper to show "possible" direction of the market.
Remember, as many indicators, this just INDICATES a suggestion and it's not written on hard stone.
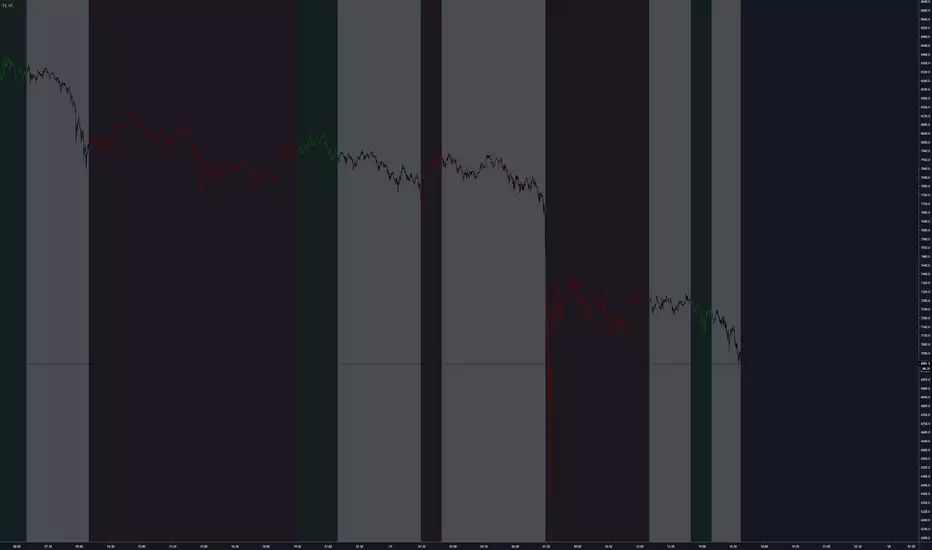
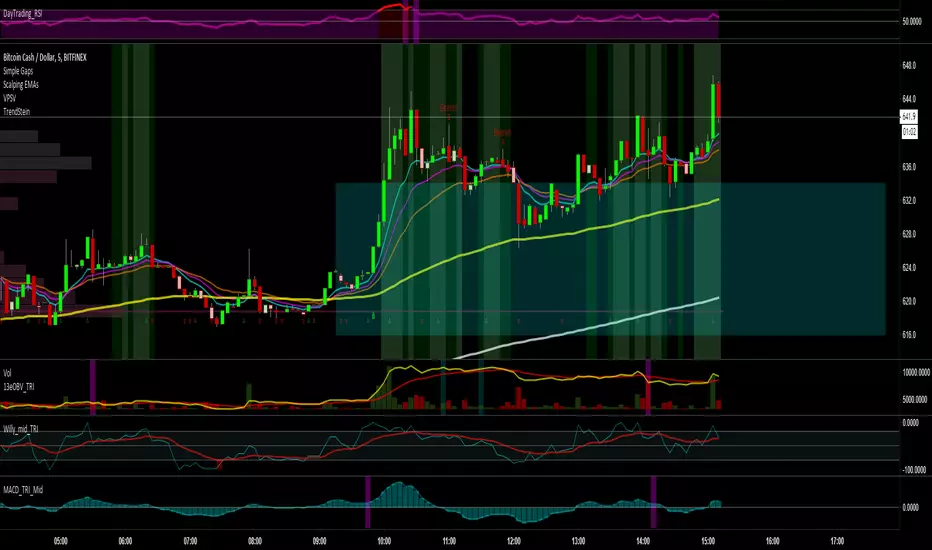
TrendSteinColors the background based on the current trend.
How to use:
- green background - hunt for long setups
- red background - hunt for shorts
Bitfinex dominion V2With this indicator you can check the current tendency of a crypto pair from Bitfinex.
It will tell if the market is in bullish or bearish mode.
That can be an extra layer of analysis to make your decision.
You will see it will swap from red, dark red to green or dark green. The more bright the color is, the more you will see the tendency is strong.
PS: Take in consideration this indicator doesn't follow the price shown by tradingview. So it's not useful at all to decide to go LONG or SHORT based on what this indicator shows and what tradingview price ( candlestick ) shows. It's more a market direction indicator...

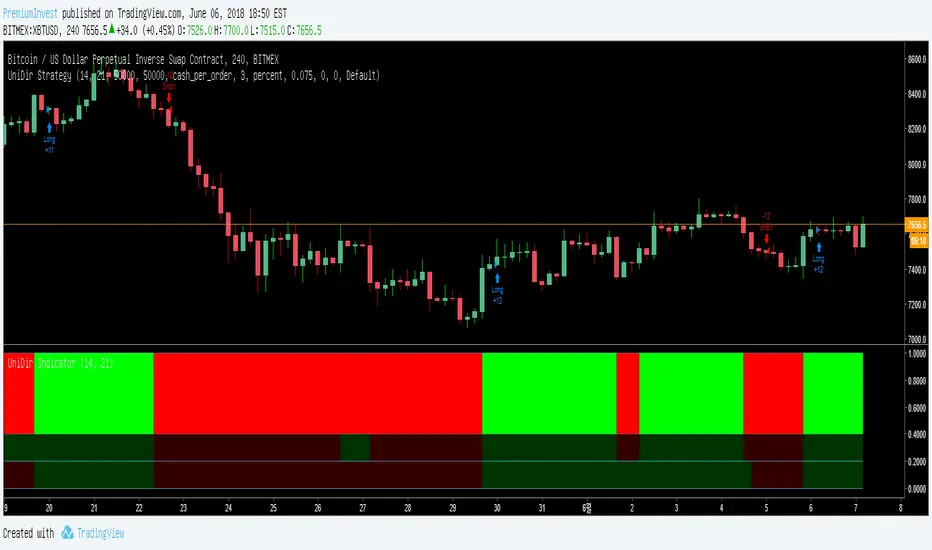
VFilterAlthough this script is inspired by the design of Elder Impulse script created by LazyBear, the engine is not the same.
The goal of this indicator is to filter price movement, establish direction, and manage risk. This indicator is not be used on its own, its only to be used to help establish entrys and exits.
The signals are created using a privately developed moving average on multiple time frames.
HOW TO
15, 60, 120, or 240 min chart
Green = Buy signal
Red = Sell signal
Blue = Bullish consolidation, or an aggressive/riskier buy signal
Yellow = Bearish consolidation. or an aggressive/riskier sell signal
Adjustment value is high due to the nature of the moving averages. Try using 400, 700, 900, or 950 for best results.
I suggest using this indicator with MACD and a levels indicator for price targets.

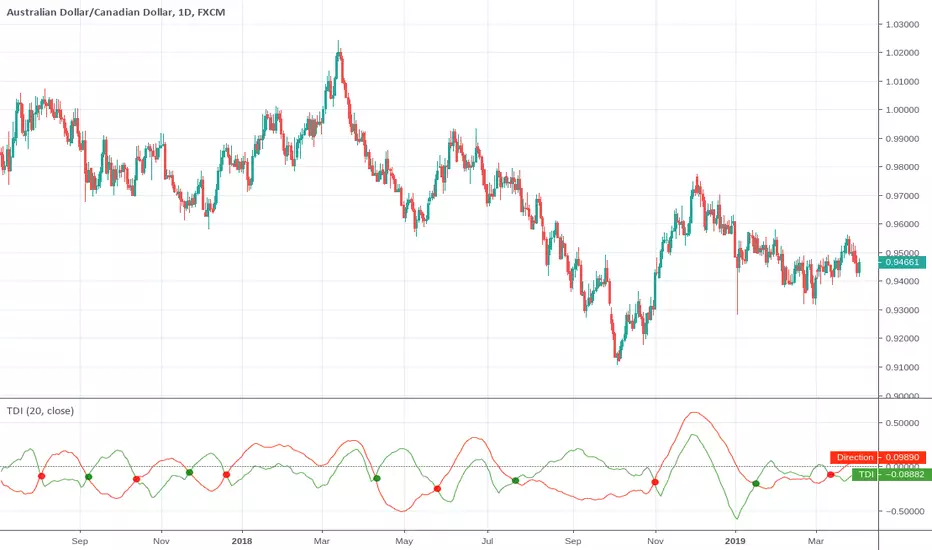
Trend Detection IndexTrend Detection Index indicator script.
This indicator was originally developed by M.H. Pee (Stocks & Commodities V. 19:10 (54-61): Trend Detection Index).
Bitfinex dominionThis indicator will show you which gang is dominating the market : the bearish gang (short masters),
or the bullish gang (long masters).
The bearish gang is drawn in red and the Bullish one is in green color.
If red is above green, that means we have a bearish tendency on the market.
if green goes above red, that means the market is going the bullish way.
It's nice to use it on 1H or 30 minutes intervals.
Here's what I do : When the dominion is changing hands (=a shift in color), then that mean the market
is moving in another direction. I then use my other indicators to make a decision so to create a trade
at the very moment of the dominance change or not...
NB1: make sure you know what you do before using this "what I do" strategy. It can be not suited to
everyone. Trading is a risky business. So don't take words as granted from people like me or others.
The best thing to do is : testing,testing then re-testing while having a good money management.
I've burnt myself many times before.
NB2: Margin trading can be really risky if you use this "what I do" strategy. Because price can go far in
counter direction before getting back to our target price. So you can risk a margin call. So it's better
using this "what I do" strategy on market trading only.

B3 Directional Trend IndexB3 Directional Trend Index ~ All about the trend! William Blau is the designer of this gem, and IMHO it is the best trend finder of all the lagging indicators out there I have tested. It is important to pay attention to the slope and thickness of the line, and its relationship to zero. A reversion to the zero may look momentous, but in fact it could reverse when it reaches mean, only to turn back around. You can see this in March and April of this silver futures daily chart. Makes for a great instrument on anything you consider trendy, like crude oil for example. The default user inputs are set to my liking, as I find them to be great on all charts and resolutions. You may read around to find more about this on the internet, or its mentioned in Krausz's work. Also, imprtant to remember when no trend, trend finders like this sufffer, so be wise as to what market condition you are in. Rangy and within Range = no, On the Move = yes.

Cumulative Force, Weighted OBVCumulative Force Indicator. Can also be seen as an OBV indicator that takes the price differences into account. In a regular OBV, a high volume bar can make a huge difference, even if the price went up only 0.01, and it it goes down 0.01 instead, that volume makes the OBV go down big time, even though in both cases hardly anything really happened. cForce is a more realistic view on where the money is flowing.
This is my first published script, so feel free to let me know if you see room for improvements.
