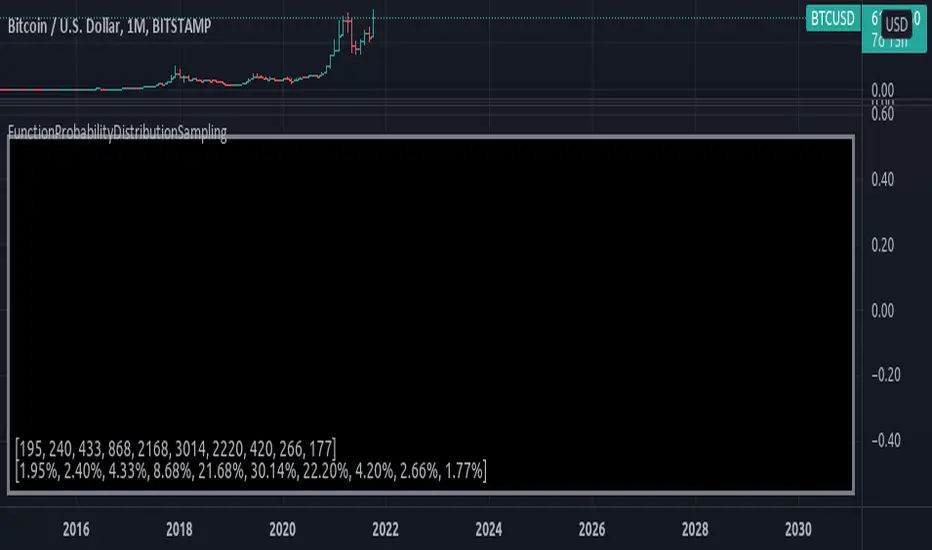
FunctionProbabilityDistributionSamplingLibrary "FunctionProbabilityDistributionSampling"
Methods for probability distribution sampling selection.
sample(probabilities) Computes a random selected index from a probability distribution.
Parameters:
probabilities : float array, probabilities of sample.
Returns: int.
Distribution
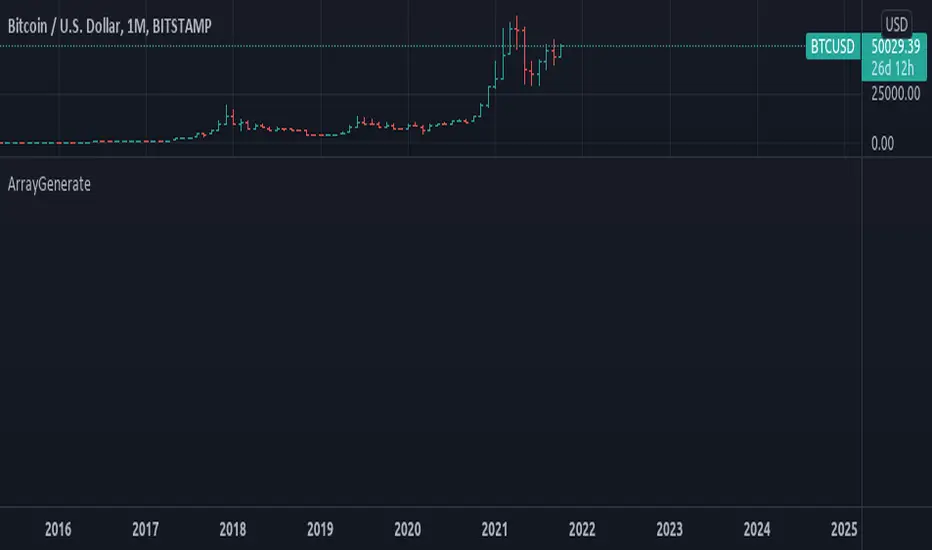
ArrayGenerateLibrary "ArrayGenerate"
Functions to generate arrays.
sequence_int(start, end, step) returns a sequence of int numbers.
Parameters:
start : int, begining of sequence range.
end : int, end of sequence range.
step : int, step, default=1 .
Returns: int , array.
sequence_float(start, end, step) returns a sequence of float numbers.
Parameters:
start : float, begining of sequence range.
end : float, end of sequence range.
step : float, step, default=1.0 .
Returns: float , array.
sequence_from_series(src, length, shift, direction_forward) Creates a array from a series sample range.
Parameters:
src : series, any kind.
length : int, window period in bars to sample series.
shift : int, window period in bars to shift backwards the data sample, default=0.
direction_forward : bool, sample from start to end or end to start order, default=true.
Returns: float array
normal_distribution(size, mean, dev) Generate normal distribution random sample.
Parameters:
size : int, size of array
mean : float, mean of the sample, (default=0.0).
dev : float, deviation of the sample from the mean, (default=1.0).
Returns: float array.
log_spaced(length, start_exp, stop_exp) Generate a base 10 logarithmically spaced sample sequence.
Parameters:
length : int, length of the sequence.
start_exp : float, start exponent.
stop_exp : float, stop exponent.
Returns: float array.
linear_range(stop, start) Generate a linearly spaced sample vector within the inclusive interval (start, stop) and step 1.
Parameters:
stop : float, stop value.
start : float, start value, (default=0.0).
Returns: float array.
periodic_wave(length, sampling_rate, frequency, amplitude, phase, delay) Create a periodic wave.
Parameters:
length : int, the number of samples to generate.
sampling_rate : float, samples per time unit (Hz). Must be larger than twice the frequency to satisfy the Nyquist criterion.
frequency : float, frequency in periods per time unit (Hz).
amplitude : float, the length of the period when sampled at one sample per time unit. This is the interval of the periodic domain, a typical value is 1.0, or 2*Pi for angular functions.
phase : float, optional phase offset.
delay : int, optional delay, relative to the phase.
Returns: float array.
sinusoidal(length, sampling_rate, frequency, amplitude, mean, phase, delay) Create a Sine wave.
Parameters:
length : int, The number of samples to generate.
sampling_rate : float, Samples per time unit (Hz). Must be larger than twice the frequency to satisfy the Nyquist criterion.
frequency : float, Frequency in periods per time unit (Hz).
amplitude : float, The maximal reached peak.
mean : float, The mean, or DC part, of the signal.
phase : float, Optional phase offset.
delay : int, Optional delay, relative to the phase.
Returns: float array.
periodic_impulse(length, period, amplitude, delay) Create a periodic Kronecker Delta impulse sample array.
Parameters:
length : int, The number of samples to generate.
period : int, impulse sequence period.
amplitude : float, The maximal reached peak.
delay : int, Offset to the time axis. Zero or positive.
Returns: float array.
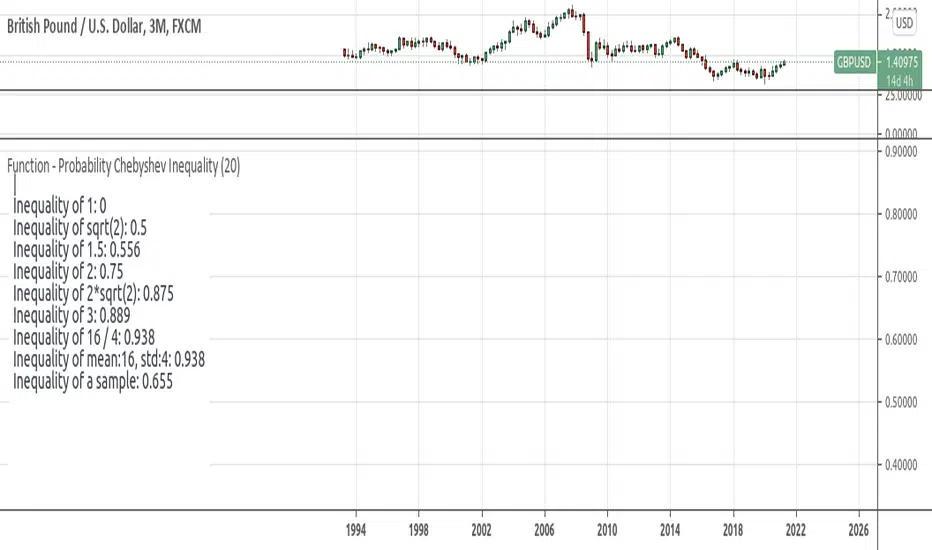
Function - Probability Chebyshev Inequalityfunction to calculate Chebyshev Inequality. wich can be used to compute the probability that we will diverge from what we expect to obtain.
reference:
- www.omnicalculator.com
- github.com
- statisticstopics.wordpress.com
- en.wikipedia.org
Outlier Detector with N-Sigma Confidence IntervalsA detrended series that oscilates around zero is obtained after first differencing a time series (i.e. subtracting the closing price for a candle from the one immediately before, for example). Hypothetically, assuming that every detrended closing price is independent of each other (what might not be true!), these values will follow a normal distribution with mean zero and unknown variance sigma squared (assuming equal variance, what is also probably not true as volatility changes over time for different pairs). After studentizing, they follow a Student's t-distribution, but as the sample size increases (back periods > 30, at least), they follow a standard normal distribution.
This script was developed for personal use and the idea is spotting candles that are at least 99% bigger than average (using N = 3) as they will cross the upper and lower confidence interval limits. N = 2 would roughly provide a 95% confidence interval.

Function - Entropy Gini Indexfunction to retrieve Gini Impurity / Gini Index.
reference:
- victorzhou.com
- en.wikipedia.org

test - event distributiondisplays the distribution of the outcome of a event over the last event.
similar to this script:

Average Dollar VolumeDollar volume is simply the volume traded multiplied times the cost of the stock.
Dollar volume is an extremely important metric for finding stocks with enough liquidity for market makers to position themselves in. Market Liquidity is defined as market's feature whereby an individual or firm can quickly purchase or sell an asset without causing a drastic change in the asset's price. The key concept you want to understand is that these big instructions with billions of dollars need liquidity in a stock in order to even think about buying it, and therefore these institutions will demand a large dollar volume. A good dollar volume amount, that represents a pretty liquid name, is typically above 100 million $ average. Why are institutions important? Simple because they are the ones who make stocks move, and I mean really move. If you want to see large growth from a stock in a short amount of time, you need institutions wielding billions of dollars to be fighting one another to buy more shares. Institutions are the ones who make or break a stock, this is why we call them market makers.
My script calculates average dollar volume using four averages: the 50, the 30, the 20, and the 10 period. I use multiple averages in order to provide the accurate and up to date information to you. It then selects the minimum of these averages and divides this value by 1 million and displays this number to you.
TL;DR? If you want monster moves from your stocks, you need to pick names with average high liquidity(dollar volume >= $100 million). The number presented to you is in millions of whatever currency the name is traded in.

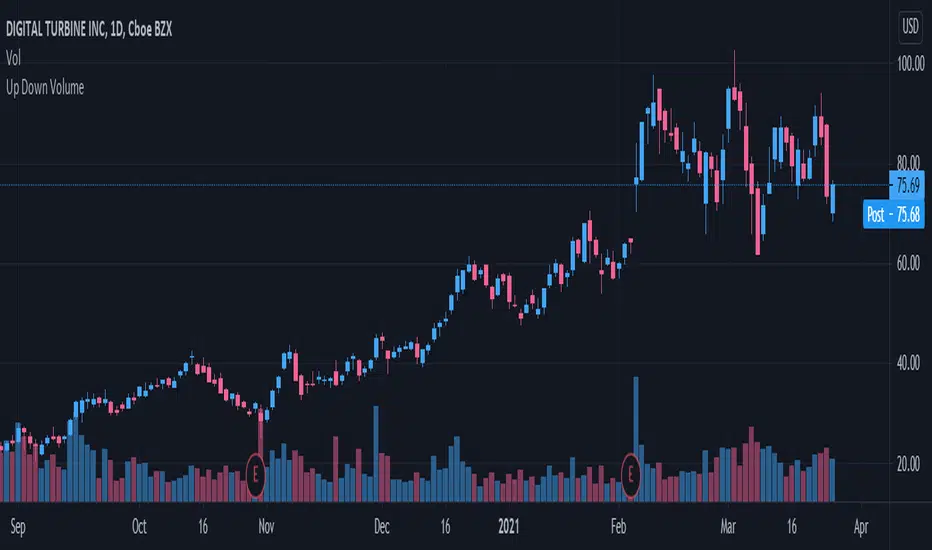
Up/Down Volume RatioUp/Down Volume Ratio is calculated by summing volume on days when it closes up and divide that total by the volume on days when the stock closed down.
High volume up days are typically a sign of accumulation(buying) by big players, while down days are signs of distribution(selling) by big market players. The Up Down volume ratio takes this assumption and turns it into a tangible number that's easier for the trader to understand. My formula is calculated using the past 50 periods, be warned it will not display a value for stocks with under 50 periods of trading history. This indicator is great for identify accumulation of growth stocks early on in their moves, most of the time you would like a growth stocks U/D value to be above 2, showing institutional sponsorship of a stock.
Up/Down Volume value interpretation:
U/D < 1 -> Bearish outlook, as sellers are in control
U/D = 1 -> Sellers and Buyers are equal
U/D > 1 -> Bullish outlook, as buyers are in control
U/D > 2 -> Bullish outlook, significant accumulation underway by market makers
U/D >= 3 -> MONSTER STOCK ALERT, market makers can not get enough of this stock and are ravenous to buy more
U/D values greater than 2 are rare and typically do not last very long, and U/D >= 3 are extremely rare one example I kind find of a stock's U/D peaking above 3 was Google back in 2005.
MAKE SURE TO HIT THE SETTINGS WHEEL AND CHECK THE BOX NEXT TO PLOT IN ORDER TO GET RID OF THE PLOTTED LINE.
Volume Buzz 2.0Volume Buzz/Volume Run Rate as seen on TC2000 and MarketSmith respectively.
Basically, the volume buzz tells you what percentage over average(100 time period moving average) the volume traded was. You can use this indicator to more readily identify above-average trading volume and accumulation days on charts. The percentage will show up in the top left corner, make sure to click the settings button and uncheck the second box(left of plot) in order to get rid of the chart line.
Pictured above, a chart with the volume on the bottom along with the 50-day moving average applied to volume. As you can see in the top left it will tell you the "volume buzz" of that day, telling you what days were on above-average volume and how above-average those days were.

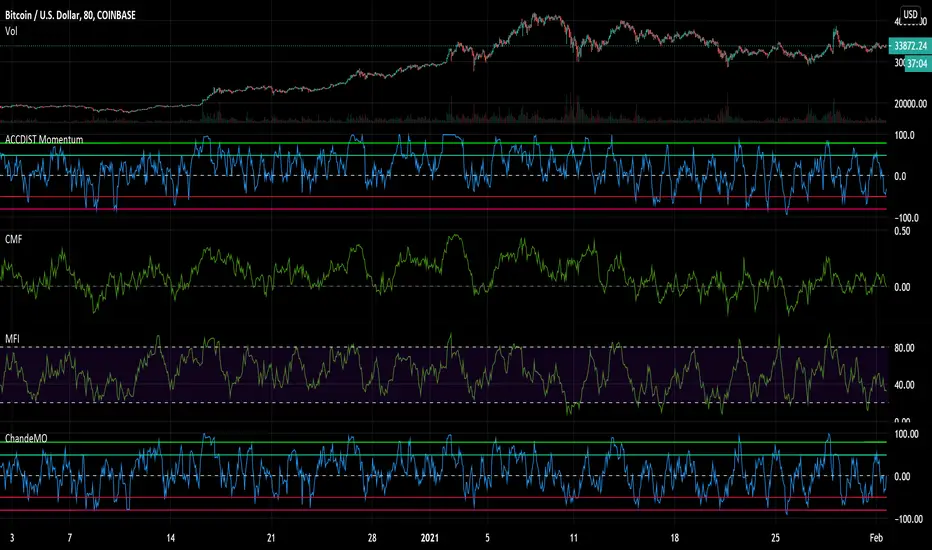
Accumulation and Distribution MomentumThis applies Chande Momentum to Accumulation and Distribution index as a means to changes.
Experimental oscillator.
Compare it to both Money Flows, Acc/Dis and Chande and you notice it has elements of all of them. Could potentially replace other volume based momentum indicators in your strategy.
It is a little more volatile, reaching from side to side, while having a tendency to lean towards the side that gets the most action over a longer period of time.
It also tends to reach and hang in oversold regions BEFORE a pump - something I noticed.
Could be used as an early warning sign as well as for overall trend analysis.

Z-HistogramIt is possible to approximate the underlying distribution of a random variable by using what is called an "Histogram". In order to construct an histogram one must first split the data into several intervals (also called bins) often of the same size and count the number of values falling within each intervals, the histogram plot is then constructed with the X axis representing the measured variable and the Y axis representing the frequency.
The proposed script aim to estimate the underlying distribution of a rolling z-score by constructing its histogram, here the histogram consist of 13 bins of width 0.5 rolling standard deviations. The length setting define the rolling z-score period, the window setting define the number of past data to be counted, finally using the "Total" option (true by default) will count all the rolling z-scores values since the first bar, in order to use the window setting make sure to uncheck the "Total" option.
DISPLAY
In order to see the entirety of the histogram make sure to double click on the indicator window and to have all the lower panels (text notes, pine editor...etc) hidden, finally make sure to zoom-in in order to see the frequency numbers displayed.
Z-Histogram on BTCUSD 15 min TF, the blue bins represent intervals situated over 0 while red bins represent intervals situated under 0. Here σ represent the X-axis in standard deviations, the histogram start with a bin situated at σ = -3 which count the number of times the rolling z-score was within -3 and -2.5, the histogram end with the bin situated at σ = 3 which count the number of time the rolling z-score was within 3 and 3.5.
It is also possible to look at the shape of the histogram without having the indicator window at full size.
INTERPREATION
An histogram can give really interesting information such as overall trend direction and strength. The direction can be measured by looking at the skewness of the histogram, with a negative skewness (the peak of the histogram situated at the right from the center) representing down-trending variations and positive skewness (the peak of the histogram situated at the left from the center) representing up-trending variations, while a symmetrical histogram could represent a ranging market. The farther away the peak of the histogram is situated from the center, the stronger the trend.
Another interesting characteristic is the tailedness of the histogram, which can give information about the cleanliness of the trend, for example a positive skew and high tailedness would represent a clean up-trend, as it could suggest less variations contrary to the main trend.
An histogram applied to the rolling z-score can give various useful information. As a recall the rolling z-score of the price measure the distance between the closing price and its moving average in term of rolling standard deviations, for example if the rolling z-score is equal to 2 it means that the closing price is currently 2 rolling standard deviations over its moving average.
Lets for example analyze the histogram using INTC 15 min tf with a window of 456 bars and rolling z-score of length = 100 in order to review longer term variations.
We can see from the histogram that the uptrend visible on the chart is represented by the bins situated over 0 having an overall higher frequency than the bins under 0, we can see that the closing price tended to stay between 1 and 1.5 rolling standard deviations over its period 100 moving average. Here bins under 0 accounts for retracements in the trend.
IN SUMMARY
An histogram can give various information regarding the price evolution of a security, the proposed script aim to plot the histogram of a rolling z-score. Now this script might not be too useful but it was fun to make, also it does not mean that an histogram is not an useful tool in the context of trading, the only thing required is a god implementation of it (like volume profiles for example)
In this post we have also reviewed some important statistical concepts such as distributions, z-score, skewness and tailedness, each being extremely important in the quantitative trading field.
Thx for reading !

A/D + 21/200EMASimple Accumulation & Distribution indicator with the 21 and 200EMA plotted on it. Might be a useful tool in your arsenal.

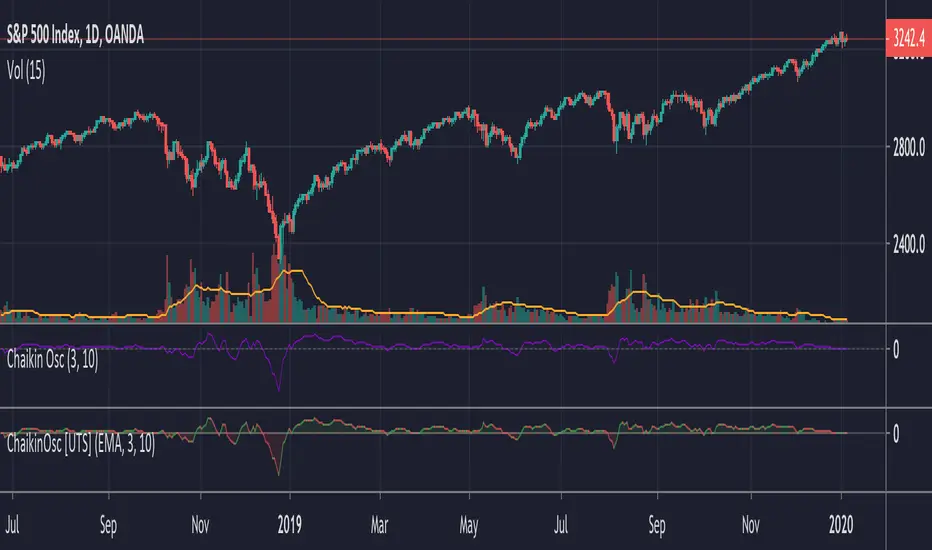
Chaikin Oscillator (ADL Oscillator) [UTS]The Chaikin Oscillator is basically an oscillator version of the Accumulation / Distribution Index, also known as ADL Indicator.
General Usage
The indicator runs both above and below zero, made to denote whether an asset is in a bullish (above zero) or bearish (below zero) trend.
It can be used to confirm trends, as well as spot possible trading signals due to divergences.
A benefit of the oscillator version is that it can produce LONG or SHORT signals on zero line cross.
Moving Averages
4 different Moving Averages are available:
EMA (Exponential Moving Average)
SMA (Simple Moving Average)
VWMA (Volume Weighted Moving Average)
WMA (Weighted Moving Average)
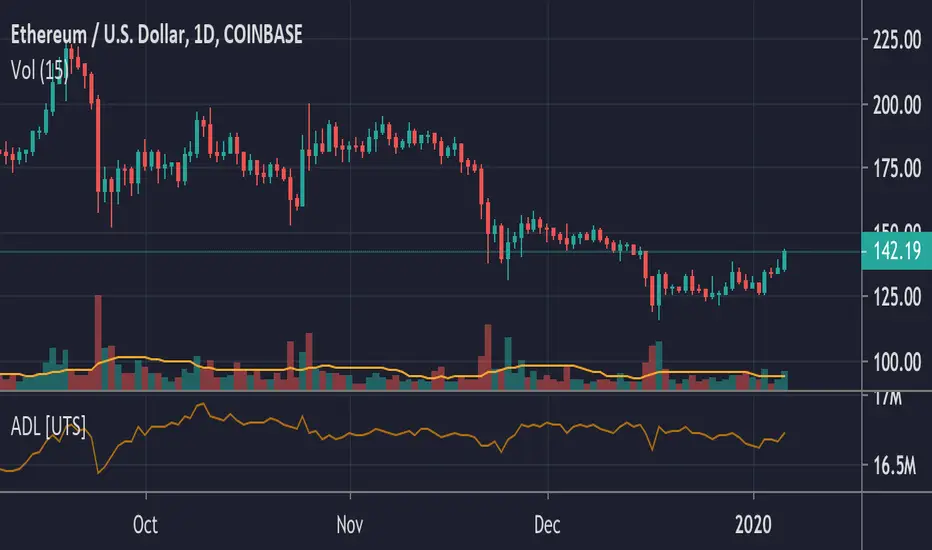
ADL - Accumulation Distribution Line [UTS]an underlying asset.
It is determined by the changes in price and volume. The volume acts as a weighting coefficient at the change of price — the higher the coefficient (the volume) is the greater the contribution of the price change (for this period of time) will be in the value of the indicator. The indicator is also known as Accumulation / Distribution Index.
Common known variants of this type of indicator are the On Balance Volume, Chaikin Oscillator or Chaikin Money Flow.
Based on www.metatrader5.com
Whale Trading SystemThis script is an advanced version of the distributional blocks script.
In distributional buys and sells:
I used a high - low cloud filter, which makes it more prudent to sell the next sell higher for sells and to buy the next purchase lower for buys.
I also used the Stochastic Money Flow Index function because it also uses volume to separate regions.
The long period is 52 weeks, which is equal to one year,
The short period is one-fourth of its value, which is equal to a financial quarter.
Then the values calculated with these periods are calculated by stochastic - rsi logic within the function, giving us two averages and separating the regions according to crossovers and crossunders .
In buys and sales, the higher your next distributional position size makes your profit more .
In the old system, there was a confusion as it was not divided into zones.
Because we divide into zones here, zone changes are the last stop to free up existing positions, and you must reopen each time you change zones.
And I changed standard distribution days, depending on the price change and the histogram, as StochMFI also took into account the volume.
In this way, there is sustainability.
I am also sharing my educational idea that explains the logic of this system in more detail :
Now that we have been divided into regions, a maximum of 10 pieces will suffice us.
And the regional shifts will allow us to sell and buy all of our position size, and now we will feel much more comfortable.
The most timeframe I find most accurate are the weekly bars.
Even in the example, we see how we have benefited from the sharp drop in bitcoin, while the price is falling, and we have lowered the average with higher-weight purchases than the previous one.
In both buys and sales here, both the histogram intensities and the average of the purchases you have reduced with the transactions, or the earnings you have increased with the sales, guide you.
In areas with high volatility ,if we adjust our positions properly, even if we follow the changes in the region, we will get rid of those situations with few wounds and we will surely catch the trend!
NOTE : Crossover/crossunder and distributional buy/sell alerts added.
Best regards , Noldo.

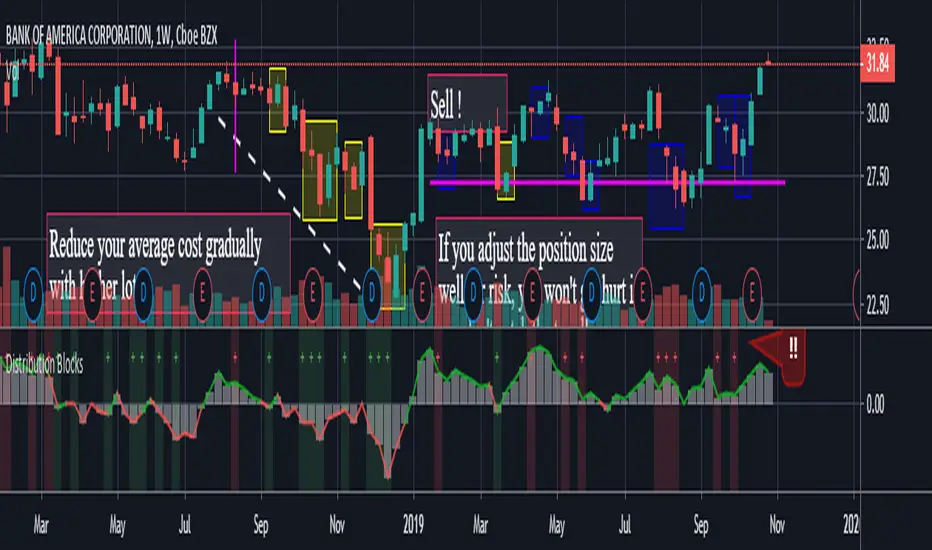
Distribution BlocksThis idea has been created by the combination of the two existing systems as a result of my efforts to create a distributional buying and selling guide that has plagued my head for a long time.
1st idea is Accumulation / Distribution Line :
2nd idea is Distribution Day :
These two ideas, the intellectual assistance of professional brokers, and my observations of cot data played a role in the formation of this idea.
Let's start.
No matter how often we divide our risk, both our minds are not comfortable and our capital may end at any moment, and if we do not use professional systems, our chances of success are 50 percent.
If we take this system as an aid to our classic systems, we can determine the amount of risk with those predictions and gradually trade.
If we don't use leverage and we have a little predictive ability, our chances of success go above 50 percent.
But for the first time, we can keep our first lot very low and increase the number of positions in the same order of orders (example: buy and buy and buy).
If we keep the first amount low, the folds won't hurt us.
When we catch up with the trend, purchases with larger position sizes than lower prices lower our average price, so that we can make a good profit when the rising trend starts.
By accepting the zone changes as the reset point just like in the martingale system, we enter the folds in the new zone with our first lot weight.
Although we cannot catch the trend, we determine the stoploss level by adding the first point we entered or the first point we entered and the commission cost.
In fact, this method is the method of buying and selling very large traders and producers, banks, pro-brokers, hedge funds and in other words the new popular phrase "whales".
Because if he trades otherwise, he cannot find buyers because his goods are too big.
I like the comfort of mind in this way.
Finally, your methods separating the negative and positive regions (macd, rsi, interpretation observation etc.)
the stronger you are, the higher your success rate.
I think the Accumulation Distribution method is very successful, but it can be adjusted for the period.
I can't wait to integrate my relativity system on this.
And when my deep learning series is over, I will integrate them on ANN series and share them publicly.
To start with, I can say briefly.
If your capital is 100:
(first lot + (increase multiplier * first lot) + (increase multiplier * increase multiplier * first lot) + .....) = 100
I tell you that you can have the same position in this series 10 - 15 times,
this will help you decide how small a position size is to be used as the starting rate and choose a low increment multiplier!
I think that this idea cannot be converted into strategy, because when our expectations come true, we may want to free all positions and start again.And I think that's better.
And in sudden movements and developments we take action with different expectations.
I'm going to talk about this script's calculations and profits on educational ideas.
Regards , Noldo.
Gaussian distribution %sWith 4 Moving averages options, length input and source input this script will help you test so you can find the best moving average type and length according to the gaussian distribution theory.
Gaussian Distribution Theory:
68% of all data points fit within 1 Standard deviations of the mean
95% of all data points fit within 2 Standard deviations of the mean
99.7% of all data points fit within 3 Standard deviations of the mean

Volume Extension [DepthHouse]DepthHouse Volume Extension uses average calculations to determine the dynamic range which the volume travels through. Any spike above the line represents an over extension in average volume.
The colored bars are then calculated in a similar way, which measures a combination of both price and volume action to determine bull & bear exhaustion levels, and possible entry/exit points for big players.
This indicator is 100% free , so if you benefit from using it, please consider supporting me by checking out the several other indicators available on my page :)

Ichimoku A/D Breakoutthis is basically a clone of the super a/d indicator but we're using a standard ichimoku as the source for the trend instead of the supertrend indicator

Distribution Days-BuschiThis script is a simple extension of the script "Distribution Day" from user "kalle2017". Thanks to him!
As the name suggests, the idea is to recognize "distribution days", when the "firm hands sell to the shaky hands" (Kostolany). So, too many distribution days in a certain timeframe can be a sign for a coming correction / bear market.
A distribution day gets triggered when a loss compared on the day before exceeds 0.2 % and the trading volume is higher.
This indicator works on any daily chart symbol but should be primarily used on major indexes.
Possible inputs are "days back" to count how many trading should be examined(default: 25). Additionally, I implemented the possibility to draw a moving average (default: exponential, 50), to eliminate distribution days below, because it is more of an indicator for the upside. Perhaps a little bit too much / too complicated, therefore it is off by default.


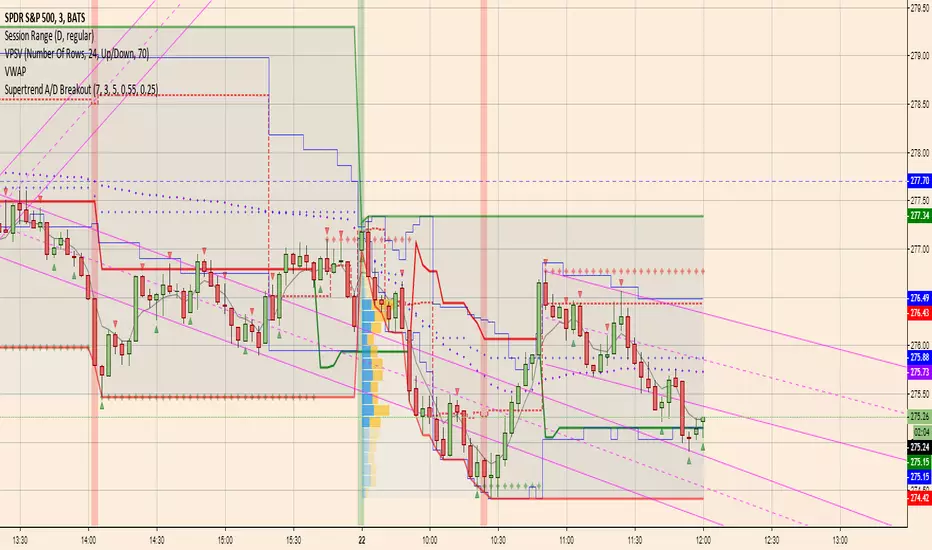
Supertrend A/D BreakoutModified Hoffman A/D:
1. uses standard supertrend to determine up/down direction (previous version used ema crossover)
2. uses improved A/D candlestick patterns
I'm optimistic about this one