Divergenza

Trend CheckpointsTrend Checkpoints reversals
Green :
1-Trend meter 3 green oscillators
2- Stochastic Rsi going down from 100-75
3- Stochastic Rsi with red background (optional on settings)
4- Price action above
Red :
1-Trend meter 3 red oscillators
2- Stochastic Rsi going down from 0-25
3- Stochastic Rsi with green background (optional on settings)
4- Price action below

MACD Price Divergence indicatorIndicator for divergence between MACD trend and price trends. Try it out and let me know what you think!

BOSS Smooth Stochastic-RSI And RSI Oscillators With Alerts THE BEST FOREX, BINARY OPTIONS, STOCK AND CRYPTO INDICATORS FOR TRADINGVIEW.COM
Our Smooth Stochastic RSI indicator and our RSI indicator all combined in one!
BACKGROUND AND BAR COLOR
Green=BULLISH
Yellow= NEUTRAL/TRANSITIONAL
Red= BEARISH
ALERTS
GET ALERTS FOR BULLISH AND BEARISH CROSSOVERS ON STOCHASTIC RSI
GET ALERTS WHEN RSI LINE IS GREEN AND RED

VWMA/SMA Breakout and Divergence DetectorThis indicator compares four different values :
-Fast Simple Moving Average(SMA)
-Fast Volume Weighted Moving Average(VWMA)
-Slow SMA
-Slow VWMA
Comparing SMA's and VWMA's of the same length is a common trading tactic. Since volume is not taken into consideration when calculating Simple Moving Averages, we can gain valuable insights from the difference between the two lines.
Since volume should be increasing along with an upwards price movement, the VWMA should be greater than the SMA during a volume-supported uptrend. Thus, we can confirm an uptrend if the VWMA remains greater than the SMA. If the VWMA falls under the SMA in the midst of an upwards price movement, however, that indicates bearish divergence. The opposite is true for downtrends. If price is decreasing and volume is decreasing at the same time (as it should), then we can confirm the downtrend.
Interpreting the Graph:
If the slow SMA is greater than the slow VWMA, then the area representing the difference between the two lines is filled in red. If the slow VWMA is greater than the slow SMA, however, the area between the two is filled green.
If the fast SMA is greater than the fast VWMA, then the area between the two dotted lines is filled in red. On the other hand, the area will be filled green if the fast VWMA is greater than the slow SMA.
In addition to spotting divergences and confirming trends, the four lines can be used to spot breakouts. Typically, a VWMA crossover will precede the SMA crossover. When the fast VWMA crosses over the slow VWMA and then a SMA crossover follows shortly after, then it is a hint that a bullish trend is beginning to form.

Cardistry ♠♥♦♣♠♥As always -No repaint, Signals are real time♦♣
First release version is not tunned, parameters need testing and manual tuning from users
Label meanings and color is self explanatory and pretty straight forward
Signals deviate from Candlestick sequences and Volatility

Auto Divergence Study Pre-ReleaseThis is the pre-release version of my AutoDivergence Study that inlcudes some major changes and major improvements

💸 Divergence Finder v1.0 by Cryptothythms💸 Divergence Finder v1.0 by Cryptothythms
Intro
This indicator is meant as a quantitative look at divergences. Special thanks to RicardoSantos (legend!) for his divergence detection script which was used as a basis to construct this.
Usage
Lime Green = Regular Bullish Divergence
Dark Green = Hidden Bullish Divergence
Red = Regular Bearish Divergence
Maroon = Hidden Bearish Divergence
Remember... divergences do not have a high probability success overall. So to mitigate that this is an attempt to source many "opinions" on the state of divergence from many different classes of indicators.
Leading indicators - Lead price action, but have a higher probability of false signals
Real time indicators - Track price action, momentum, etc in a tick by tick state. Generally a 1-3 bars lag can be present.
Lagging indicators - Lag price action a little, but offer more in terms of confirmation of the divergence
Volume indicators - Look at volume flow in different fashions and give an added dimension to divergence finding. Remember volume divergences interact with price independently. For instance volume can be going down, but price going up. Be sure to understand the relationship of volume and price action when considering these readings.
👍 Enjoying this indicator or find it useful? Please give me a like and follow! I post crypto analysis, price action strategies and free indicators regularly.
💬 Questions? Comments? Want to get access to an entire suite of proven trading indicators? Come visit us on telegram and chat, or just soak up some knowledge. We make timely posts about the market, news, and strategy everyday. Our community isn't open only to subscribers - everyone is welcome to join.
For Trialers & Chat: t.me/cryptorhythms


Cuban's VWAP DivergencesAfter using many different divergence scripts, I struggled to find one that didn't indiscriminately signal a constant divergence while the price was trending.
This study attempts to solve this issue, along with filtering out false signals. I have found it to print less signals and to be more accurate.
It also gives you a confluence level between high probability reversals (labels) and lower probability reversals (crosses), and some clever trade logic in the candle colouring -- to signal when to take the trade.
I have added a night mode for aesthetic label colouring and an option to minimise labels all together.
I recommend using this study in conjunction with one of my other scripts; Cuban's LTF Trend Oscillator.
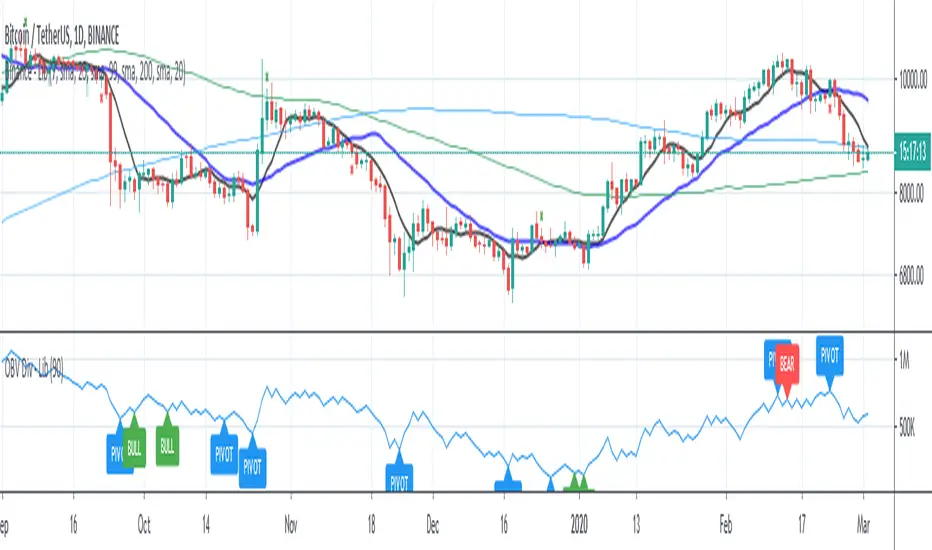
OBV On Balance Volume - Divergences - LibertusHello all,
As my RSI divergences script became popular, I got few requests for making divergences scripts on other indicators.
One of most popular and requested indicators next to RSI is OBV (on balance volume) which measures buy and sell volume based on candle close (green/red).
So finally, here it is, divergences script for OBV. I'll probably also make candle edition script after I iron out bugs on this one.
Have fun and good luck with trading.
Note for those that are not familiar, here you can find my RSI divergences scripts:
RSI Divergences - regular -
RSI Divergences - candle edition -
OBV+ (v0.1)Just playing around with some ideas I had with On Balance Volume (OBV). Added a divergence spotter and EMA's that all uses OBV as a source. Let me know if you have any feedback!
My main use of OBV:
1) Confirm trend continuation: When price has a clear trend, OBV should be aligned with the trend.
2) Discover price reversal: When price and OBV moves in opposite directions, you can expect a reversal.
DIVERGENCE SPOTTER
The spotter will tell you when there are divergences between OBV and price. These are useful as they can indicate a trend reversal;
Regular Bullish Divergence
If price is making lower lows (LL), but the OBV is making higher lows (HL), this is considered to be regular bullish divergence .
This normally occurs at the end of a DOWNTREND.
Regular Bearish Divergence
Now, if the price is making a higher high (HH), but the OBV is lower high (LH), then you have regular bearish divergence.
This type of divergence can be found in an UPTREND. After price makes that second high, if the OBV makes a lower high, then you can probably expect price to reverse and drop .
Hidden Bullish Divergence
This can be seen when the pair is in a UPTREND.
Once price makes a higher low (HL), look and see if the OBV does the same.
Hidden Bearish Divergence
Lastly, we’ve got hidden bearish divergence.
This occurs when price makes a lower high (LH), but the OBV is making a higher high (HH).
By now you’ve probably guessed that this occurs in a DOWNTREND.
When you see hidden bearish divergence, chances are that the pair will continue to shoot lower and continue the downtrend.

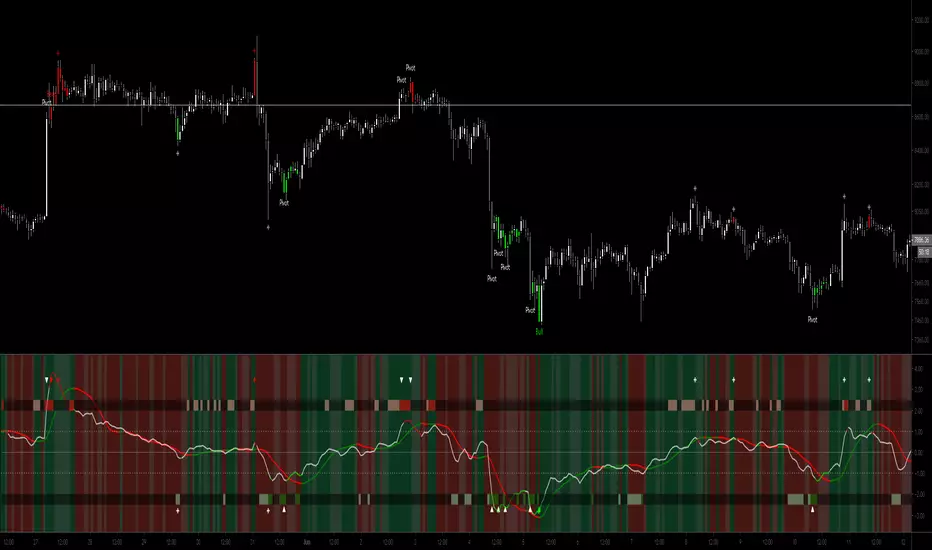
Cuban's LTF Trend OscillatorMost financial markets tend to trade within a reasonable range between 60-75% of the time (don't ask for a reference because I couldn't find it), so swing trading with a trend isn't always viable -- so how do we take money out of the market?
If you're familiar with scalping low time frames for 20 or 30 ticks, you'll know how difficult it is to time your entry and exit during low volatility environments.
The following oscillator has been solely built to assist the manual discretionary trader in their LTF scalps.
The oscillator uses a combination of different price to VWAP relationship, divergence, and momentum logic to define preferable entries.
This script attempts to identify three different entries characteristics on low timeframes:
1. Counter-trend reversals
2. On-trend pullbacks
3. and, short term directional pivots
The oscillator has red, green, and white triangles above the centre fill. These triangles relate to the low time frame RSI divergence and pivots.
In combination with these divergences and pivots, I've added a measure of conviction, identified by the light red, dark red, light green, and dark green rectangles on the outer-most edges of the oscillator.
The dark red and dark green flavours are the highest conviction trades. When you marry these sentiment identifiers with divergences, you have a very high conviction trade.
The fill in the middle of the oscillator is the current trend sentiment. Dark red and dark green is favourable to the respective trend, with the light red and light green being areas where I recommend taking profit or considering an exit.
The green and red coloured moving average in the centre is the slower trend. I have included this to give some context to preferable position adds and closes. Trading with the trend is always advisable. When you have an obvious trend, this oscillator can give you excellent entries to play that continuation.
Warm regards,
Cubantobacco

MFI LizardMFI with auto identification of divergence, multi timeframe support and centre line.
Work In Progress

RatTrend Multiple RSI Divergence MA Cross OscillatorThis Indicator based on RSI Divergence with Overbought and oversold signals.
All tops and bottoms calculated with Moving Average Crosses and combines with RSI signals.
Best working Timeframe is H4 on current settings, you can modify values to find best for you.
Current settings best for BTC trading.
At the beginning it can confuse you to understand but you will understand signal patterns.
Have fun.

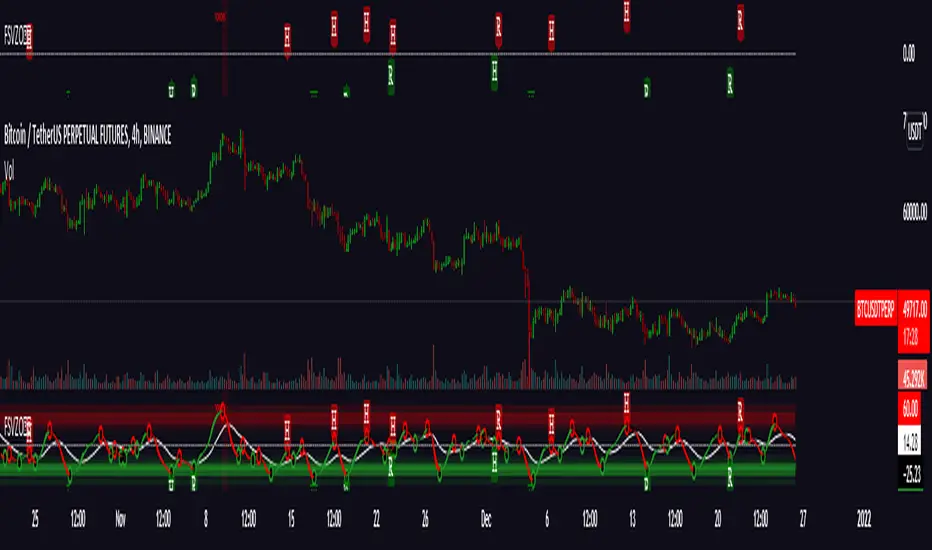
Regularized Volume Zone Oscillator FSVZORegularized VZO
Vanilla in link below
White noise and 1 confirm auto divs included
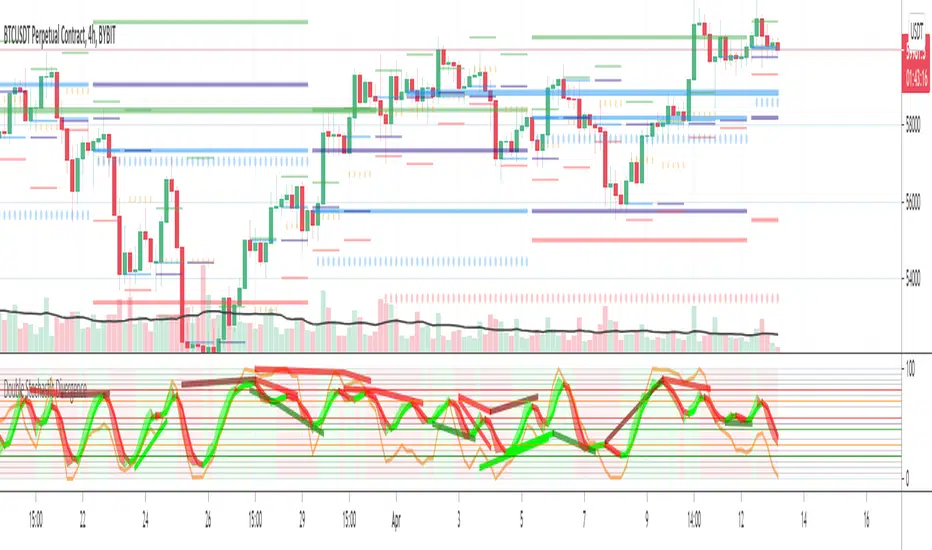
Double Stochastic DivergenceSame as my protected script but you can now see the code
This Study plots divergences and overlays a second %K as a fractal and changes the color of %D for the non fractal
Option to use Stochastic RSI for Fractal
Background Shading according to trend
Feel Free to change the indicator values to suit your style / system
The divergence script is thanks to @RicardoSantos, I've just adjusted it to suite my indicator
Remember that divergences work best when traded with the trend or very late in a trend when going against the trend
Common value for %K is 5, I have chosen 3 as it gives faster entries when using multiple time frames
If you are not using a momentum indicator as a trailing stop and using only cycle indicator
then I would recommended %K be 4 for exits
Multi Divergence Overlay +This Indicator overlays Divergences lines and labels on the chart from multiple sources including RSI, RSI Signal Line and 2 Stochastics and more
The Colors and Labels match my other Divergence Indicators
The divergence script is thanks to @RicardoSantos, I've just adjusted it to suite my indicator
Remember that divergences work best when traded with the trend or very late in a trend when going against the trend
The + Part of this indicator is that it now plots
Exhaustion pivots
&
Bob Rooker - Reversal Tabs and Knoxville Divergences

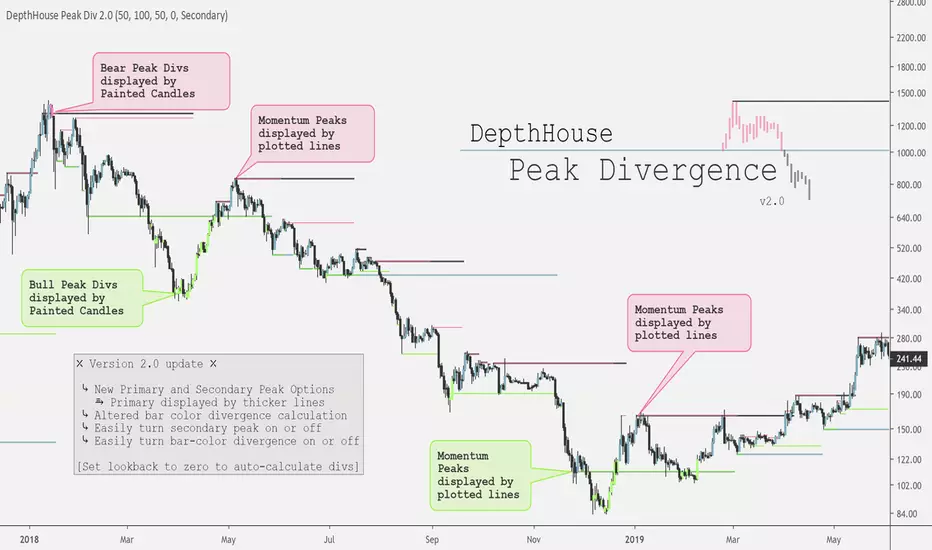
DepthHouse - Peak DivergenceDepthHouse - Peak Divergence indicator uses the same linear regression calculation as my Peak Momentum Oscillator to help determine and plot peak momentum points.
These peak levels are then plotted by either red or green lines above or below the candle.
Red lines represent a peak in bear momentum while green represents peaks in bull momentum.
These levels are then used to determine momentum divergence in the displayed market.
If divergence is present the bars colors will change represent either bull or bear div.
Important Notes:
If the price crosses a peak line and the bar color does not change; it means momentum has increased/decreased with the price and the divergence has been canceled.
If divergence is present, and then the following candle is not colored then momentum has increased to cancel the previously present divergence.
By default, the look-back period is set to zero , which automatically calculates the distance for the peak levels to look-back. However this number can be set to whatever look-back period you would like.
At time of release this indicator is in its early stages. So please leave feedback on how it can be improved!
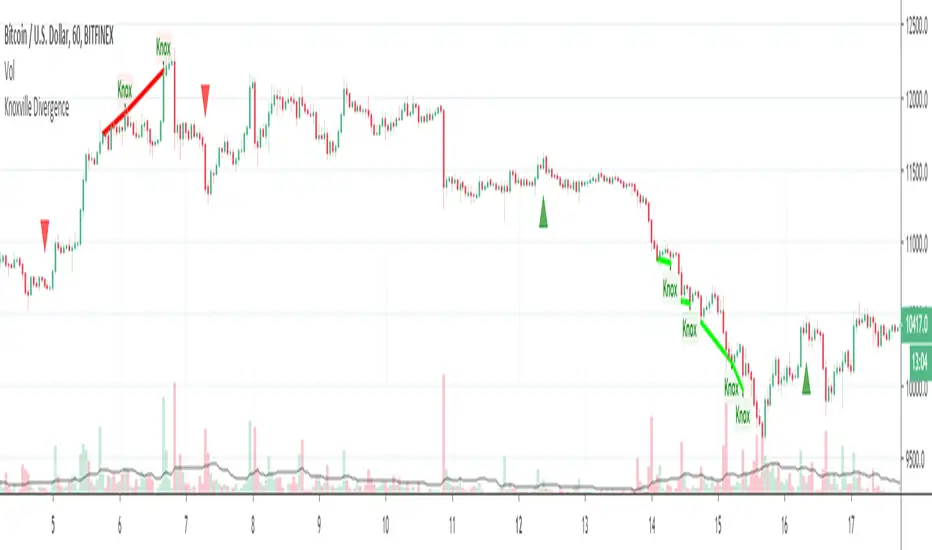
Knoxville DivergenceOverlays Knoxville Divergence on your Chart
These don't occur very often but when they do they are best used in conjunction with Rob Booker Reversal Tabs

Sizing GuideThis indicator helps you defining your max sizing, depending on the max $$$ amount you're willing to risk against a specific exponential moving average (or VWAP, default is the 13ema).
You can define your max risk amount and your max allowed sizing. The indicator would suggest the best sizing in order to risk only up to the amount you are comfortable with on a potential trade.
Moreover, the column bar would turn yellow/red if the divergence is above a certain threshold (default are yellow > 1.50% and red > 2.75%, green otherwise).
