DMI Stochastic Extreme Refurbished█ CONCEPTS
DMI Stochastic Extreme was originally published by Barbara Star, PhD, in TASC magazine of January 2013.
Basically it describes an improved version of the ADX DI+/DI- indicator, created by J. Welles Wilder.
In the setup described by the author, the DMI Oscillator is used together with a stochastic oscillator of DMI.
First, the DMI Oscillator is obtained by subtracting the minus directional movement indicator value (DI-) from the plus directional movement value (DI+).
The final result is the "DMI Stochastic Extreme" indicator, in which the stochastic oscillator is calculated. Only instead of using the price value, the stochastic is obtained through the DMI value.
█ Goals
The final indicator described by Barbara is the Stochastic Oscillator of DMI.
However, to use the DMI oscillator together (as described in the magazine), it is necessary to plot it in a separate indicator, which consumes screen space.
That's why the idea of joining both the DMI oscillator and the DMI Stochastic Oscillator into one thing came up, optimizing the visualization.
Taking advantage of the fact that my hands are already dirty :), I created some fine adjustments.
█ HOW TO USE IT
Here are some examples:
1. With default params:
2. With custom DI Length of 21 (Histogram), DI Length of 13 (for Stoch Oscilator), Stoch Length of 5, and another theme.
3. Another params with less noise:
█ THANKS AND CREDITS
- Barbara Star (original creator)
- ucsgears (arrow logic)
Divergencetrading

Bogdan Ciocoiu - CoordinatorDescription
The Coordinator is an indicator developed on the back of the RSI algorithm, modified substantially to form a cloud. In addition, the Coordinator uses EMA/SMA to compare the location of the RSI cloud with the chosen moving averages (EMA vs SMA).
This indicator is helpful as it confirms when a trader should enter a position or exit based on the proximity of the RSI cloud to the relevant MA.
Uniqueness
The Coordinator provides unique benefits, including:
It shows the strength of the RSI in the shape of the RSI cloud, using two sets of dimensions (one more long term and one more short-term oriented).
It indicates the positioning of the RSI cloud in conjunction with the relevant moving averages to help traders remain in positions for longer.
It shows the RSI 14 (useful when spotting divergences aligned with the price action).
Open-source
The Coordinator uses the following open-source scripts:
www.tradingview.com

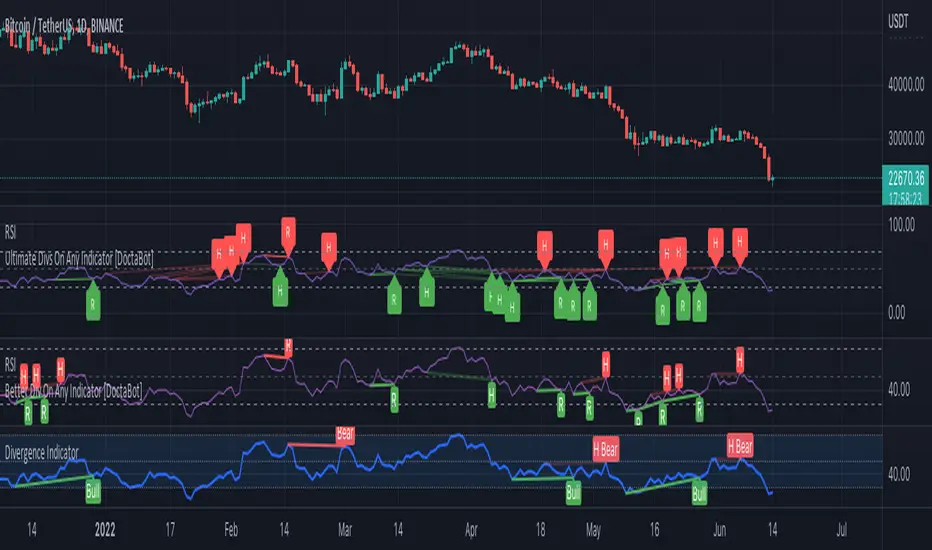
Better Divergence On Any Indicator [DoctaBot]This is an expansion of the Tradingview built in Divergences indicator (bottom) with 2 MAJOR differences.
First, and most importantly, the built in indicator identifies pivots in your chosen oscillator, but then utilizes the corresponding candle's HIGH or LOW to identify potential divergences. I'm not a fan of this method because oscillator values are typically calculated using the candle CLOSE values, so, in my opinion, divergences should be identified using the candle CLOSE value as well, as they are in this script.
Second, the built in divergence indicator only looks back one oscillator pivot for potential divergences. I coded this to look back one additional pivot as well to identify more valid potential divergences. The script will only identify these types of "multiple pivot divergences" if the oscillator pivot in between the two diverging pivots DOES NOT intersect the line being drawn them.
Notes for chart:
#1: This built in Divergence indicator misses this hidden bearish divergence because of the pivot in between (marked with red vertical line). No divergence exists between the most recent pivots, but it does if we compare it to the next one back.
#2: The RSI14 is making a lower high here, the first criteria for a bearish divergence. The built in Divergence indicator then references the candles' HIGHS. Because the most recent HIGH exceeds the previous one, it is considered a higher high and incorrectly identified as a bearish divergence. If we use the candle CLOSE price to identify divergences, this does not qualify.
#3: Here, we see both of the updates in action. Neither of these bearish divergences are identified with the built in Divergence Indicator. The first divergence s missed due to the use of candle HIGHS rather than closes; the original HIGH is greater than the next HIGH, however, comparison of closes shows that it is, in fact, a higher CLOSE. The second divergence is missed because original indicator can only look back one pivot and, consequently, misses the divergence between the next one back.
Please note, you may notice while using this script that some of the older divergences do not show any lines between the oscillator pivots. THIS IS NOT A BUG! In order to draw divergence lines properly for multiple pivots back, I had to use the line.new functions rather than plot functions. These line functions will delete old lines when a certain number have been drawn on the chart so these old ones are automatically erased as time passes.
AOAHey Fam,
Welcome to the AOA.
It's my Awesome Oscillator I use every day in conjunction with Renko. Very powerful for spotting divergences and provides great confluence for level to level traders. Can also be used on a candle chart for trend confirmation.
Also includes the labels for divergences, toggleable inside the settings box when applied to your chart. (They're disabled on my chart)
Alerts include:
1. AO Bear Div
2. AO Bull Div
3. AO Crossing Down 0
4. AO Crossng Up 0
5. AO Two Tick Bear
6. AO Two Tick Bull
** Two tick is a great confirmation signal. **
Enjoy!
Divergence Indicator with alertsFirst time I've published a script so go easy!
All credit goes to @yatrader2 for the script, I have just made it easier to set alerts on it.
Enjoy!

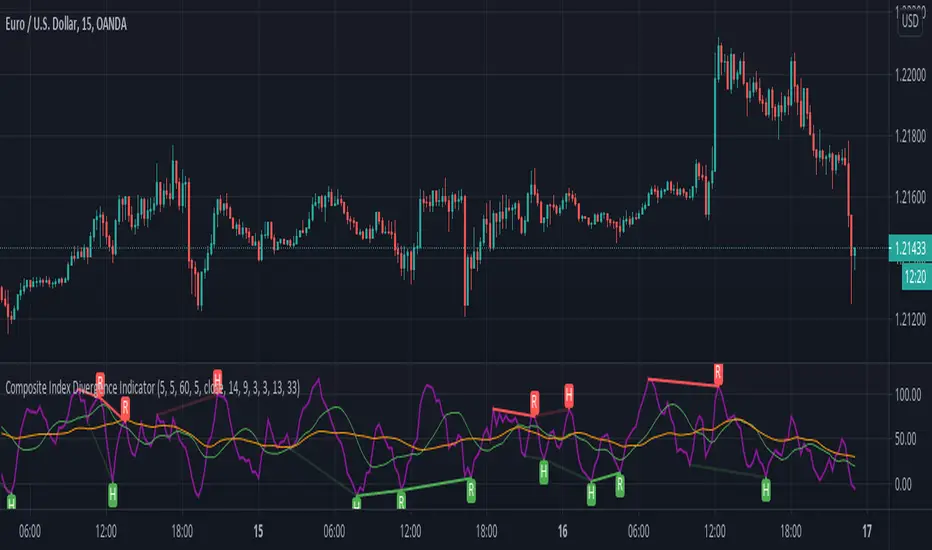
Composite Index Divergence IndicatorComposite Index by Constance Brown mixed with built-ins Divergence Indicator
useful indicator to find divergence
this script find divergence automatically for you
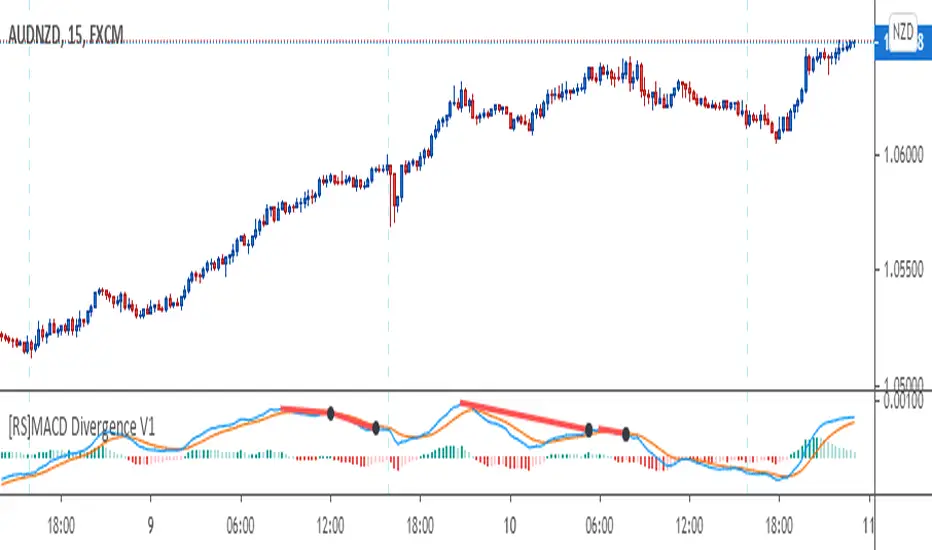
[RS]MACD Divergence V1This oscilator was created by Ricardo Santos using MACD's histogram as the series to find low and high fractals and from there find and plot divergences.
I just modified it a little bit to make it to look more like the MACD public library indicator and use the actual MACD series (instead of the histogram) to find the fractals and from there plot divergences.
I did this to make it easier for me and other fellow students of a Forex school where we use these type of divergences to find patterns.
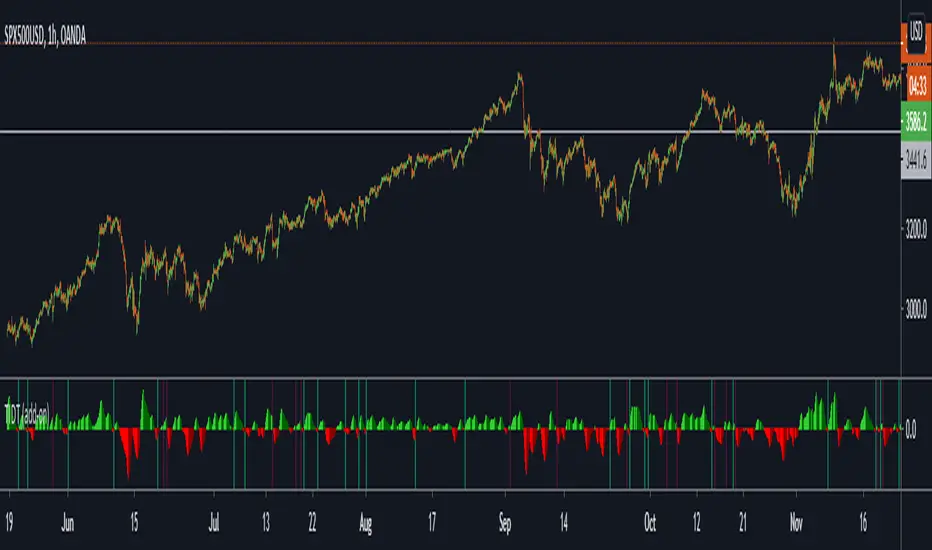
Trend Indicator for Directional Trading (add-on)TIDT is a two-part trend-based indicator designed to recognize the general direction and help you identify good opportunities for going long or short (both indicators are called the same way with "main" and "add-on" additions).
This is the add-on indicator that is added below the chart and aside from identifying trending opportunities, it also shows Bullish and Bearish Divergences. Similar to the main indicator, it is based on 3 Moving Averages over which you have full control. You can choose between the following 7 types:
- Simple Moving Average ( SMA )
- Exponential Moving Average ( EMA )
- Weighted Moving Average ( WMA )
- Running Moving Average (RMA)
- Hull Moving Average ( HMA )
- Volume Weighted Moving Average ( VWMA )
- Arnaud Legoux Moving Average ( ALMA )
I strongly suggest that the types and periods for your MAs in the main and the add-on versions are identical so that you get a better visual of the whole picture. However, you may develop a trading strategy that relies on two different types of signals, so that's entirely up to you. Once you have set up the MAs and chosen the lookback period, the rest is taken care of for you. You get two types of signals:
1) Pullbacks - the divergences between your MAs generate a result, which is then averaged as a percentage gain or loss and worked out into a histogram. The colors of the histogram indicate opportunities to buy (if green), short (if red), or sit tight (if white) unless an explicit signal is given by the indicator. Overall the principle is simple - establish the trend and look for weaknesses so that you can open an order in the direction of the trend.
2) Divergences - generated in a similar way to the Pullbacks strategy with some minor adjustments and improvements to better catch the divergences. The histogram is slightly different, as the positive results are plotted above 0 and the negative ones below 0. As such, the histogram looks a lot like MACD, but with different calculations. The color principle mentioned above is the same - green for longs, red for shorts, and white for neutral unless specified by a signal. The change of the shade of the color shows an increase or a decrease in the momentum. A Long signal comes up when the price makes a lower low, while the momentum makes a higher low. A Short signal comes up when the price makes a higher high, but the momentum makes a lower high.
Ticking a box next to the signal type will show the associated histogram and its signals. Due to the different ways those two histograms are calculated and displayed I recommend having either of them On, but not both. However, you may want to be able to see both types of signals, so I've left this as an option. Once again, all colors are fully configurable.
The complete Trend Indicator for Directional Trading has gone over 1,500 revisions, has been forked over 10 times, and has been worked out to be as minimalistic, useful, and practical as possible. A great deal of work, time, and experience have been poured into this indicator to do what it's supposed to do - help you identify better entry opportunities for increased profitability.
If you have any questions regarding the indicator or suggestions on how it could be improved, please let me know. Thank you.
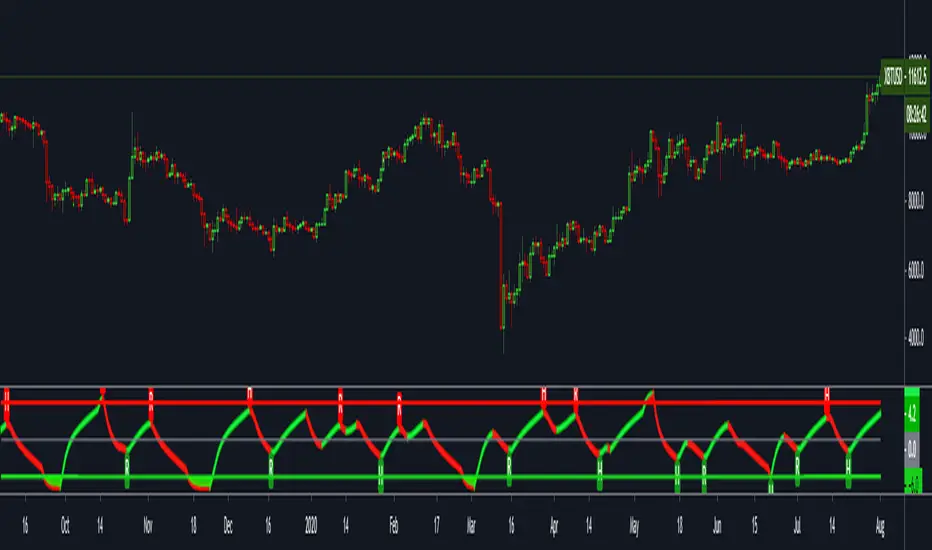
ALLinDivergence v12.60 :: PinPoint BUY/SELL OpportunitiesEasy to spot BUY/LONG or SELL/SHORT ENTRY POINT opportunities.
Just follow this 9 RULES!
Rule 1. ONLY THINK OF GETTING IN A POSITION when BackgroundWave is coloured GREEN and ON POSITIVE SIDE of Flat White Line
Rule 2. ONLY THINK OF GETTING IN A POSITION when BackgroundWave is coloured RED and ON NEGATIVE SIDE of Flat White LineRule
Rule 3. ENTER BUY POSITION (Same Direction) when HigherHighs of MiniWave are coloured GREEN and they are getting BIGGER - needs to be confirmed with RULE 1.
Rule 4. ENTER BUY POSITION (Change) when LowerLows of MiniWave are coloured RED and they are getting SMALLER - needs to be confirmed with RULE 2.
Rule 5. ENTER SELL POSITION (Change) when HigherHighs of MiniWave are coloured GREEN and they are getting SMALLER - needs to be confirmed with RULE 1.
Rule 6. ENTER SELL POSITION (Same Direction) when LowerLows of MiniWave are coloured RED and they are getting BIGGER- needs to be confirmed with RULE 2.
Rule 7. Draw DIVERGENCE TRENDLINES on HIGHS or LOWS to ease your "spotting capabilities" and to be able to set up whatever ALERT you need
Rule 8. IF NOT SURE - CLOSE THE POSITION
Rule 9. DO NOT BE GREEDY - FOLLOW THE PLAN, whatever it is - but definitely THE PLAN SHOULD EXIST)
TIP:
1. First choose your favourite TimeFrame (mine is 30min) and draw all the Lines you need for better preview of the situation and LOCK them (believe me!:)
2. After some move (BUY/SELL) is just about to get confirmed on 30min TF, you can go on lesser TF (i usually analyze 1min, 3 min, 9 min and 15 min) down to TF that its GREEN/RED waves still makes sense (does that makes sense?)
3. On smaller TF you will get confirmation faster but sometimes they are more unreliable than in bigger TF. But if it aligns with a confirmation from 30min TF than i guess it should be OK to judge a bit early:)

Divergence Indicator (any oscillator)A modification of the TV builtin "Divergence indicator" (Version 10) that can be applied to any indicator, and can be plotted on price as well.
Usage:
Add your favorite oscillator, RSI, Klinger, TSI, CMF, or anything else to a chart.
Click the little ... (More) on the oscillator.
Then add this indicator "Divergence Indicator (any oscillator)" on your oscillator of choice.
Click the settings on this indicator and make sure the source is set to the right plot from your oscillator.
Watch for it to plot divergences...
Add this indicator a second time on the price chart (and select the same oscillator plot), but check the box "plot on price (rather than on indicator)""
See you divergence plotted on price (as well as on the oscillator)

Divergence+ [MS]Divergence indicator for any asset and any time frame that shows bullish and bearish regular (dotted) and hidden (dashed) divergences.
Simple to use, just add to your chart and select the size of divergences you want to see.
Scalping? Use a lower number.
Swing trading? Use a higher number.
Set alerts on when divergences appear.
Settings
• Set the divergence size
• Show hidden divergences
• Show signals with divergences
Use the link below or PM us to obtain access to this indicator.

HFT Divergence Hunter IndicatorDefault Settings are meant to be used in BTC/USDT chart on 5 min time frame on Binance Futures. If you want to use for another asset on another time frame YOU MUST CHANGE THE SETTINGS
This is a divergence finding indicator developed by HFT Research. It is a highly customizable indicator and provides endless opportunities to find profitable trades in the market.
Use Envelope, this is the main decision maker in this strategy. The idea behind is that you choose the length of the moving average and set an offset % to create an upper and lower band. If you click on “display envelope” you will be able to visually see the band you have created. This way, you get to scalp the market as the price is diverging and moving away from the moving average. As the famous saying goes, moving averages act like magnets and prices always visits them back. Using this ideology, we aim to capitilize on the price swings that move away from the chosen moving average by x%.
STARC Bands;
These are two bands that are applied above and below a simple moving average of an asset’s price. The upper band is created by adding the value of the average true range (ATR) or a multiple of i. The lower band is created by subtracting the value of the ATR from the SMA. The channel can provide traders with ideas on when to buy or sell. During an overall uptrend, buying near the lower band and selling near the top band is favorable. However, from our testing results it does fairly poorly in crypto markets while it does pretty well in traditional markets.
Use RSI;
One of the most commonly used indicators in the trading world. The idea is simple, buy when its oversold and sell when its overbought. You can use RSI as a secondary confirmation of the dips. It can be turned on and off.
Use MFI
MFI stands for Money Flow Index and it is an oscillator like RSI. However, it does track the price in a different fashion than RSI providing a reliable option. It uses the price and volume data for identifying overbought and oversold signals in an asset.
Use Fisher Transform
Even though, it has a funny name, Fisher is actually a very decent and reliable indicator. It converts the prices into a Gaussian normal distribution channel. Therefore, the indicator detects when the prices have moved to an extreme, based on recent price action.
Use VWAP
VWAP stands for volume weighted average price. It is an extremely useful indicator when trading intra-day. It does reset every trading session which is at 00:00 UTC. Instead of looking at x number of candles and providing an average price, it will take into consideration the volume that’s traded at a certain price and weigh it accordingly. It will NOT give entry signals but act as a filter. If the price is above VWAP will filter out the shorts and other way around for longs.
Use ADX
Average directional index is a powerful indicator when one is assessing the strength of a trend as well as measuring the volatility in the market. Unfortunately, the worst market condition for this strategy is sideways market. ADX becomes a useful tool since it can detect trend. If the volatility is low and there is no real price movement, ADX will pick that up and will not let you get in trades during a sideways market. It will allow you to enter trades only when the market is trending.
Use Super trend Filter
The indicator works well in a trending market but can give false signals when a market is trading in a range.
It uses the ATR (average true range) as part of its calculation which takes into account the volatility of the market. The ATR is adjusted using the multiplier setting which determines how sensitive the indicator is.
Use MA Filter
Lookback: It is an option to look back x number of candles to validate the price crossing. If the market is choppy and the price keeps crossing up and down the moving average you have chosen, it will generate a lot of “noisy” signals. This option allows you to confirm the cross by selecting how many candles the price needs to stay above or below the moving average. Setting it 0 will turn it off.
MA Filter Type: There is a selection of moving averages that is available on TradingView currently. You can choose from 14 different moving average types to detect the trend as accurate as possible.
Filter Length: You can select the length of your moving average. Most commonly used length being 50,100 and 200.
Filter Type: This is our propriety smoothing method in order to make the moving averages lag less and influence the way they are calculated slightly. Type 1 being the normal calculation and type 2 being the secret sauce.
Reverse MA Filter: This option allows you to use the moving average in reverse. For example, the strategy will go long when the price is above the moving average. However, if you use the reserve MA Filter, you will go short when the price is above the moving average. This method works best in sideways market where price usually retraces back to the moving average. So, in an anticipation of price reverting back to the moving average, it is a useful piece of option to use during sideway markets.
Use MACD Filter
MACD here will act as a filter rather than an entry signal generator. There are a few different ways to use this MACD filter. You can click on the Use MACD filter and it will use filter out the shorts generated in a bullish territory and longs generated in the bearish territory. It will greatly reduce the number of trades the strategy will trade because MACD is a lagging indicator. By the time MACD turns bullish or bearish, most of the other indicators will have already generated the signals. Therefore, resulting in less trades. You can use MACD filter as MA oscillator meaning that it will only look at the MA lines in MACD to filter out trades. Alternatively, you can use it with the histogram (Signal lines) meaning that it will only look at the histogram whether its below or above the zero line in order to filter out the trades.
TP (%)
Place your desired take profit percentage here. Default is 1.5%
Move SL At Entry x% Profit
This is when the strategy will move your SL to the entry point if the position reaches x% profit. It can also generate a signal which can be automated to adjust the SL on the exchange.
SL (%)
Place your desired stop loss percentage here. Default is 1%
If you want to get access to this indicator please DM me or visit our website.

FTSXFisher transform & RSX for reversal points in price.
Potential price reversals are regular divergences and potential trend continuations are hidden divergences, OB/OS levels are shown with red and green lines.
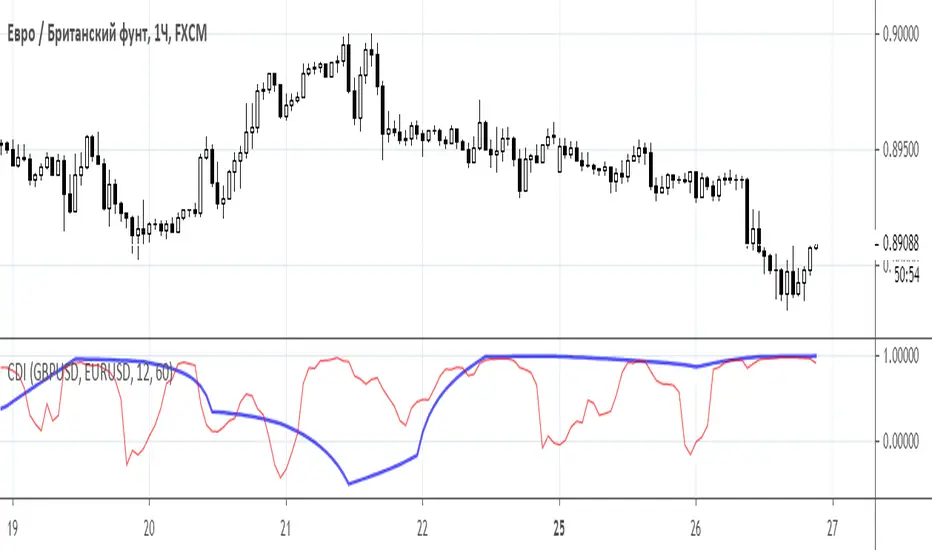
Convergence/divergence indicatorConvergence/divergence indicator (CDI)
Class : arbitrage oscillator
Trading type : intraday trading
Time frame : 1 hour
Purpose : trading on divergence
Level of aggressiveness : standard
Arbitrage - several logically related transactions aimed at profit from the difference in prices for the same or related assets at the same time in different markets.
Pair trading is a trading strategy based on trading a pair of financial instruments that have some fundamental or statistical relationship, expressed in the fact that the price ratio of these instruments tends to return to a certain average value in the long term.
“Convergence/divergence indicator (CDI)” using correlation analysis from different time frames provides information about statistical relationship between pair of assets.
Correaltion - a statistical relationship between two variables, showing that a larger value (in the case of positive, direct correlation) or a smaller (in the case of negative, inverse correlation) corresponds to a larger value of one value in a certain part of the cases.
The correlation coefficient is a statistical measure of the strength of the relationship between the relative movements of two variables.
The values range between -1.0 and 1.0.
A correlation of -1.0 shows a perfect negative correlation, while a correlation of 1.0 shows a perfect positive correlation.
A correlation of 0.0 shows no linear relationship between the movement of the two variables.
“Convergence/divergence indicator (CDI)” a) allows to find assets where pair arbitrage is possible and determines the moments in time and prices when the conditions for pair arbitrage are ideal.
“Convergence/divergence indicator (CDI)” evaluates the statistical relationship between pair of assets in a particular period of time and, if it is available, seeks for the divergence in price fluctuations of these “identical” assets.
“Convergence/divergence indicator (CDI)” displays the current value and dynamics of the Pearson correlation coefficient for a pair of selected assets based on daily (thick blue line) and hourly (thin red line) data.
Basic parameters:
- asset 1 (name of the trading instrument 1);
- asset 2 (name of the trading instrument 2);
- period_d (number of periods used to calculate daily correlation).
- period_h (number of periods used to calculate hourly correlation).
To gain the access to this indicator, please, send a private message to Trade24Fx.
Mawreez' RSI Divergence DetectorThe idea behind this indicator is to have an expression for the amount of divergence on a given chart at every point in time . To achieve this, it adds up the magnitudes any valid divergence of any kind; bullish, bearish or their hidden variants. Where a valid divergence consists of a line on the source series (almost always the closing price), and a line on an oscillator (here: the RSI). The slopes of said lines must have opposite signs, that is to say, one line must be sloping up while the other slopes down. Said lines may not cross their respective series.
The length of the RSI is configurable (default length: 14). The lengths of the divergences are configurable (default: minimum length 3 and maximum length 28 - the latter being twice the default length of the RSI).
This indicator will detect divergences which are still building up. Be duly warned: upcoming divergences may still get invalidated. Another case that one should be very mindful of is that an upcoming divergence may still increase in magnitude before it plays out. Possibly over several more timesteps, there may even be entire additional drives.
The value of this indicator indeed reflects the magnitude of divergence on a chart. However, there is no reason to think the magnitude of a divergence affects the likelihood of said divergence playing out.
The color of the indicator indicates the kind of divergence. The default colors are
green for bullish divergence,
maroon (dark red) for bearish divergence,
lime/light green for hidden bullish divergence,
dark pink for hidden bearish divergence.
Please let me know if you would like to see a version of this indicator that plots both the RSI and this histogram. I will do this for personal use, but I am being a bit of a purist with this publication.
In fact, please don't hesitate to make any comment or to give any kind of suggestion.

Divergence FinderHello Fellow Traders!
Divergence Finder is a custom script built upon request from a PRO user to help find Divergences & Hidden Divergences using OBVM & Fractal Levels of Support and Resistance along with visuals and alerts. This script also only looks at the divergences that happen with the greater macro trend, meaning price is trending above the 200 EMA of the current period.
Features
----------------------
Custom Alerts are built into the script for manual or automatic trading.
Multiple MA's to show overall trend and EMA supports for manual traders
Custom icons to indicate BULL, BEAR, HIDDEN BEAR, HIDDEN BULL --> the ghost emoji means hidden
Alerts Added for every point
Visual Entry & Exit Points for each level
Visual Trend Bands
You can get access to any of my scripts by visiting my website below , all links are down below in my signature!

Rsx Divergence Candle OverlayRSX Divergences on candles instead of in an oscillator to save space.
Divergences do not repaint and have instant confirmation.
RSX source used: Lazybear's

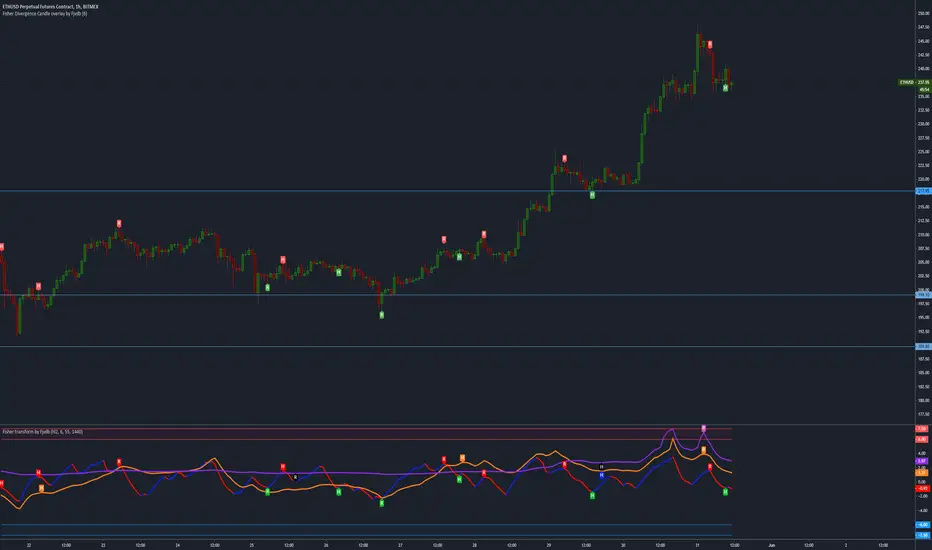
Fisher Divergence Candle OverlayOverlays Ehler's Fisher oscillator divergences on candles, handy for saving space on charts.
Stochastic Pro Suite (Zeiierman)█ Overview
Stochastic Pro Suite (Zeiierman) is a full stochastic trading framework built on top of an Efficient Price engine. Instead of feeding the oscillator with raw price data, the script first converts price into a volatility-aware, efficiency-weighted path called Efficient Price and then builds a stochastic on that foundation. Every major component, including EP Stochastic, Significant Stochastic Moves, divergence logic, inefficiency regimes, momentum impulses, and the multi-timeframe dashboard, reads from this refined stream.
The result is a stochastic that still behaves like the familiar 0–100 %K/%D oscillator, but with far more context behind every move. It doesn’t simply tell you where the price is within a recent high–low range; it tells you how reliable that move is, how clean the underlying regime is, and when the internal rotation is stretched. The tool works equally well for traders who like classic overbought/oversold swings and those who prefer higher-level context such as pressure bands, regime shifts, and impulse-driven moves.
⚪ Why This One Is Unique
Most stochastic indicators calculate %K and %D directly from the recent high–low range. Stochastic Pro Suite goes a step earlier in the chain. It first runs the chosen EP source (Close, Mean-reversion, or Trend) through a two-stage Efficient Price model that adapts to volatility, filters out random zigzags, and emphasizes directional quality. Only then is the stochastic calculation applied.
This means that when the oscillator hugs the top of its range, it’s not just reacting to any move up; it’s reacting to price movement that has already passed through an efficiency filter. Shallow, noisy moves tend to be down-weighted; clean, committed pushes stand out more. Around this EP Stochastic core, the script layers:
Significant Stochastic Moves to track internal pressure zones,
Divergence detection based on EP-Stochastic pivots,
An inefficiency layer that flags distorted regimes,
A momentum impulse engine focused on unusually strong surges, and
A dashboard that stitches everything together across multiple timeframes.
█ Main Features
⚪ EP-Based Stochastic
At the core is an EP-Stochastic built on Efficient Price instead of raw highs and lows. The oscillator keeps the classic stochastic look:
0–100 scale,
Upper and lower tension zones,
A midline representing balance,
Signal line via several moving-average types.
What changes is the input: instead of loosely tracking every tick, the EP engine compresses noisy swings and lets structured moves dominate the signal. This makes the stochastic more stable in directionally clean phases and more revealing when the market truly rotates.
You can choose between three EP behaviors to shape how the oscillator responds:
Close
The engine follows price almost one-to-one, but with the benefit of efficiency filtering. This setting is ideal if you want a familiar, general-purpose stochastic feel with fewer random spikes and more meaningful tests of the bands.
Mean-reversion
Here, the EP source emphasizes swing turns and back-and-forth rotation. The stochastic becomes a dedicated swing tool: transitions between upper and lower zones become more pronounced, and range-bound behavior is easier to read. This mode is well-suited for traders who fade extremes or trade oscillations inside a broader sideways structure.
To get better mean-reversal signals, increase the Stochastic Length to 200 and the Efficiency Length to 20.
Trend
In Trend mode, the EP source is smoothed to emphasize directional movement. When a trend is strong, the oscillator stays mostly in one half of its range and usually remains there until the trend begins to weaken. This makes it easier to see whether a pullback is just a pause in the trend or a sign that the structure is starting to roll over.
If you increase the EP Length, a more filtered trend will appear.
⚪ Significant Stochastic Moves
Instead of only watching fixed numerical levels like “80” or “20,” the suite identifies where the oscillator is trading within its own evolving range. Significant Stochastic Moves appear when the EP Stochastic pushes into internally important zones, areas where the market has historically shown heightened reaction or follow-through.
These highlights show when the stochastic is pressing into one of its key pressure zones. This helps you distinguish between normal rotation and moments where the internal push becomes strong enough to deserve attention. To identify significant moves, switch to Mean-reversion mode.
⚪ Divergence Detection
The script includes automatic detection of regular bullish and bearish divergences between the EP-Stochastic and price:
Bullish divergence: price makes a lower low while the EP-Stochastic prints a higher low.
Bearish divergence: price makes a higher high while the EP-Stochastic prints a lower high.
These are drawn directly on the oscillator pane with clear labels. Because the oscillator is driven by Efficient Price, many of the “random” divergences you see with standard stochastic are filtered out, leaving fewer but more structurally relevant signals, especially around extended trends, tight ranges, and turning points. To detect divergence, switch to Mean Reversion mode.
Since this divergence function is based on price-efficiency rather than traditional momentum swings, some divergences may appear a bit unconventional; however, the accuracy is on an entirely different level.
⚪ Momentum Impulses
Momentum impulses focus on moments when the oscillator accelerates unusually quickly relative to its own recent behavior.
Green circles near the upper region highlight powerful bullish surges.
Red circles near the lower region highlight powerful bearish surges.
The underlying logic exaggerates only the strongest deviations and ignores routine oscillation. These impulses often coincide with breakout thrusts, exhaustion spikes, sharp squeezes, or capitulation moves, places where the market briefly abandons its usual rhythm. They’re not a stand-alone trading system, but a visual cue that something unusually strong just happened in the stochastic structure.
⚪ Inefficiency Regime
The inefficiency engine monitors how orderly or distorted the combined price–stochastic behavior is. When the internal regime becomes noisy, spiky, or unbalanced, the script marks blue diamonds around the mid-region of the oscillator.
These diamonds tend to cluster when:
A previously clean trend starts to fragment,
A range becomes unstable and prone to fake breakouts,
Moves extend beyond what the recent structure would consider “normal.”
Used together with Significant Stochastic Moves, impulses, and divergence, these inefficiency markers help you distinguish between healthy follow-through and movement that is increasingly fragile.
⚪ Visual Multi-Timeframe Dashboard
On the right edge of the pane, a compact dashboard summarizes several key elements across 5M, 15M, 1H, 2H, 4H, and 1D:
Signals: immediate directional bias from the stochastic context,
OB/OS flags: stretched conditions by timeframe,
Divergence: where the structure disagrees with price,
Impulse: active momentum bursts,
Inefficiency: unstable or imbalanced regimes,
Explosive: high-energy conditions highlighted by Significant Stochastic Moves.
Think of it as a “stochastic climate map.” Instead of checking six separate charts, you get a quick snapshot of whether lower timeframes are in sync with the higher backdrop, or whether they are fighting each other. This is extremely helpful for multi-timeframe alignment and for deciding when to be aggressive versus when to stay defensive.
█ How to Use
⚪ Classic Stochastic Trading
Interpreting EP-Stochastic is similar to classic stochastic, but cleaner:
Sustained time above the midline signals a bullish rotational bias in the Efficient Price space.
Sustained time below the midline signals a bearish rotational bias.
When the oscillator repeatedly leans against the upper zone with a strong signal line, it indicates firm buyer control; when it leans against the lower zone with a soft or falling signal line, it indicates firm seller control.
When using “Close” as the EP Source, consider increasing the Efficiency Length to above 10 to produce more trend-like behavior.
⚪ Trend Trading
For trend trading, Trend mode is your core setting:
Use Trend mode with a moderate or slightly longer stochastic length.
Watch whether the oscillator lives mostly in the top or bottom half of its range.
Use the dashboard to see if higher timeframes show similar directional signals and OB/OS flags.
Impulse markers and Significant Stochastic Moves can be treated as continuation confirmations when they appear in the direction of the trend. Inefficiency diamonds and fading impulses act as early warnings that the current leg is losing coherence and may transition into consolidation or reversal. Inefficiency diamonds also signal imbalance in the market, where price can move quickly as the structure becomes unstable.
⚪ Pullback Trading
One useful workflow:
Run EP-Stochastic in Trend mode to define the dominant direction and regime.
Overlay a shorter, standard stochastic to spot pullbacks inside that regime.
When the EP-Stochastic clearly favors one side (mostly upper-half behavior in an up move, lower-half in a down move), wait for the short stochastic to cycle into its opposite extreme (oversold in an uptrend, overbought in a downtrend).
Entries during those counter-swings, especially when they coincide with impulse exhaustion in the opposite direction, often give cleaner, better-timed participation in the ongoing trend.
⚪ Overbought/Oversold Trading
Overbought zones represent strong buying pressure. When the stochastic becomes overbought, start watching for signs that buying pressure is fading.
If buying pressure continues, it typically indicates a strong bullish trend.
If the stochastic starts to decline and crosses back under the upper band, it can signal that buying pressure is weakening and a potential reversal is forming.
Oversold zones represent strong selling pressure. When the stochastic becomes oversold, start looking for signs that selling pressure is easing.
If selling pressure persists, it usually indicates a strong bearish trend.
If the stochastic begins to rise and crosses back above the lower band, it can signal that selling pressure is fading and a potential reversal is developing.
⚪ Mean-reversion Trading
Switch to Mean-reversion mode, increase the EP Source Length to 200, and reduce the Stochastic Length to 20 when you’re primarily focused on turning points and range rotation.
Look for clear spikes or peaks in the indicator, short-term bursts that quickly reverse. These moments often signal market conditions with a high likelihood of mean reversion, making a snapback in the opposite direction more likely.
⚪ Divergence Trading
When you want to focus on structural turning points rather than trend following:
Enable divergence detection.
Focus on divergences that form after extended moves or near the outer zones of the oscillator.
Bullish divergences emerging from deep lower regions can confirm early long ideas or justify scaling in as pressure transitions from aggressive selling to rotational buying. Bearish divergences out of extended upper regions can support profit-taking or exploratory short positions. The EP-Stochastic basis helps reduce “false” divergences that arise from random noise.
To get more divergence signals, consider switching to Mean-reversion mode and increasing the Efficiency Length to 20. Keep in mind that some divergences may appear “weird” or different from traditional divergence patterns—this is because they are based on Efficient Price, which uses a completely different detection engine in the background.
⚪ Breakout Trading
For breakout and breakdown scenarios, use:
Significant Stochastic Moves as evidence of a meaningful internal shift,
Impulse markers to confirm that the move is carried by strong momentum,
Inefficiency diamonds to recognize when the structure is becoming unstable.
When price breaks a level and the EP Stochastic prints a Significant Move in the direction of the break, backed by fresh impulses, it signals that the breakout is supported by internal strength.
⚪ Reversal Trading
Enable the reversal signals to identify potential turning points. Use them together with quick peaks in the stochastic oscillator. If the oscillator forms a peak and a reversal signal appears nearby, it strengthens the case for a reversal. However, if a reversal signal prints while the stochastic is simply leaning toward the upper or lower band without forming a clear peak, the signal carries less significance.
⚪ Interpreting Inefficiency Diamonds
Inefficiency diamonds highlight imbalance points in the market. When they appear, they signal that price and order flow are no longer in harmony, creating unstable conditions. These imbalance points often lead to sharp or sudden moves as the market snaps to correct the inefficiency.
Clusters of diamonds indicate a stronger imbalance and a higher likelihood of fast movement or abrupt shifts in direction.
⚪ Overview Panel
Use the multi-timeframe dashboard as a context checklist rather than a mechanical entry system. It quickly answers:
Are lower and higher timeframes pointing in the same direction?
Are multiple frames overbought or oversold at once?
Are impulses and inefficiency regimes showing up in isolation or in clusters?
█ How It Works
⚪ EP Source and Pre-EP Layer
The system begins by selecting an internal driver such as Close, Mean-reversion, or Trend. This source is evaluated through an efficiency model that measures how clean or noisy recent movement has been. Each increment is weighted by its structural quality and volatility conditions, producing a preliminary Efficient Price stream that favors meaningful directional progress over random chop.
Calculation: Applies efficiency weighting, volatility normalization, and adaptive length control. The output is a first-stage EP path that encodes directional reliability.
⚪ Main EP Engine and Adaptive Refinement
The preliminary EP stream is passed through a second refinement stage. This step smooths irregularities, boosts consistent movement, and remains sensitive to shifts in volatility regimes. The result is a fully refined Efficient Price path that forms the input for the EP-Stochastic rather than using raw highs and lows.
Calculation: Uses a second ER pass with volatility moderation and cumulative weighting. The output is the core Efficient Price trajectory used to build the EP-Stochastic.
⚪ EP-Stochastic Construction
Instead of calculating %K from raw price highs and lows, the oscillator is derived from where the refined Efficient Price sits within its own recent EP range. This keeps the stochastic familiar in shape but far more structurally coherent.
Calculation: Determines the EP range over the selected window, computes %K from EP’s position within that range, and applies optional smoothing for the signal line.
⚪ Inefficiency–Trend
This component evaluates the Efficient-Price-driven stochastic through two behavioral lenses: inefficiency and trend. Inefficiency highlights spike-driven, unstable, or imbalanced movement, while the trend component captures underlying slope, persistence, and regime strength. A smooth transition blends these two views depending on the system’s efficiency state.
Calculation: Computes an inefficiency score from ER deviation and a trend score from normalized regression slope. A smoothstep blend transitions between them, and diamond markers appear when the oscillator confirms it is operating inside an inefficiency regime.
⚪ Momentum Impulse
Momentum impulses isolate powerful rotations inside the EP-Stochastic. Only the sharpest acceleration bursts make it through, while routine oscillation is suppressed.
Calculation: Applies chained non-linear transforms to exaggerate extreme deviations, compares them to local historical envelopes, performs a cluster check to avoid false bursts, and marks impulses only when the deviation is structurally significant.
-----------------
Disclaimer
The content provided in my scripts, indicators, ideas, algorithms, and systems is for educational and informational purposes only. It does not constitute financial advice, investment recommendations, or a solicitation to buy or sell any financial instruments. I will not accept liability for any loss or damage, including without limitation any loss of profit, which may arise directly or indirectly from the use of or reliance on such information.
All investments involve risk, and the past performance of a security, industry, sector, market, financial product, trading strategy, backtest, or individual's trading does not guarantee future results or returns. Investors are fully responsible for any investment decisions they make. Such decisions should be based solely on an evaluation of their financial circumstances, investment objectives, risk tolerance, and liquidity needs.

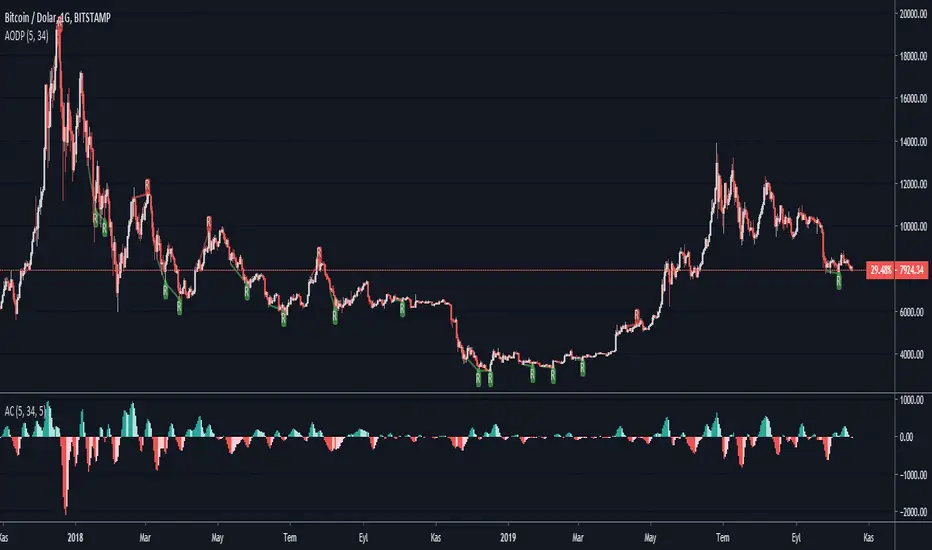
Accelerator Oscillator Divergence PointerThis script points regular and optionally hidden types of bullish and bearish Accelerator Oscillator divergences on the chart by drawing the divergence lines and optionally labels.
Hidden divergence is disabled by default, it can be enabled over settings window.
Regular divergence is enabled by default, it can be disabled over settings window.
There is an option to display the price channel additionally.
Alerts for all types of divergences.
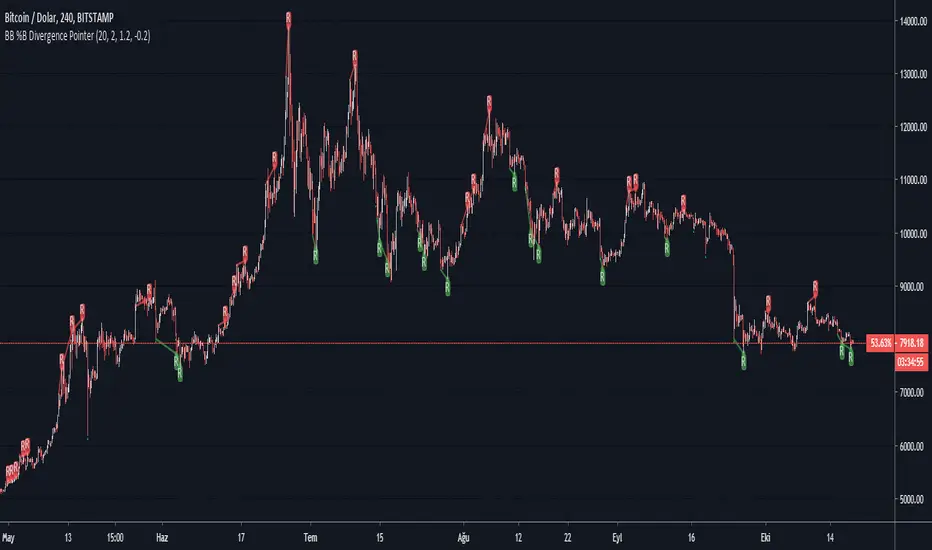
BB %B Divergence PointerThis script points regular and optionally hidden types of bullish and bearish Bollinger Band %B divergences on the chart by drawing the divergence lines and optionally labels.
Hidden divergence is disabled by default, it can be enabled over settings window.
Regular divergence is enabled by default, it can be disabled over settings window.
There is an options to display the price channel , bollinger band , Oversold and overbought levels additionally.
Supports alerts for all types of divergences.
Fisher Transform Divergence PointerThis script points regular and optionally hidden types of bullish and bearish Fisher Transform divergences on the chart by drawing the divergence lines and optionally labels.
Hidden divergence is disabled by default, it can be enabled over settings window.
Regular divergence is enabled by default, it can be disabled over settings window.
There is an option to display the price channel additionally.
Added alerts for all types of divergences.

OBV Divergence PointerThis script points regular and optionally hidden types of bullish and bearish OBV divergences on the chart by drawing the divergence lines and optionally labels.
Hidden divergence is disabled by default, it can be enabled over settings window.
Regular divergence is enabled by default, it can be disabled over settings window.
There is an option to display the price channel additionally.
Added alerts for all types of divergences.
