Double Moving Average█ OVERVIEW
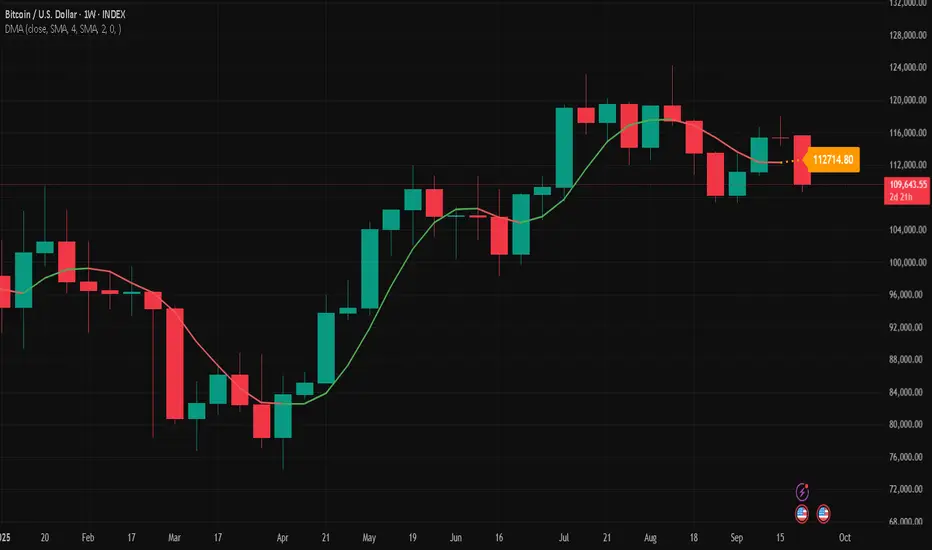
The Double Moving Average (DMA) smooths one moving average with a second moving average.
Includes moving average type, higher timeframe, offset, alerts, and style settings for all of the indicator's visual components. This indicator includes an optional line and label to indicate the latest value of the DMA that repaints.
█ CONCEPTS
Shorter term moving averages, especially in choppy markets, can rapidly increase and decrease their slope. Which could lead some traders into assuming that the series trend may continue at that steeper slope. By smoothing a moving average with another one, the magnitude of rapid choppy movements is mitigated.
█ FEATURES
DMA Customization
Most inputs have a tooltip that can be read by interacting with the information icon to guide users.
For both moving averages in the DMA, users can set the lookback length and moving average type independently. Available moving average types include:
Simple Moving Average
Exponential Moving Average
Hull Moving Average
Weighted Moving Average
Volume Weighted Moving Average
A bar offset setting is included for shifting the indicator's placement. Using different lookback combinations for both averages alongside an offset can create equivalent values of other types of moving averages not included in this indicator. For example, if the default lookback settings are offset by 1 bar, this duplicates a 4 period centered moving average.
Colors for the DMA's plot can toggle between a single "base" color, or using increasing and decreasing colors. Changing the plot's style, line style, and width is also supported.
Latest Value Line and Label
The latest value of the DMA plot is replaced by default with a feature called the Latest Value Line and Label: a stylized line and label to help indicate the part of the indicator that can repaint from the parts that don't repaint. Data used to draw this feature is calculated separately from the indicator's confirmed historical calculations.
A label is included to display the latest value of the DMA which includes complete style settings. The style of both the line and label are completely customizable; every style feature that can be included has a corresponding input you can set.
Toggling off the Latest Value Line and Label feature will cause all the respective style inputs to deactivate so that they're no longer in focus or editable until the feature is toggled on again.
Higher Timeframes
Users can plot the DMA from higher timeframes on their chart.
As new bars print, the non-repainting DMA historical plot uses the last confirmed higher timeframe value. The repainting Latest Value Line and Label will update with the most recent higher timeframe value only for the latest bar. If the Latest Value Line feature is toggled off, the last confirmed higher timeframe DMA value is plotted up to the latest bar.
The built-in Moving Average Simple (SMA) indicator includes several of the features in this indicator, like an option for using higher timeframe. However, by default, it plots no values except on bars with higher timeframe close updates. Disabling "Wait for timeframe closes" to get values between updates causes repainting in both replay mode and realtime bars.
Since the calculations that repaint are separate and optional in the DMA indicator, historical plotted values will not repaint in replay mode or on realtime bars while using higher timeframes.
Alerts
There are two DMA value options when creating an alert:
DMA Latest Value: Use the latest updating DMA Value. The same value as the Latest Value Line.
DMA Last Confirmed Value: Use the last historical closed DMA value.
The default alert option is DMA Latest because most users expect alerts when the price crosses the latest updating DMA value. The Last Confirmed Value alert option uses the DMA value from the latest confirmed historical bar.
When creating an alert you should see a "Caution!" warning saying, "This is due to calculations being based on an indicator or strategy that can get repainted." This warning is intentional because the DMA indicator's Latest Value Line and Label feature is supposed to repaint in order to display the latest value.
█ FOR Pine Script™ CODERS
StyleLibrary is used to create user-friendly plot, line, and label style enum type inputs. The library's functions then take those user inputs and convert them into the appropriate values/built-in constants to customize styles for plot, line, and label functions.
Titles for #region blocks are included after #endregion statements for clarity when multiple #endregion statements occur.
This indicator utilizes the new active parameter for style inputs of togglable features.
DMA
Common DMAs with LabelsHere's a short description for publishing:
Common Daily Moving Averages (DMA) Indicator with Smart Labels
Displays the most widely-used moving averages that professional traders watch: 5, 10, 20, 50, 100, and 200 DMAs with clear color-coding and descriptive labels.
Key Features:
Smart Labels - Each DMA shows its trading purpose (Day Trading, Swing Trading, Bull/Bear Line, etc.)
Customizable Display - Toggle any DMA on/off individually
Golden/Death Cross Alerts - Optional 50/200 crossover signals
Live Status Table - Shows current DMA values vs price with up/down arrows
Professional Styling - Color-coded lines with appropriate thickness (200 DMA emphasized)
Perfect for:
Multi-timeframe trend analysis
Support/resistance identification
Bull/bear market confirmation
Entry/exit timing
Usage: Add to chart, customize which DMAs to display in settings. Labels appear on the right showing each average's trading significance. Enable the status table for quick price-vs-DMA reference.
Ideal for both beginners learning key moving averages and experienced traders wanting a clean, informative DMA setup.

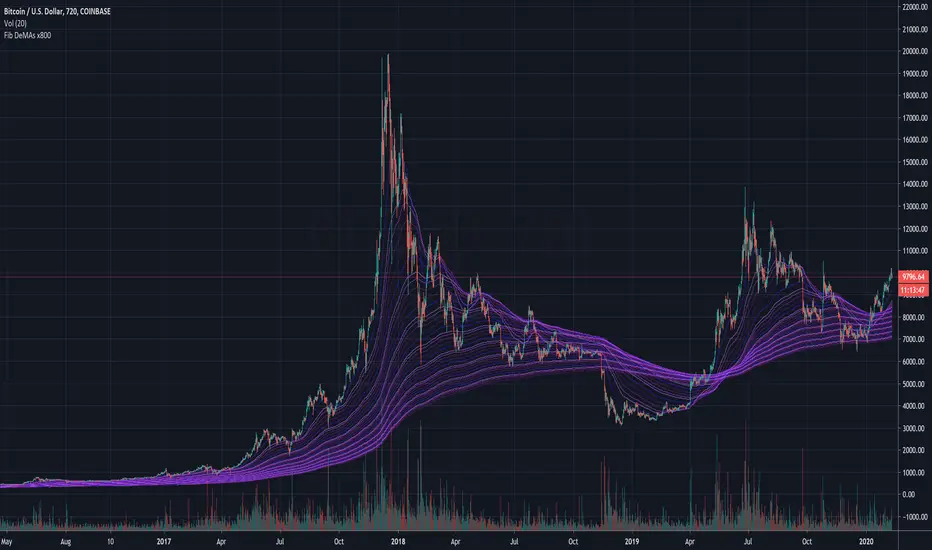
Onchain Analysis - BTCIntroduction
This indicator is designed to equip traders with actionable insights into long-term BITSTAMP:BTCUSD market dynamics through a blend of on-chain metrics and technical tools. It provides a streamlined visualization of market sentiment and critical price levels using unique and proprietary methodologies.
The script features:
NUPL (Net Unrealized Profit/Loss) with advanced bar color coding.
350DMA and 350DMAx2, offering insights into key Bitcoin cycle levels.
Logarithmic Fibonacci Extension, aiding in precise target setting during price discovery phases.
Core Functionality
NUPL Analysis
NUPL reflects the network's aggregate unrealized profit or loss, calculated as (Market Cap − Realized Cap) / Market Cap. Bars are color-coded dynamically to simplify the interpretation of market sentiment. The emotional states (e.g., euphoria, fear) are visually represented for quick analysis, making this indicator particularly valuable for traders monitoring Bitcoin's macro cycles. This implementation improves clarity by aggregating NUPL across all holders rather than separating short- and long-term holders.
350DMA and 350DMAx2
The 350DMAx2 line has historical relevance as a key level during Bitcoin bull cycles, often acting as a resistance point during price rallies. This implementation also includes precise visualization of price interaction with the 350DMA, enabling traders to anticipate potential retracement or breakout zones. Furthermore, to minimize chart clutter, the 350DMA and 350DMAx2 lines are designed to dynamically appear only when the price is near these levels. This ensures that traders can focus on relevant data without unnecessary visual distractions.
Logarithmic Fibonacci Extensions
Unlike traditional Fibonacci extensions, logarithmic levels better suit assets like Bitcoin that grow exponentially. The calculated levels provide traders with clear targets in price discovery phases, enhancing the utility of this feature.
Key Advantages and Unique Features
Enhanced Visualization : NUPL bar color-coding simplifies sentiment analysis, allowing traders to instantly identify key turning points in market psychology.
Historical Context : The script incorporates insights derived from past market cycles, emphasizing the significance of 350DMAx2 levels.
Customization : Traders can adapt settings like lookback periods (e.g., 500 for daily, 100 for weekly) to fit their preferred timeframe and trading strategy.
Proprietary Insights : The script integrates logarithmic Fibonacci levels in a unique manner, optimizing their application to logarithmic assets.
Why This Indicator is Valuable
This indicator is not a simple combination of existing tools; it is a carefully curated suite of functionalities designed to address specific needs of crypto traders. The advanced NUPL representation and integration of logarithmic Fibonacci make it a distinct addition to any trader's toolkit. It provides clarity in interpreting long-term trends and offers actionable insights for navigating Bitcoin's cyclical nature.
How to Use
NUPL Monitoring
Pay close attention to initial color changes, e.g. orange and red, since it may establish clear pull-back. Especially, when bars turn black, it suggests that the market is heavily in profit, often signaling a market top.
350DMAx2 Interaction
If the price is trading below or near the 350DMAx2 level, it often reflects a key resistance zone. Historically, price rejections from this level are common, offering traders critical insights into potential retracement scenarios.
Logarithmic Fibonacci Extensions
Logarithmic Fibonacci extension levels are especially valuable for assets like BITSTAMP:BTCUSD , which exhibit logarithmic growth. These levels provide:
Target Identification: During price discovery phases, the logarithmic Fibonacci levels act as critical resistance or support points, enabling traders to set realistic price targets.
Market Top Detection: When extreme NUPL values (e.g., black bars) align with price interaction near logarithmic Fibonacci levels, the likelihood of a market top increases significantly. This alignment offers a robust method for identifying overbought or overextended market conditions.
Combining Concepts
When NUPL's extreme signals (e.g., red or black bars) align with price movements near the 350DMAx2 level, the likelihood of a significant pullback increases. Additionally, these scenarios can be further validated by observing logarithmic Fibonacci resistance levels, which can provide added confidence in identifying market tops during price discovery phases.

Daily Moving Average for Intraday TimeframesThis indicator provides a dynamic tool for visualizing the Daily Moving Average (DMA) on intraday timeframes.
It allows you to analyze how the price behaves in relation to the daily moving average in timeframes from 1 minute up to 1 day.
KEY FEATURES
DMA on Intraday timeframes only : This indicator is designed to work exclusively on intraday charts with timeframes between 1 minute and 1 day. It will not function on tick, second-based, or daily-and-above charts.
Color-Coded Zones for Trend Identification :
Green Zone: The price is above a rising DMA, signaling a bullish momentum.
Red Zone: The price is below a falling DMA, signaling a bearish momentum.
Yellow Zone: Signaling uncertainty or mixed conditions, where either the price is above a falling DMA or below a rising/flat DMA.
Configurable DMA Period : You can adjust the number of days over which the DMA is calculated (default is 5 days). This can be customized based on your trading strategy or market preferences.
24/7 Market Option : For assets that trade continuously (e.g., cryptocurrencies), activate the "Is trading 24/7?" setting to ensure accurate calculations.
WHAT IS THE DMA AND WHY USE IT INTRADAY?
The Daily Moving Average is a Simple Moving Average indicator used to smooth out price fluctuations over a specified period (in days) and reveal the underlying trend.
Typically, a SMA takes price value for the current timeframe and reveal the trend for this timeframe. It gives you the average price for the last N candles for the given timeframe.
But what makes the Intraday DMA interesting is that it shows the underlying trend of the Daily timeframe on a chart set on a shorter timeframe . This helps to align intraday trades with broader market movements.
HOW IS THE DMA CALCULATED?
If we are to build a N-day Daily Moving Average using a Simple Moving Average, we need to take the amount of candles A needed in that timeframe to account for a period of a day and multiply it by the number of days N of the desired DMA.
So for instance, let say we want to compute the 5-Day DMA on the 10 minute timeframe :
In the 10 minute timeframe there are 39 candles in a day in the regular session.
We would take the 39 candles per day and then multiply that by 5 days. 39 x 5 = 195.
So a 5-day moving average is represented by a simple moving average with a period of 195 when looking at a 10 minute timeframe.
So for each period, to create a 5-day DMA, you would have to set the period of your simple moving average like so :
- 195 minutes = 10 period
- 130 minutes = 15 period
- 65 minutes = 30 period
- 30 minutes = 65 period
- 15 minutes = 130 period
- 10 minutes = 195 period
- 5 minutes = 390 period
and so on.
This indicator attempts to do this calculation for you on any intraday timeframe and whatever the period you want to use is for your DMA. You can create a 10-day moving average, a 30-day moving average, etc.

Gate Signal by Market yogiThis indicator is made by Nischay Rana (Market Yogi)
How to use this Indicator
This is simple group of 8 moving averages, which can be configured in various ways according to your trading requirement.
1. moving average ribbon
2.moving average channel
3.moving average gate signal
4.This indicator has bonus indicator of bollinger bands inbuilt.
Logic:
As price has tendency to get closer to their moving averages. The logic behind this indicator is to use the contraction and expansion concepts of moving averages to find best entry exit points.
This nature of Price action is use to capture the big move after the convergence of all moving averages.
CAUTION : Do not blindly trade the gates as gate has tendency to break out on either side. So use this indicator in confluence with price action and other technical analysis to capture bigger moves.
Higher the gate width more gates are found. Similarly lesser the gate width less gate are found. i.e. Tight squeeze of all the moving averages.
"ENJOY HAPPY TRADING.."
Truly Yours Market Yogi

DiNapoli DMA TableThis indicator displays a table containing the Displaced Moving Averages (DMA) from Current and Higher Timeframes: a green background denotes a Bullish Market in relation to that particular DMA, and a red one denotes a Bearish Market.
Only Higher Timeframes states do appear in the table. Lower Timeframes are grayed out, due to inability to get reliable results for such behaviour in current Tradingview environment.
The position of the table can be customized through the input panel.
Note: This indicator is demanding in terms of resources, and it might take some seconds to fully populate the table.

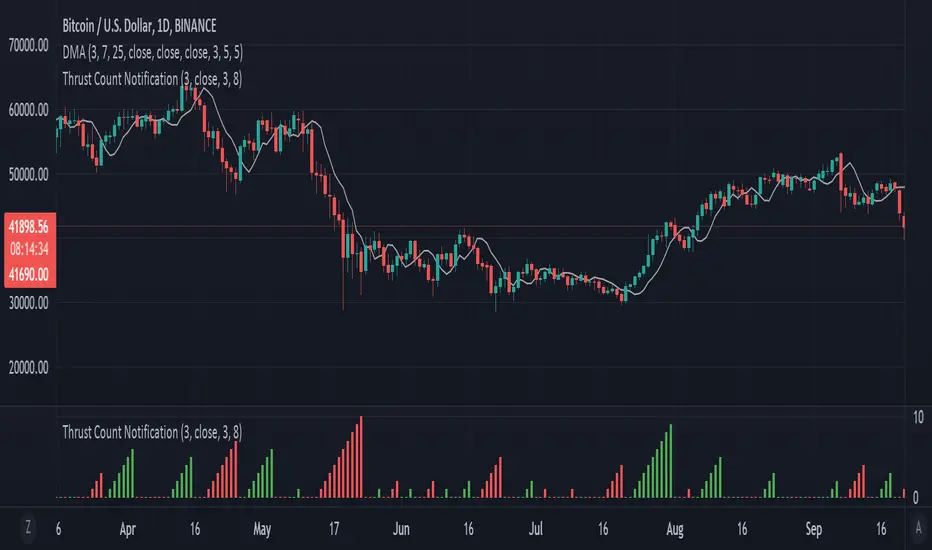
DMA Thrust Count NotificationCount thrust after price cross 3x3 DMA
This use 3 SMA with 3 offset line to check with price and count thrust.
Thrust will be resetted every cross
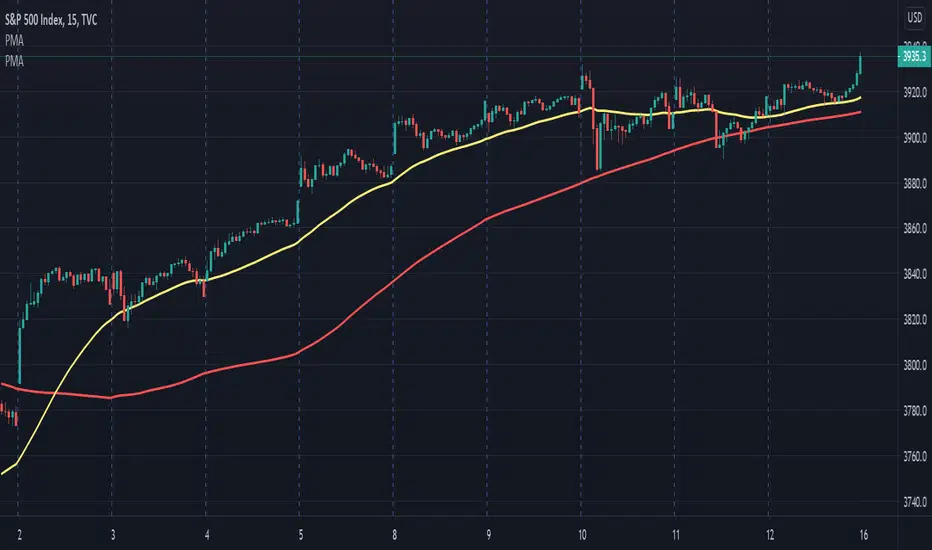
Moving Average PeriodicalPMA derives the length of its rendered SMA from the number of periods (example: 5 days) and the length of the period (example: 390 minutes)
The result is an indicator that should be the same across different time-frames of the same type. Allowing for the simple calculation and generation of a Daily Moving Average like the 5 Day SMA (the default for minute based time-frames).
Custom Moving Average (EMA & SMA)This script is a custom visualization tool to plot 4 Moving Averages (MA).
Each MA is customizable; you can:
enable (disable) the plot of MA;
select whether the MA is an EMA or an SMA;
the length;
the source (open, close, ...);
the offset value (default is 0).
Note:
The 1st MA is an EMA with length 50.
The others MAs are SMA with length 9, 30 and 100 respectively.

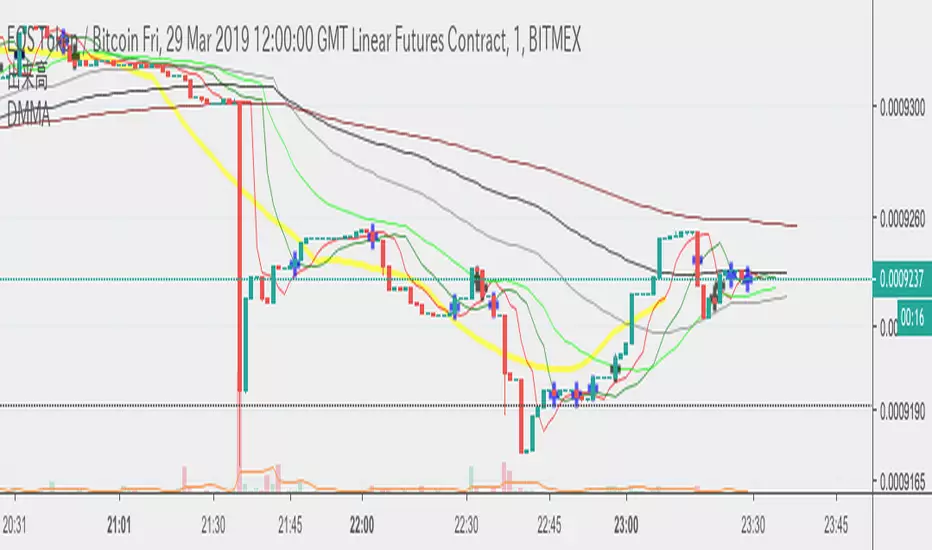
Underdog Trading Signal SystemBased on & modified from popular ATR strategies, This is our very own buy and sell signals system. it should work on any pair, with standard settings, from btcusd , to us30.
It does work on most time frames, but with standard settings, i find the best results come from 15m time frames and 4h, along side general charting knowledge, this is a very powerful tool.
The printed line on the chart is a DMA (displaced Moving Average) which can be used for finding the trend direction, so if the price is above the DMA, only take the long positions, and if below, only take shorts.
The entries are designed to show you the direct buy and sells (as i said above), but also, will show you potential reversals, if the price is on the wrong side of the DMA.
As usual, if you have any further questions on how this system works, or if you wish to get access to this system, please DM on TradingView or follow the links below to find out more.
Look forward to hearing from you
TradingSargentAlpha @ UnderdogTrading

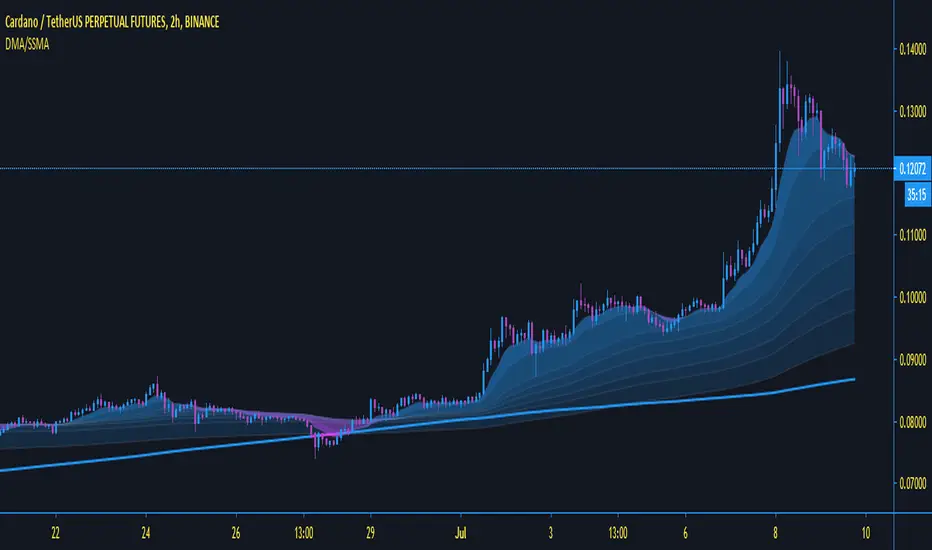
DMA AND SMMA This "on chart" indicator is used purely as a visual sentiment to directional momentum of the pair you are looking at.
it is split into two parts, both of which i will explain below.
1, The SMA (purple and blue fading visual mas) this is used to find the directional momentum
2, the DMA (a slightly delayed Moving Average), is used to decide if the market is in a bullish or bearish move, hence determining whether or not to go long or short.
-only go long when price above DMA, and short, below.
i have found it very good at calling out bad trades, when the direction changes quickly.
same as all my other indicators this is fully adjustable in the settings.
i find, with the standard settings, it works best on the 2 hour timeframe as shown, but again, can be used on any time frame.
For access, send me a DM on TradingView
DMA: Moving Average of OscillatorTechnical Indicator Moving Average of Oscillator (Moving Average of Oscillator OsMA) is the difference between the oscillator and oscillator smoothing. In this case, an oscillator is used the basic MACD line and the smoothing of the signal.
Calculate:
OSMA = MACD - SIGNAL
MACD = EMA(CLOSE, 12) - EMA(CLOSE, 26)
SIGNAL = EMA(MACD, 9)

DMA: ADX L30A modified version of the ADX indicator
Indicator average directional movement ( ADX ) helps traders determine the strength of the trend, not its actual direction. It can be used to determine whether changes in the market or starts a new trend. It refers to the average directional movement Index (DMI), and, in fact, included DMI ADX line . The oscillator ranges from 0 to 100, where high values noted a strong trend and low readings indicate a weak trend. It is often combined with directional indicators. The indicator was developed by Welles Wilder, who has created several leading trading indicators.
Disconnected the lines DI and set the horizontal level 30
-----
Модифицированная версия индикатора ADX .
Индикатор среднего направленного движения ( ADX ) помогает трейдерам определить силу тренда, а не его фактическое направление. Его можно использовать, чтобы выяснить, меняется ли рынок, или начинается новый тренд. Он относится к Индексу направленного движения (DMI) и, фактически, в DMI включена линия ADX . Осциллятор колеблется от 0 до 100, где высокие показания отмечают сильный тренд, а низкие показания указывают на слабый тренд. Он часто комбинируется с направленными индикаторами. Индикатор был разработан Уэллсом Уайлдером, который создал несколько ведущих торговых индикаторов.
Отключены линии DI и установлен горизонтальный уровень на значении 30

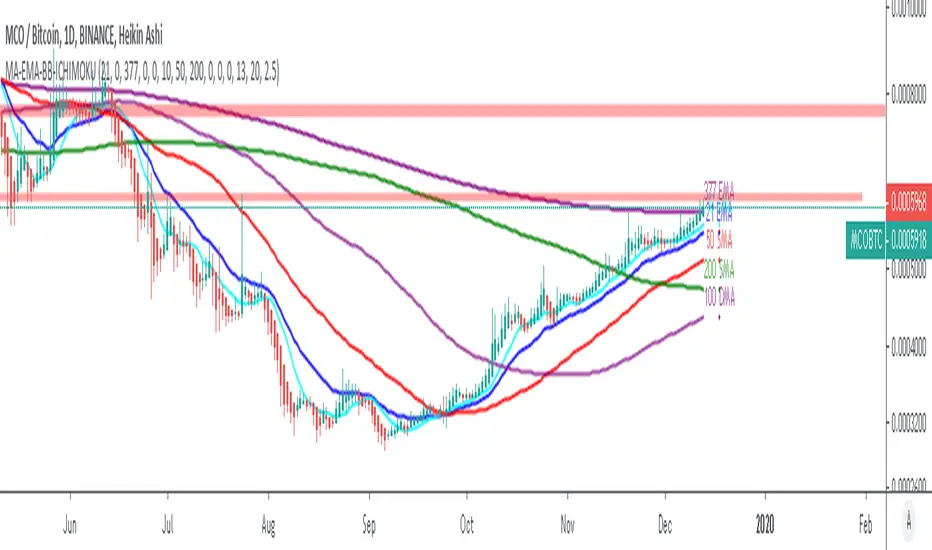
MA - EMA - DMA - ICHIMOKU - BOLLINGER BANDS - SUPPORT RESISTANCE*** FREE ACCESS ***
JUST ADD THE SCRIPT
Multiple indicators in a single script
Moving Average, Exponential Moving Average, Displaced Moving Average, Ichimoku, Bollinger Bands and Support / Resistance
I hope that you will enjoy this script,
Take care
MA-EMA-BB - NakajimaSome MA and EMA that you can hide/show
Bollinger Bands
Ichimoku
Fibonacci
Fractals

Daily Moving Averages(10,20,50,200)This is a simple script displaying the common daily moving averages I use:
the 10dma, 50dma, 200dma, and an optional 20dma.


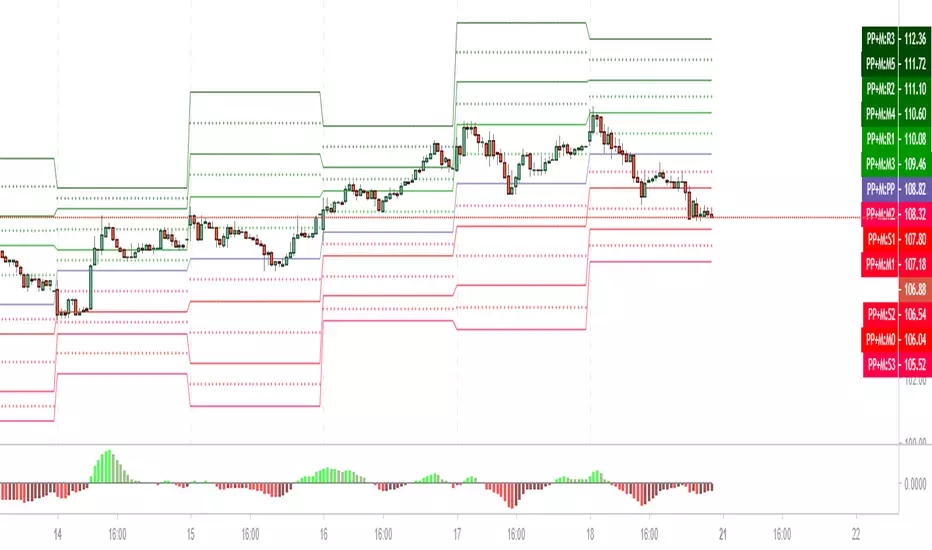
DMA: Pivot Point + Medians
Опорная точка (Pivot Point) – это уровень цены изменения направления рынка в конкретный день.
Зная уровни максимума, минимума и закрытия предыдущей сессии, и произведя простые арифметические действия, мы получим значения уровней поддержки и сопротивления.
Отличие этого метода анализа в том, что он помогает составить картину о направлении движения рынка на следующий день. Т.е. это очень удобный инструмент для торговли внутри дня, для интрадея.
Зная уровни закрытия, максимума, минимума дня сегодняшнего – можно рассчитать разворотные точки на день завтрашний.
Ввиду популярности данной теории, рынок часто реагирует на эти уровни.
Данный индикатор рассчитывает не только основные уровни Pivot Point (Floor), но и так называемые средние, медианы.
Формула расчета медиан:
Median0 = (S3 + S2)/2
Median1 = (S2 + S1)/2
Median2 = (S1 + Pivot)/2
Median3 = (PivotPoint + R1)/2
Median4 = (R1 + R2)/2
Median5 = (R2 + R3)/2
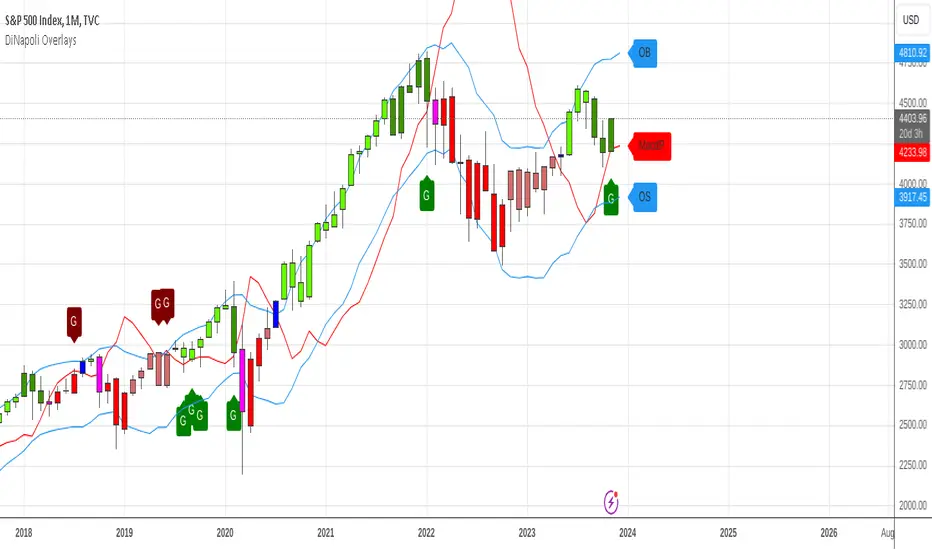
DiNapoli Bundle Overlay (4-in-1)DiNapoli Overlays 4-in-1 is a Bundle that includes the 4 studies used by DiNapoli in the price chart in just 1 single indicator :
DiNapoli Color Candles
DiNapoli MACD Predictor (MacdP)
DiNapoli Oscillator Predictor (OscP)
DiNapoli DMAs
This Bundle version includes the following features :
Ability to select multiple Overlay Studies to be plotted: Colored Candles, MacdP, OscP, DMAs
Show/Hide each indicator
Show/Hide each DMA
Plot Stop Grabbers
Set OB/OS Oscillation Period
Set OB/OS Factor Ratio to each Market
Show OB/OS Levels
Show Preceding OB/OS Cloud
For convenience it also includes Custom Alerts . Now it is possible to get alerts on:
Signal DiNapoli Cycle Shift
New DiNapoli Bull Cycle
New DiNapoli Bear Cycle
Signal DiNapoli Cycle Strength
DiNapoli Bull Cycle Strength
DiNapoli Bear Cycle Strength
Signal DiNapoli Cycle Weakness
DiNapoli Bull Cycle Weakness
DiNapoli Bear Cycle Weakness
MACDP Cross
MACDP Bullish Cross
MACDP Bearish Cross
Stop Grabber
Bullish Stop Grabber
Bearish Stop Grabber
OverBought Condition
Entering OverBought Condition
Exiting OverBought Condition
OverSold Condition
Entering OverSold Condition
Exiting OverSold Condition
DMA Cross
Bullish DMA Cross
Bearish DMA Cross
This indicator is meant to be used by professional traders.
If you would like to subscribe , please send me a private message.
DiNapoli DMAsDiNapoli Displaced Moving Averages (DMAs) plots in a single indicator the 3 DMAs used to define the trend condition in markets.
This version of the indicator includes the following features :
Show/Hide each one of the DMAs independently
Show Labels for better identification
This indicator is meant to be used by professional traders.
If you would like to subscribe , please send me a private message.
