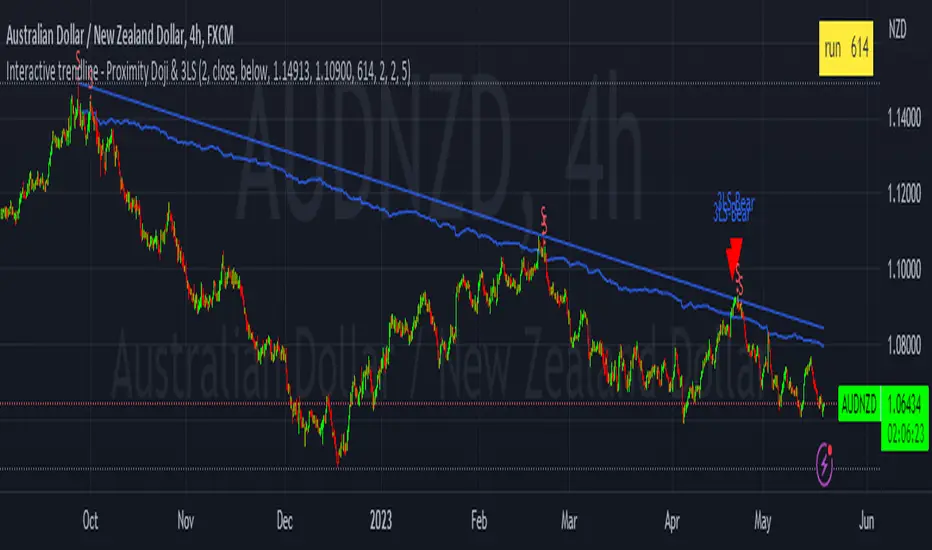
Interactive trendline - Proximity Doji & 3LSThis script was developed with Blockhead305 (seriously talented) and uses 1) the Three Line Strike from The Moving Average as well as 2) an original doji script written for me and 3) the Interactive Trendline as developed by Blockhead305. The basic premise is that should a doji or Three Line Strike occur within a customizable ATR distance from your trendline, an on-chart notification will appear or you could set an alarm to warn you if this has happened.
How to set this up:
Step 1 - Find a a trend
Step 2 - Identify the candles that touches the trendline
Step 3 - Click on the indicator
Step 4 - Set the X1 and Y1 coordinates for the start of the trend
Step 5 - Set the X2 and Y2 coordinates for the last relevant candle of the trend
Step 6 - Write the number in the yellow box down (in this case 880)
Step 7 - Open the settings of the indicator
Enter the number from the yellow box into the box titled "Run" - Press "OK"
Step 8 - Chart should/could now show Buy/Sell Signals for the Dojis and/or Bullish or Bearish Three Line Strikes
Notes
1. If your trendline is bearish (X1/Y1 is higher than X2/Y2) only bearish signals will appear and vice versa
2. You can change the ATR multiples from trendline in the settings - I prefer 2 (which is also the default)
3. You can toggle Big Engulfing and/or Three Line Strike on or off (exact functionality as per The Moving Average functionality)
4. You can construct the type of doji you would like to see at the bottom of the settings screen - I prefer the following settings:
Dominant Wick Multiple - 2
Recessive Wick Multiple - 2
Body Multiple - 5
5. I place my SL above last high (shorts) or last low (longs) but could also use the trendline for this
6. I use TP with RRR off 1:2 but much more is obviously possible.
7. ONLY ONE INTERACTIVE TRENDLINE CAN BE USED ON THE SAME CHART
8. THE NUMBER IN THE YELLOW BOX IS RELEVANT TO THE TIMEFRAME THAT THE TRENDLINE WAS CREATED ON. IF YOU CHANGE
TIMEFRAMES IT WILL NOT WORK
Happy to receive constructive criticism and/or suggestions for improvements on the settings.
Doji
Doji Pattern 1 Hr BY J.GrimanPatron de Doji de cuerpo real, para el periodo de tiempo en 1 Hora para los mercaods bursatiles.

DojiCandle body size RSI-SMMA filter MTF
DojiCandle body size RSI-SMMA filter MTF
Hi. I was inspired by a public script written by @ahmedirshad419, .
I thank him for his idea and hard work.
His script is the combination of RSI and Engulfing Pattern.
//------------------------------------------------------------
I decided to tweak it a bit with Open IA.
I have changed:
1) candle pattern to DojiCandle Pattern;
2) I added the ability for the user to change the size of the candlestick body;
3) Added SMMA 200;
4) Changed the colour of SMMA 200 depending on price direction;
5) Added a change in the colour of candlesticks, depending on the colour of the SMMA 200;
6) Added buy and sell signals with indicator name, ticker and close price;
7) Added ability to use indicator on multi time frame.
How it works
1. when RSI > 70 > SMMA 200 and form the bullish DojiCandle Pattern. It gives sell signal
2. when RSI < 30 < SMMA 200 and form the bearish DojiCandle Pattern. It gives buy signal
settings:
basic setting for RSI, SMMA 200 has been enabled in the script to set the levels accordingly to your trades
Enjoy

Minimalist Doji HighlighterThis minimalism focused indicator was designed specifically to highlight doji candles (gravestone, long-legged, and dragonfly) that generally signal indecision/neutrality within price structure to improve trading accessibility for the disabled/visually impaired, visual charting cues or pattern visibility, and educational/learning purposes.
HOW TO USE IT:
Highlight doji candles to improve visual cues on chart.
Default size of 0.15-0.02 works best, yet can be modified thus ensuring flexibility of use and experimentation.
Additionally, there is an option to add crosses above doji candles for additional visual cues; this feature is set to false by default to avoid cluttering charts.
MARKET USAGE:
All time frames and assets.
MARKET CONDITIONS:
All conditions.

Doji FinderModified version of HPotter's "Doji and Near Doji automatic finding script".
Candles are classified based on not just the size of the body but also the distance from the close to the high/low. This avoids classifying a reversal candle with a long wick but a strong close as a doji.

CANDLE FILTER Todays scripts is based on my Pullback And Rally Candles with other meaningful candles such as Hammers and Dojis.
You can choose which Candles to show on the cart and if you want to candles to appear above or below a moving average.
If you follow my work, you may recognise some of these candles which I'm about to show you however these candles are 1) more refined and 2) has moving average filters.
Ive included a D,6H,1H Candle in this script as on different timeframes - each swing low on average has a different amount of bars within the swing low / swing high so the DPB and RD will only work on the Daily
//Pullback candle
This candle is very powerful when used with simple Price Action such as Market Structure//Demand zones and support zones. (((((WORKS BEST IN UPTRENDS AND BOTTOM OF RANGES)))))
Ive included a D,6H,1H Pullback Candle in this script as on different timeframes - each swing low on average has a different amount of bars within the swing low so the DPB will only work on the Daily
//DAILY PULLBACK (Swing Traders)
snapshot
//4H PULLBACK (Swing Traders)
snapshot
- this signal will produce more signals due to the swing low filter on the 4H
//1H PULLBACK
snapshot
- this signal has been refined due to too many candle displaying in weak areas
!!!IF YOU DONT WANT TO USE PULLBACKS DURING DOWNTRENDS THEN USE THE EMA FILTER TO TURN OFF THE PULLBACKS WHEN PRICE IS BELOW THE MOVING AVERAGE!!!
//Rally candle (My personal Favourite) (((((WORKS BEST IN DOWNTRENDS AND TOP OF RANGES)))))
This candle is very powerful when used with simple Price Action such as Market Structure//Supply zones and Resistance zones.
//DAILY RALLY(Swing Traders)
snapshot
//4H RALLY(Swing Traders)
snapshot
- this signal will produce more signals due to the swing high filter on the 4H
!!!IF YOU DONT WANT TO USE RALLIES DURING UPTRENDSTHEN USE THE EMA FILTER TO TURN OFF THE RALLIES WHEN PRICE IS ABOVE THE MOVING AVERAGE!!!
//POWERFUL DOJIS (INDECISION)
snapshot
We look for indecision in key areas to see if momentum is shifting. When combined with Pullbacks or Rallys - this will enhance the odds of a probably area.
//HAMMERS
snapshot
//MOVING AVERAGES
snapshot
Short EMA = 50
Long EMA = 200
This filter can be used when the market is trending - look out for rejections off the moving averages
Also you can chance the Short And Long EMA to choose which MA cross you want to use
snapshot
ALSO ALL THE CANDLES HAVE A ALERT CONDITIONS WHICH YOU CAN ACCESS - THIS WILL ALERT ANY CANDLE YOU CHOOSE
Please leave a like/comment on this post as this is much appreciated....

Signals Pirate™ Doji ScalperSignalsPirate™ Doji Scalper is provides users with an instant screener for the one of the most useful candlestick formations in trading and investing, while also providing signals for points of price reversals and variable levels of support and resistance! This package can take your technical analysis to the next level.
Doji candles are a great indication of indecisiveness in the market, and depending on when they occur can indicate upcoming volatility or even a trend reversal! The candles can be identified by their small bodies (distance between open and close price) and long top and bottom wicks (the candle high and lows).
The simplicity of this package ensures traders of all levels of expertise can utilise this tool and experience its benefits to the fullest. Outside of user preference and customisation options, the only variable that alters package performance is the ‘Sensitivity’ option, which dictates how frequently Doji candles will be detected based on how the candles are formed. A value of 10 indicates more lenient classification of Doji candles, where a value of 1 requires a perfect Doji formation before signalling!
The other options available for your alteration are:
The visibility of the variable levels of support and resistance, which are calculated using a variation of the ATR indicator to gauge asset volatility, as well as price action pivot points to indicate where trader interest may be.
Trend reversal labels for both potentially ‘Weak’ and ‘Strong’ reversals. These labels are created based on how price reacts to the varying levels of support and resistance, as well as the candlestick pattern and formation around those crucial levels.
The default settings are the best settings we’ve found so far but you can change them to build your own unique trading strategy. We’d recommend experimenting with these values to find the best results for the asset you are trading, and your own personal trading and investing style.
Direction for use:
1. Use on any asset class and time frame.
2. Fine tune the Doji Sensitivity variable.
3. Be cautious of upcoming volatility after a Doji signal, especially if the signal occurs near the support and resistance levels or after a large move, which could indicate a trend reversal.
4. Watch for Reversal signals, which can provide confluence with the Doji signals and give an early indication that price may soon start moving in the opposite direction.
As mentioned previously, this is a candlestick detection system that dynamically operates to function with superior accuracy regardless of what you’re trading. But with the level of customisation available, this can easily be fine tuned to accommodate scalping, reversal trading, or even long term investing.
We hope you love this package, and it takes your trading and investing to the next level. Please let us know if you have any questions or queries regarding the logic behind the bundle, or if you have any suggestions for improvements etc. We love your feedback and are constantly striving to continuously improve!

Smarter Pullback + Candlestick Pattern (Steven Hart)Built with love "Smarter Pullback + Candlestick Pattern"
This indiator will help you to find a Pullback + Candlestick Pattern, inspirated by Steven Hart
You can combine with your own strategy, or use this purely
DISCLAIMER :
Measure the risk first before use it in real market
Backtest The Strategy was very important, so you know the probability
Fundamentally Logical :
Pullback (Some Previous candle is Red for Bull Pullback vice versa)
the Entry candle must be a Candlestick Pattern
Features :
1. Engulfing
2. Hammer & Shooting Star
3. Doji
How to use it :
1. Adjust the Pullback Period
2. Check and Uncheck the Pattern you want to see
3. Adjust the style to your favourite
Regards,
Hanabil

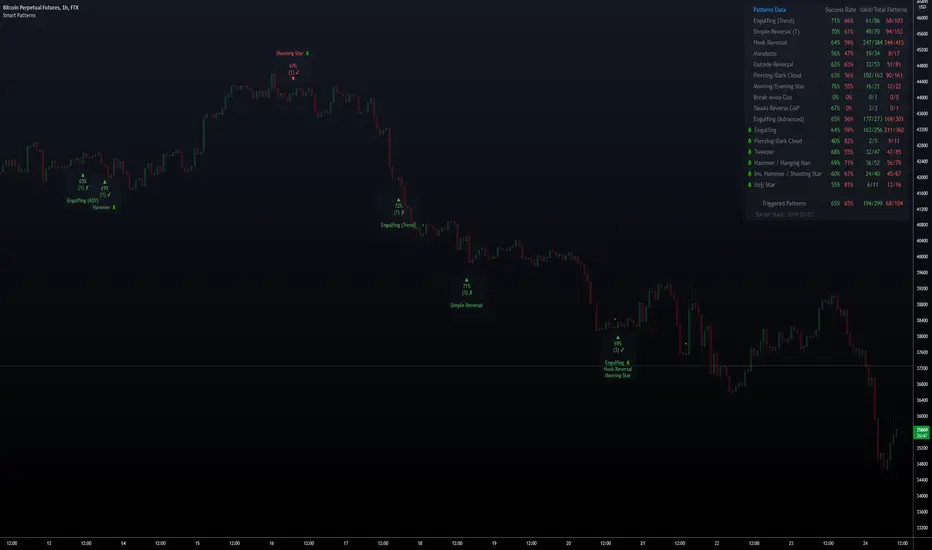
Smart PatternsHi Traders, and welcome to Smart Patterns.
Patterns can be very profitable, yet hard to trade, even when combined with other indicators and techniques. This script aims to increase the accuracy of signals by adding a statistical approach to candle patterns, along with tools to filter them.
For example, if the Success Rate is above a certain threshold, it means that the pattern has resulted in a higher ratio of profitable trades and hence it has a higher likelihood of succeeding in the current market conditions. However, should that pattern fall below the desired Success Rate, the script will "hide" it and won't trigger a signal, but still keeping track of its performance to start firing it again when coming back above the Success Rate.
Key Features
The script features custom patterns as well as some of TradingView's built-in patterns. Not all patterns can be added of course, but let me know if I missed other interesting ones and I will do my best to add them in future updates.
When a Pattern reaches the Min. Target % within the Candles Range selected, it is then considered valid. Please remember that doesn't take into account possible draw-downs or stop-losses.
Patterns are constantly evaluated inside the script; when a pattern's overall score (Success Rate %) is below the required minimum, the signal won't be triggered. However, the script will keep monitoring it in the background, and trigger a signal again when its score comes back above the minimum Success Rate.
The Patterns' signals can be filtered by Success Rate, Minimum Patterns detected and candle size (calculated via ATR).
The Data Panel will show individual statistics for Enabled Patterns as well as final statistics for Triggered Patterns.
Tooltips in the settings panel will further explain available options.
Alerts: simple alerts can be added by selecting "any alert() function call" when adding an Alert. Customizable alerts can also be created through dropdown menu ( Bullish \ Bearish Patterns Detected).
Fully customizable to adapt to light and dark themes
Notes and Recommendations
Always be realistic when tweaking settings, making sure the output makes sense in a normal trading environment. Statistics are helpful but shouldn't be the only factor to base your decisions on - even if a pattern reaches 100% Success Rate, it doesn't mean it will keep being profitable.
Since the script crunches quite some data it may give output errors especially if settings are not properly tweaked - or if the filters are too liberal (e.g. Min Target % set to 0.1) - hence triggering lots of signals. Please adjust the settings or enable only the Patterns you are trading.
If the script gives the error "Too many drawings, cannot clean oldest" it means your settings give too many signals and that is usually not a good sign - it's recommended to double-check your settings as mentioned above.
Credits
Trading View for built-in patterns
Special thanks go to PineCoders community for their incredible efforts and learning material to help mastering PineScript!
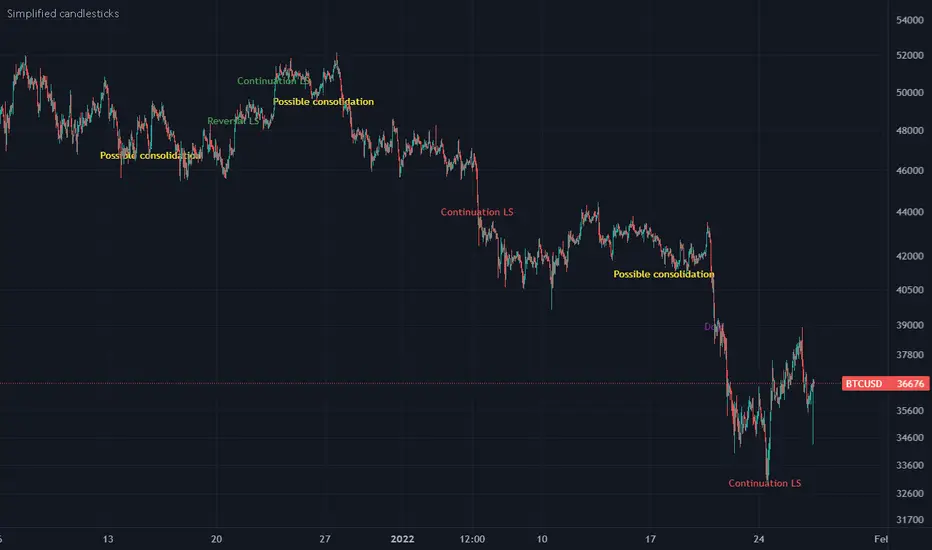
Simplified candlesticksSimplified candlesticks tracks sticks for their body and wick
- For Long bars sticks ( LS ) tracks and marks them on down trend as continuation and reversal if moves appositive direction.
- For largest wicks on ends marks as regular Doji
- For large wicks and medium body marks as possible consolidation
- For only bottom bigger wick as bears weakness if trend down and possible reversal if trend is up.
- For only upper bigger wick as bulls weakness if trend up and possible reversal if trend is down
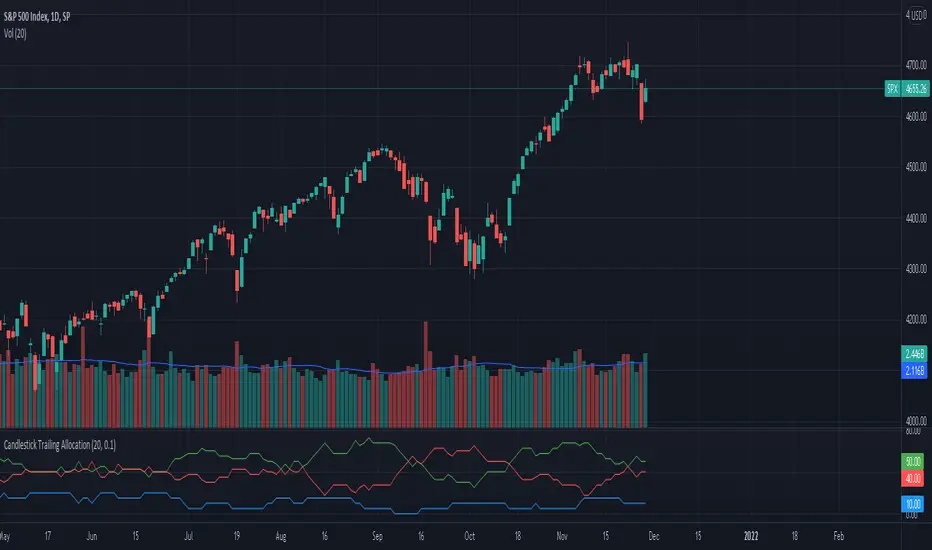
Candlestick Trailing AllocationA simple indicator that calculates the sum of 'Up'(green), 'Down'(red), and 'Doji'(near Doji) candlesticks and portrays the same in an allocation format in percentage. And since it is allocation-based, the total will never exceed 100% of the defined Length period.
The equation is Green + Red + Doji = Total Candles; where total candles = length
When calculating the allocation part, the doji candles are subtracted from the sum of green and red, and the new value is divided by the length period.
For example, the green line = (sum of all green candles - doji / 2) / length; the reason to divide doji by 2 is to eliminate the redundancy it can cause.
When the green line crosses above the red line, the number of green candles is more than red in the defined length period. Similarly, when the red line crossed above the green, there were more red candles than green in that period.
The Doji line shows if any doji or near doji candles have appeared. It acts as a form of resistance against the green and red candles.
There's also the option to change the value of the doji's weight. Default is at 0.1.
The indicator does not show trend nor momentum, even though it may replicate some of its behavior from time to time. It is purely showing the allocation of the number of candles classified as green, red, and doji within the length provided.
[CP]Pivot Boss Candlestick Scanner - No Repainting This indicator is based on the high probability candlestick patterns described in the ’Secrets of a Pivot Boss’ book.
The indicator does not suffer from repainting.
I have kept this indicator open source, so that you can take this indicator and design a complete trading system around it.
Although the patterns have some statistical edge in the markets, blindly using them as Buy/Sell Indicators will certainly result in a heavy loss.
I like some of these setups more than others, and I have listed them in the order of my likeness.
The first one I like the most, the last one, I like the least.
The patterns are universal and work well in both intraday, daily and even larger timeframes.
Signals in the example charts are manually marked by,
Hammer - profitable short signal
Rocket - profitable long signal
X - unprofitable long or short signal
GENERAL USER INPUTS:
These settings exist as the indicator uses ‘Labels’ to mark the patterns and Pine Script limits a maximum of 500 labels on a chart.
If you want to go back in the past and check how the indicator was doing, set the Start and End dates both and check the ’Use the date range above to mark the Candlestick Setups?’ option.
EXTREME REVERSAL SETUP:
This is by far my favorite setup in the lot. Classic Mean Reversion setup.
The logic, as explained in the book, goes like this,
1. The first bar of the pattern is about two times larger than the average size of the candles in the lookback period.
2. The body of the first bar of the pattern should encompass more than 50 percent of the bar’s total range, but usually not more than 85 percent.
3. The second bar of the pattern opposes the first.
The setup works extremely well in high beta stocks like Vedanta VEDL.
Feel free to play with the settings in order to better align this pattern with your favorite stock.
Check out the examples below,
No indicator is perfect, failed patterns are marked with an X.
OUTSIDE REVERSAL SETUP:
My second favorite setup, it is quite good at catching intraday trends.
Here’s the logic,
1. The engulfing bar of a bullish outside reversal setup has a low that is below the prior bar’s low and a close that is above the prior bar’s high. Reverse the conditions for bearish outside reversal.
2. The engulfing bar is usually 5 to 25 percent larger than the size of the average bar in the lookback period.
Settings for this pattern simply reflect these conditions. Feel free to modify them as you wish.
The pattern is pretty powerful and will sometimes help you catch literally all the highs and lows of the market, as shown in the examples of Vedanta VEDL and RELIANCE stocks below.
As usual, this pattern is not PERFECT either.
DOJI REVERSAL SETUP:
Doji candles signify market indecision and this pattern tries to profit off these market conditions.
Logic:
1. The open and close price of the doji should fall within 10 percent of each other, as measured by the total range of the candlestick.
2. For a bullish doji, the high of the doji candlestick should be below the ten-period simple moving average. Vice-versa for bearish.
3. For a bullish doji setup, one of the two bars following the doji must close above the high of the doji. Vice-versa for bearish.
Feel free to modify the settings and optimize according to the stock you are trading.
Don't optimize too much :)
This pattern works brilliantly well on larger intraday timeframes, like 15m/30m/60m.
This pattern also has a higher propensity to give false indications than the two described above.
Doji reversal typically helps to catch larger trend reversals. Check out the examples below from RELIANCE and NIFTY charts,
Note that the RELIANCE chart below is the same as shown for the Outside Reversal Setup above, notice the confluence of Outside
Reversal and Doji Reversal on the 31st August.
Confluence of patterns usually increases the probability of success.
RELIANCE 15m Chart - Pattern can catch nice trends on higher timeframes
NIFTY 15m Chart
WICK REVERSAL SETUP:
This pattern tries to capture candlesticks with large wick sizes, as they often indicate trend reversal when coupled with significant support and resistance levels.
Logic:
1. The body is used to determine the size of the reversal wick. A wick that is between 2.5 to 3.5 times larger than the size of the body is ideal.
2. For a bullish reversal wick to exist, the close of the bar should fall within the top 35 percent of the overall range of the candle.
3. For a bearish reversal wick to exist, the close of the bar should fall within the bottom 35 percent of the overall range of the candle.
This pattern must always be coupled with important support resistance levels, else there will be a lot of false signals.
The chart below is the same NIFTY chart as above with the Wick Reversal candles marked as well.
You can see that there are a lot of false signals, but the price also indicates ’pausing’ at important levels by printing a wick reversal setup.
You can use this information to your advantage when riding a trend.
FINAL WORDS:
Settings for various patterns simply reflect the logic described.
You will probably need to tweak and optimize the pattern settings for the stock that you are trading.
Higher Beta/Higher Volatility stocks are a great choice for these patterns.
Using these patterns at critical support and resistance levels will result in dramatically high accuracy.
Be creative and try to develop a proper system around this indicator, with rules for position sizing, stop loss etc.
You do not have to trade all the patterns. Even trading just one pattern with a proper system is good enough.
DO NOT USE THIS INDICATOR AS A BUY/SELL SYSTEM, YOU WILL LOSE MONEY.
Feel free to drop any feedback in the comments section below, or if you have any unique candlestick patterns that you would like me to code.

MTF Candlestick Patterns Screening [tanayroy]This script displays all candle patterns found in multi-time frames for a given lookback period. Candle pattern screening logic is taken from TradingView’s built-in script. The script works with 5m, 15m, 30m, 1HR, 2HR, 4HR, D, W, M timeframe. Works best with 5m chart.
Options available for trend detection, lookback period, and selecting candle pattern.
Please like, comment, and follow.

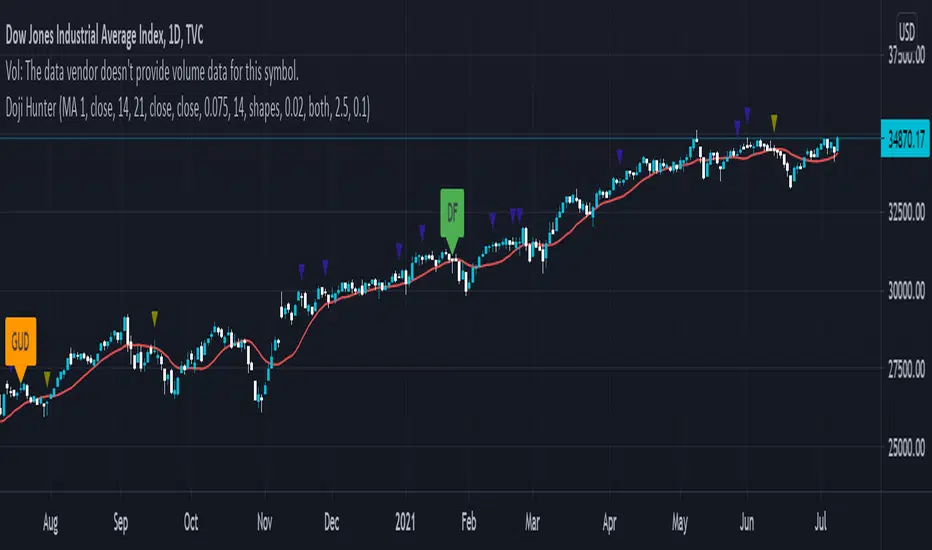
Doji Hunter█ OVERVIEW
This script is built to search for 8 different Doji candlestick patterns in markets and makes them appear on screen with bar coloring and creating color-coded labels/shapes. It will identify the following variants based upon user input for various rules to abide by:
Gapping Up
Gapping Down
Gravestone
Dragonfly
Long-Legged
Rickshaw Man
Northern (Doji in uptrend)
Southern (Doji in downtrend)
Note: for the remainder of this description, the types for inputs will be marked by italic text.
█ OPTIONS
This script features a wide range of options available to the user to modify how it functions. The first set of inputs dictate how the trend analysis is done with moving averages. The second and third sets of inputs dictate specific rules for how Doji candles are analyzed and the colors used for when they appear.
█ INPUTS (short)
1 — Moving Average Rules:
The Northern and Southern Doji variants require some trend analysis which will be done by Moving Averages. The inputs in this section change various things about the moving average(s) to be used. In the second section of inputs, there is one boolean option that will nullify the need for trend detection and consolidates the Northern and Southern Doji variants into one.
2/3 — Doji Rules and Colors:
The next two sections of inputs correspond to the various rules that dictate how various doji variants will be analyzed, as well as the colors that correspond to each variant. The colors will also apply to each of the labels/shapes used.
4 — Diagnostics:
The last boolean will allow the user to see extra detail with regards to how and when dojis are detected. Note: This is not a part of any prior section and is simply included as a last functional item to the list of all inputs.
An example of multiple labels being shown on screen for various types of Dojis (DJI 1D chart):
█ INPUTS (extended)
1 — Moving Average Rules:
This section consists of 10 different inputs specific to the rules on how the moving average functions for trend analysis.
"Trend Rule" ( string list) determines which Moving Average will be used for trend detection. It has 3 options: "MA 1", "MA 2", or "BOTH". The second input "Trend Source" determines which OHLC (or combination) value to use in comparison to either MA 1 or MA 2 (EX: Trend Rule -> "MA 1" and Trend Source -> "close": if close > MA 1 -> uptrend, downtrend otherwise). If "BOTH" is selected then "Trend Source" is ignored and added nuance in the script ensures that the shorter MA being above the longer MA yields an uptrend (downtrend otherwise).
The next 8 inputs focus on 4 different parts of both MA 1 and 2.
Length ( integer(s) )
Color
Switch between SMA/EMA ( boolean(s) )
Source for MA
Note: Additional attention to detail has been made here as trend direction is ignored if "BOTH" is selected for the MA Rules and the lengths of both Moving Averages are set to be the same.
2/3 — Doji Rules and Colors:
The next two sections include 19 inputs that are related to how this script will analyze and identify the different variants of Doji candles.
"Identify Pattern On Close" ( boolean ) modifies which candles are to be used for determining when Doji candles are recognized. This changes an offset used for historical reference on some global variables which will force the script to only identify patterns after the current candle has closed.
"Doji Body Tolerance" ( float ) tells the script the maximum % the candle body may be of the high-low range to be considered a Doji candle.
"Doji Wick Sample" ( integer ) defines how many prior candles to sample from in calculating the current average upper and lower wick sizes.
"Simplify Northern/Southern Dojis" ( boolean ) makes this script ignore trend direction for Doji detection and consolidates Northern and Southern Dojis into being recognized as the same. This has an added effect of removing the plotted moving averages from the screen.
"Northern/Southern Display" ( string list ) that has multiple options for how Northern and Southern Dojis will be displayed on screen. Because of how labels may be extremely taxing on TradingView's servers to display, the default setting is "shapes" where Northern and Southern (N/S) Dojis will be marked with a colored triangle at the top of the candle. If "Simplify Northern/Southern Dojis" is true, all N/S Dojis will be marked with an x-cross instead. Other options include "labels" which enables the use of labels accompanied by their respective tooltip and color, or "none" where N/S Dojis will be only noticeable by their changed barcolor.
"Allow Gravestone/Dragonfly Shadows" ( boolean ) allows a bit of additional nuance to the definition of Gravestone or Dragonfly Dojis with small shadows.
"Gravestone/Dragonfly Shadow Tolerance" ( float ) defines the maximum % that the lower wick/upper wick (respectively) may be relative to the high-low range for Gravestone or Dragonfly Dojis to still be considered valid.
"Doji Long Wick Setting" ( string list) is a list of settings for three different ways of confirming if a Doji is Long-Legged. The settings are "one", "two", and "average". These define how many wick lengths of a candle need to exceed the calculated average wick lengths (EX: "both" -> upper wick length > upper wick average and lower wick length > lower wick average). The "average" setting will combine the lengths of both wicks and both prior wick averages, divide both of these sums by 2 and compare them instead.
"Doji Long Wick Tolerance" ( float ) defines how large compared to the averages that wick lengths need to be in order for them to be considered "Long-Legged" (EX: 1.50 -> upper/lower wick needs to exceed 150% the average of previous upper/lower wicks).
"Rickshaw Man Body Placement Tolerance" ( float ) defines how close to the high-low range's midpoint the candle body's midpoint needs to be in order for it to be considered a Rickshaw Man Doji candle instead.
The remaining 9 inputs define the colors to use for differentiating between all Doji variants this script will recognize.
█ USAGE
My hope for this script is that users find this easy to use/understand and will tinker with the input values to better identify Doji candlesticks across a wide range of markets.
Suggestions for changes in the future are welcome.
LTB Zigzag CirclesHello All,
Today I am here with a new idea and script, " LTB Zigzag Circles ". The idea is to create Circles using last 2 zigzag waves and to catch the breakouts earlier than horizontal lines. if a circle is broken then the script shows entry for Long/Short positions. and if broken circle reappears again then the position is closed. You can change Zigzag period as you wish and see the different results.
Here you can see how the script calculates and draws the Circles:
Below you can see how the script draws part of the circle on each bar:
Optionally the script can show levels:
P.S. I haven't tested it as a strategy, Result and Performance may change by Zigzag period, you need to find best Zigzag period according to your strategy. By the way, my Zigzag Circles idea can be improved, if you have any recommendation let me know please ;)
Enjoy!

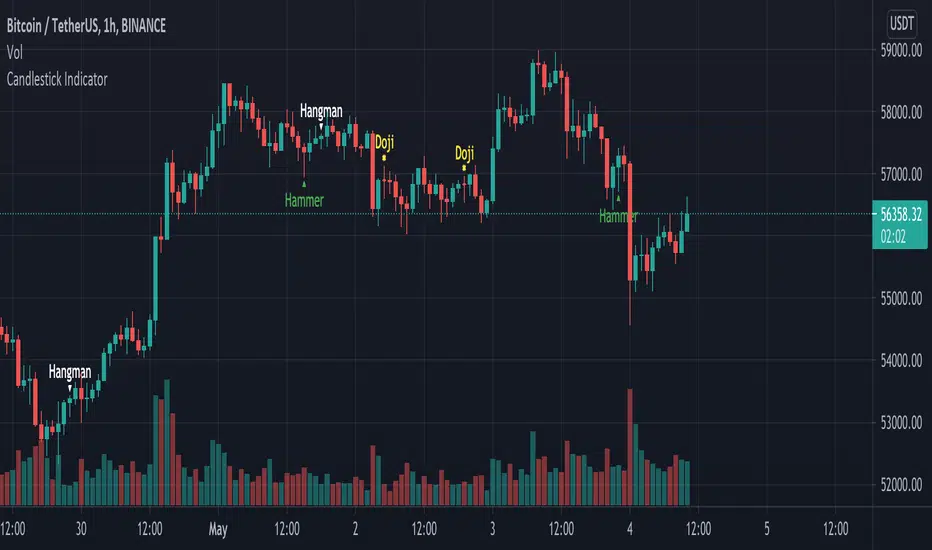
Candlestick Indicator by Crypto_AdhyetaA script to identify possible trend reversal based on Candlesticks. The correct candlestick type is identified by the relative position to Exponential Moving Average.
It detects:
- Hammer - if emerges during a downtrend (close below EMA(5)), the downtrend should end.
- Hanging Man - if comes after a advance (close above EMA(5)), the uptrend should end.
Confirmation:
- for aHammer not required
- a Hanging Man should be confirmed by lower close by the next candle
Japanese Candle Patterns Detector in Potential price zoneThis script would find the 8 famous "Japanese Candle Stick Patterns" in your chart.
Please be aware it find patterns in "Potential price zones" only, which help you to avoid none-important patterns during a price trend.
I used RSI and ATR in my codes to find best candle forms and price conditions.
Bellow patterns are detecting:
Hammer | ShootingStar | Engulfing Candle | Doji | Tweezers Top/Buttom | Three White Soldiers/Three Black Crows | Marubozu | Harami
* You can select your preferred patterns from indicator setting.
* Pattern names are abbreviated for better view on chart.
I hope it helps you to improve your trading.

Tweezers and Kangaroo TailHello Traders,
Here Tweezers and Kangaroo Tail script is in your service. The script searches for Tweezer / Kangaroo Tail candlestick patterns and shows them as T (Tweezer) and K (Kangaroo Tail). Thanks to RorschachT who game me the idea and some details while working on this script.
What are these candlestick patterns?
Tweezers :
- A tweezers pattern occurs when the highs/Lows of two candlesticks occur at almost exactly the same level
- Both candles must have wicks
- Bigger Wick / Smaller Wick rate should not be greater than 150% ( 150% by default and you have option to change it)
- First Candle must be highest/lowest for last 5 candles (5 by default and you have option to change it)
- The level of High for Top, Low for Bottom must be almost lower than 20% of the bigger wick of tweezer candles (20% by default and you have option to change it)
- The Candles can be right next to each other or apart but not more than 12 candles apart (12 by default and you have option to change it)
- You will see that Tweezers pattern occurs frequently
Kangaroo Tail:
- Looks almost like a Hammer or Inverted Hammer candle
- They have both its open and close in the top or bottom third of the candle
- There must be some space/room on the left of the kangaroo tail
- The open and close of the Kangaroo Tail candle must be inside the range of the previous candlestick
- The next candle should create a new high or new low
- You have several options to set details about the "Room" that should be on the left and also options for Wick/Body rates
- You can see example below
You have option to enable/disable any of these patterns.
as far as I have tested they are strong reversal patterns but none of the indicators or patterns may not be enough alone. so you should confirm the signals using other indicators or tools
If you need more information you can find a lot of info on the net ;)
Example: Tweezers - Aparted
Example: Kangaroo Tail - Bullish
Enjoy!

Divergence for Many Indicators v4Hello Traders,
Here is my new year gift for the community, Digergence for Many Indicators v4 . I tried to make it modular and readable as much as I can. Thanks to Pine Team for improving Pine Platform all the time!
How it works?
- On each candle it checks divergences between current and any of last 16 Pivot Points for the indicators.
- it search divergence on choisen indicators => RSI , MACD , MACD Histogram, Stochastic , CCI , Momentum, OBV, VWMACD, CMF and any External Indicator !
- it checks following divergences for 16 pivot points that is in last 100 bars for each Indicator.
--> Regular Positive Digergences
--> Regular Negative Digergences
--> Hidden Positive Digergences
--> Hidden Negative Digergences
- for positive divergences first it checks if closing price is higher than last closing price and indicator value is higher than perious value, then start searching divergence
- for negative divergences first it checks if closing price is lower than last closing price and indicator value is lower than perious value, then start searching divergence
Some Options:
Pivot Period: you set Pivot Period as you wish. you can see Pivot Points using "Show Pivot Points" option
Source for Pivot Points: you can use Close or High/Low as source
Divergence Type: you can choose Divergence type to be shown => "Regular", "Hidden", "Regular/Hidden"
Show Indicator Names: you have different options to show indicator names => "Full", "First Letter", "Don't Show"
Show Divergence Number: option to see number of indicators which has Divergence
Show Only Last Divergence : if you enable this option then it shows only last Positive and Negative Divergences
you can include any External Indicator to see if there is divergence
- enable "Check External Indicator"
- and then choose External indicator name in the list, "External Indicator"
- External indicator name is shown as Extrn
- related external indicator must be added before enabling this option
Coloring, line width and line style options for different type of divergences.
Following Alerts added:
- Positive Regular Divergence Detected
- Negative Regular Divergence Detected
- Positive Hidden Divergence Detected
- Negative Hidden Divergence Detected
Now lets see some examples:
Hidden Divergences:
Regular and Hidden Divergences together:
Showing first letters of indicators:
You can see only the number of indicators which has divergence:
You can see only divergence lines without indicators names and numbers:
option to used different label/line/text colors:
You have option to see only last divergences:
You can change Pivot Period, in following example Pivot Period = 15:
You can use Close or High/Low as Source for Divergence
You can include external indicators and get divergences on it:
Wish you all a happy new year!
Enjoy!

[TrustedSignals] Doji ScalperTrustedSignals Dojji Scalper is our most basic trading algorithm. It is based on Candle Patterns that show potential market reversal points.
The script has 3 different types of signals, which can be individually turned on and off:
- Doji signals, based entirely on the Doji candle pattern and 2 Strong and Weak candle reversal patters
As a bonus, we have included RSI based Support and Resistance bands that, if used correctly can further confirm all the entry signals
All chart signals can be set up as live alerts!

Multi Price Action & Candlestick Patterns - Horizontals R/SNote:
This is a script that synthesizes a number of popular price action and candlestick patterns along with a trading strategy based on horizontal support and resistance. Scripts are used for learning and research purposes.
Useage:
Support and resistance are two important areas in Price Action analysis and trading. After confirming the support and resistance zone line, waiting to confirm the appropriate candlestick pattern and execute the trade, set a reasonable stop loss and take profit, This is critical for compliance with your money management rules.
Notation:
In the script, price action and candlestick pattern are denoted as follows:
- Bullish Engulfing (BU) & Bearish Engulfing (BE)
- Hammer (HM)
- Hanging Man (MM)
- Morning Star (MS)
- Evening Star (ES)
- Tweezer Top (TZT)
- Tweezer Bottom (TZB)
- Shooting Star (SS)
- Bullish Pinbar (PBBBU) & Bearish Pinbar (PBBE)
- Doji Gravestone (GS)
- Doji Dragonfly (DF)
- Doji - Long legged (LL)
- Spinning Top (ST)
Settings:
- Number of left candle to compare lowest/highest: Compare the high/low price of the current candle with the highest/lowest price of previous candles.
- Number of left candle to calc avg body: Compare the average price of the current candle with the average price of previous candles
- S/R Left Bars: The number of bars left hand side of the Pivot
- S/R Right Bars: The number of bars right hand side of the Pivot
- S/R Volume Threshold - The threshold value (%) for the volume oscillator
The code is open and commented - please feel free to use, share, comment & provide feedback.
Good luck!
Feel free to get indicator or strategy trading signals at yummyprofit.

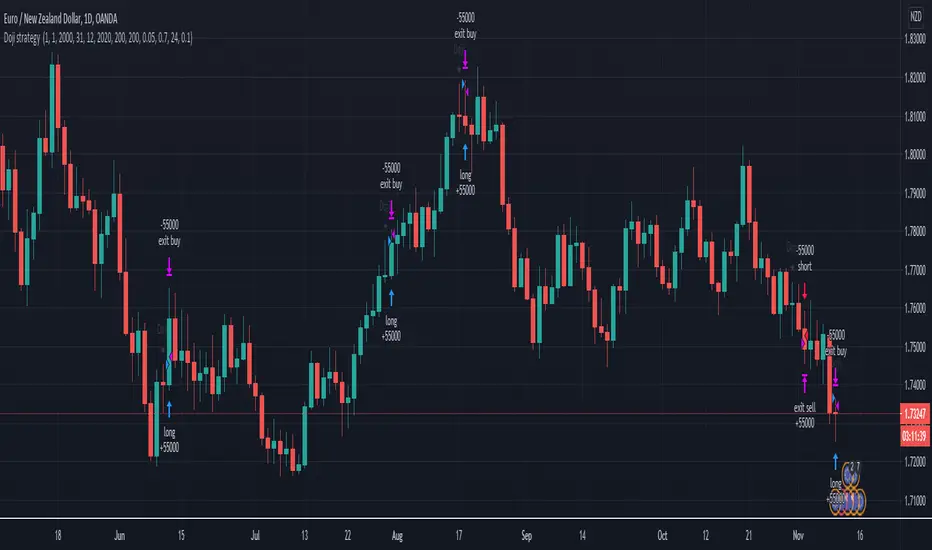
Doji swing strategyThis is a simple strategy based on Doji star candlestick
This strategy is suited for big time frames, like 4h -1Day and so on.
It places two orders: long at doji star high or previous candle high and short at doji star low or previous candle low.
It can also be applied volume average, in order to filter between trades .
This strategy works very well with high time frames like Weekly TF because it eliminates the noise in doji formation.
It also has inside a risk management made of SL/TP , or if not prefered it can exit based on a exit condition.
If you have any questions, please let me know !
Dragonfly Doji with DMI and Volume FiltersA Dragonfly Doji is a type of candlestick pattern that can signal a potential reversal in price to the downside or upside, depending on past price action. It's formed when the asset's high, open, and close prices are the same. The long lower shadow suggests that there was aggressive selling during the period of the candle, but since the price closed near the open it shows that buyers were able to absorb the selling and push the price back up.
The study enhances standard Dragonfly Doji accuracy by clearing out market noises and manipulations from the indicator's triggers. Specially selected values of Directional Movement Index (DMI) components detect only strong signals while RSI bands indicator is used to find the safiest signals' closure moments.
The indicator can be applied to trading pairs with USD, USDT, ETH and BTC quote currencies. It is better to check the recent performance on each particular trading pair before apply it. The Indicator supports spot, futures and marginal trading exchanges. The best performance is obtained while using at 15m timeframe and for scalping signals
Advantages of this indicator:
1. Weak signals and market noises are filtered. This allows to receive only strong and confirmed alerts
2. The indicator includes both
Study with built-in custom alerts to use with your own software through web hook connection.
Strategy with configurable risk management settings (order size, commission, take profit, stop loss and trailing). This provides you opportunity of direct broker connection and allows to conduct backtests before applying the strategy to real account
How to use?
Long signals:
1. Apply indicator to the trading pair your are interested in at 15m timeframe chart
2. Once conditions are met price action candle will be colored yellow and DD label will be drawn. Place a long position and wait. The
3. Once price action breaks RSI resistance band, retraces and closes below the band the signal is finished and the position should be closed
Automatic strategy:
When conditions of long or short position from the strategy are met the script opens position.
Strategy.exit closes the position once risk management settings are met.
Strategy.close closes the position once RSI band rejection is confirmed
If you want to obtain access to the indicator please send us a personal message
If you want to obtain access to the indicator please send us a personal message or leave a comment
