[KVA]Donchian Channel Percentage" The 'Donchian Channel Percentage ' (DC%) indicator, developed for TradingView’s Pine Script Version 5, is a unique tool designed to measure the current price’s position within the Donchian Channel. The Donchian Channel, a popular indicator in technical analysis, is defined by the highest high and the lowest low over a user-specified period.
Key Features :
User-Defined Period: Users can customize the lookback period (default 20 periods), allowing flexibility in different trading styles and timeframes.
Channel Calculation: The upper and lower bounds of the Donchian Channel are calculated based on the highest high and lowest low over the chosen period.
Percentage Calculation: DC% quantifies where the current price lies within the channel, presented as a percentage. A value of 0% indicates the price at the channel's low, and 100% signifies the price at the high.
Visualization: The DC% is plotted as a line graph, providing a clear visual representation of the price’s relative position. The indicator includes horizontal lines at 0% and 100%, marked in red and green, respectively, to depict the channel's boundaries.
Market Analysis Tool: DC% offers insights into market trends and potential overbought or oversold conditions, making it a valuable addition for traders who focus on channel-based strategies.
Applications :
The DC% is particularly useful for identifying breakout scenarios and potential reversals.
Traders can use this tool in conjunction with other indicators to enhance their market analysis, especially in strategies that capitalize on price extremes within a defined range.
In summary, the Donchian Channel Percentage offers traders a simple yet powerful tool to gauge the current price’s position within a historical high-low range. Its adaptability across various assets and timeframes makes it a versatile addition to any technical trader’s toolkit."
Donchianchannel

Momentum ChannelbandsThe "Momentum Channelbands" is indicator that measures and displays an asset's momentum. It includes options to calculate Bollinger Bands and Donchian Channels around the momentum. Users can customize settings for a comprehensive view of momentum-related insights. This tool helps assess trend strength, identify overbought/oversold conditions, and pinpoint highs/lows. It should be used alongside other indicators due to potential lag and false signals.

Auto-Length Adaptive ChannelsIntroduction
The key innovation of the ALAC is the implementation of dynamic length identification, which allows the indicator to adjust to the "market beat" or dominant cycle in real-time.
The Auto-Length Adaptive Channels (ALAC) is a flexible technical analysis tool that combines the benefits of five different approaches to market band and price deviation calculations.
Traders often tend to overthink of what length their indicators should use, and this is the main idea behind this script. It automatically calculates length based on pivot points, averaging the distance that is in between of current market highs and lows.
This approach is very helpful to identify market deviations, because deviations are always calculated and compared to previous market behavior.
How it works
The indicator uses a Detrended Rhythm Oscillator (DRO) to identify the dominant cycle in the market. This length information is then used to calculate different market bands and price deviations. The ALAC combines five different methodologies to compute these bands:
1 - Bollinger Bands
2 - Keltner Channels
3 - Envelope
4 - Average True Range Channels
5 - Donchian Channels
By averaging these calculations, the ALAC produces an overall market band that generalizes the approaches of these five methods into a single, adaptive channel.
How to Use
When the price is at the upper band, this might suggest that the asset is overbought and may be due for a price correction. Conversely, when the price is at the lower band, the asset may be oversold and due for a price increase.
The space between the bands represents the market's volatility. Wider bands indicate higher volatility, while narrower bands suggest lower volatility.
Indicator Settings
The settings of the ALAC allow for customization to suit different trading strategies:
Use Autolength?: This allows the indicator to automatically adjust the length of the dominant cycle.
Usual Length: If "Use Autolength?" is disabled, this setting allows the user to manually specify the length of the cycle.
Moving Average Type: This selects the type of moving average to be used in the calculations. Options include SMA, EMA, ALMA, DEMA, JMA, KAMA, SMMA, TMA, TSF, VMA, VAMA, VWMA, WMA, and ZLEMA.
Channel Multiplier: This adjusts the distance between the bands.
Channel Multiplier Step: This changes the step size of the channel multiplier. Each next market band will be multiplied by a previous one. You can potentially use values below 1, which will plot bands inside the first, main channel.
Use DPO instead of source data?: This setting uses the DPO for calculations instead of the source data. Basically, this is how you can add or eliminate trend from calculation of an average leg-up / leg-down move.
Fast: This adjusts the fast length of the DPO.
Slow: This adjusts the slow length of the DPO.
Zig-zag Period: This adjusts the period of the zig-zag pattern used in the DPO.
(!) For more information about DPO visit official TradingView description here: link
Also, I want to say thanks to @StockMarketCycles for initial idea of Detrended Rhythm Oscillator (DRO) that I use in this script.
The Adaptive Average Channel is a powerful and versatile indicator that combines the strengths of multiple technical analysis methods.
In summary, with the ALAC, you can:
1 - Dynamically adapt to any asset and price action with automatic calculation of dominant cycle lengths.
2 - Identify potential overbought and oversold conditions with the adaptive market bands.
3 - Customize your analysis with various settings, including moving average type and channel multiplier.
4 - Enhance your trading strategy by using the indicator in conjunction with other forms of analysis.

Sublime Trading | Donchian Breakout SignalsWhat kind of traders/investors are we?
We are trend followers. Our scripts are designed to be used on the higher timeframes (weekly/daily) to catch the large moves/trends in the market.
Most have heard of long-term trend following. Few know how to execute the strategy.
Our scripts are designed specifically to identify and invest in long-term market trends.
What does this script do?
It produces entry signals in a confirmed bull and bear trend.
The logic is based on Donchian 20, which serves the following two purposes:
1. Confirms end-of-day entry points in a long-term trend
2. Filters out entry points in a sideways market
The signal is produced on a break and close of the Donchian 20 high in a bull trend and a break and close of the Donchian 20 low in a bear trend.
How is the entry price produced?
The entry is based on a percentage value of the range of the breakout bar added to the high of the bar in a bull trend.
In a bear trend, the percentage is subtracted from the low of the bar.
This gives an objective entry when placing a position once the OHLC of a bar is confirmed at the end of the trading day.
How is the stoploss price produced?
The script uses the formula ATR 15 x 4.
We use ATR as it produces a stoploss which is unique to the volatility of the asset. The more volatile the asset, the wider the stoploss.
We use ATR 15 as it brings an average reading across half a month, incorporating days of extreme volatility.
The multiplier 4 works well to avoid positions being stopped out prematurely on pullbacks.
When the stoploss is hit, there is when traders and investors may consider exiting positions.
What is the best timeframe to use the script?
We recommend the daily timeframe as this is where trader and investors identify and enter long-term market trends.
The higher timeframes are where traders and investors take fewer positions but hold for longer time periods.
As a result, trend followers place priority on the quality of the entry rather than quantity.
What makes this script unique?
This script has been coded specifically for the daily timeframe to:
Highlight the start of a potential long-term trends.
Confirm entry points at the end of the trading day, absorbing intraday noise.
Reduce fake breakouts in a trend.
Continue to create entry points as the trend develops to allow for compounding.
Filter out breakouts in a sideways market.
This entry signal script helps traders and investors focus on the quality of a potential position when investing in long-term market trends.

Bars Above/Below Donchian Channel [ScalpTradr]"Bars Above/Below Donchian Channel" provides a visualization of the Donchian Channel and measures the number of bars above and below the middle line of the channel.
The Donchian Channel is a trading indicator that outlines the highest high and the lowest low over a defined number of periods, in this case set by the variable "length". This indicator script specifically also calculates the 'basis', which is the average of the upper and lower channels of the Donchian Channel.
When the closing price of a bar is above the 'basis', the script increases a counter for "aboveCount" and adds a label on the chart to show how many bars have closed above the 'basis'. This label is green and it's always placed at the high price of the bar. Conversely, when the closing price is below the 'basis', it increases a counter for "belowCount" and adds a red label on the chart to show how many bars have closed below the 'basis'. This label is placed at the lower_channel level.
This script can be useful for traders who use the Donchian Channel as a part of their trading strategy. The number of bars closing above or below the 'basis' can provide insights into the ongoing trend. A higher count of bars closing above the 'basis' can be interpreted as a bullish signal, suggesting an upward trend. Similarly, a higher count of bars closing below the 'basis' can be interpreted as a bearish signal, suggesting a downward trend
I hope you find this indicator useful.
Enjoy.

MyVolatilityBandsLibrary "MyVolatilityBands"
Just a lil' library of volatility bands that I use in some scripts
bollingerbands(src, lkbk, mult, basis)
Bollinger Bands
Parameters:
src (float) : float
lkbk (int) : int
mult (float) : float
basis (float)
Returns: Bollinger Bands
donchianchannels(src, lkbk, band_width)
Donchian Channels
Parameters:
src (float) : float
lkbk (int) : int
band_width (float) : float
Returns: Donchian Channels with an outer band of varying thickness adjusted by the band_width input
doublehalfdonchianchannels(src, lkbk, divisor)
Double Half Donchian Channels
Parameters:
src (float) : float
lkbk (int) : int
divisor (float) : float
Returns: two adjustable bases calculated using Donchian Channels calculation that act as a measure of volatility

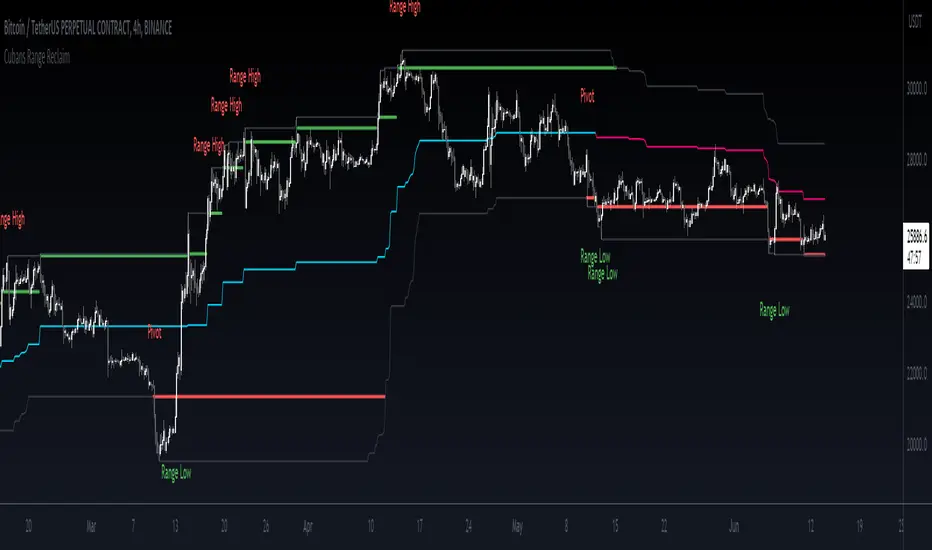
Cuban's Range Reclaim [CE]Cuban's Range Reclaim is an indicator that minimizes the time that traders need to spend manually adjusting the range extremes and identifying range deviations.
By tracking the previous levels of the range, the indicator then signals to the trader when price trades back below that level, and assigns a 'Range High' or 'Range Low' print to the deviation. When there is a potential break in the trend, the indicator also prints a 'Pivot' label.
Among other features, the indicator tracks the midline of the range excluding the deviations, giving a far more accurate trend line with less signal noise than regular donchian channels.
There is also the option to view dynamic supply and demand within the channel, plus midlines for the supply and demand, and for a regular channel.
Within the user inputs, the indicator also allows the user to adjust the following:
Source input for range level confirmations
Period for range lookback
Supply and demand sensitivity
TO DO:
Allow for color changes within the Style menu
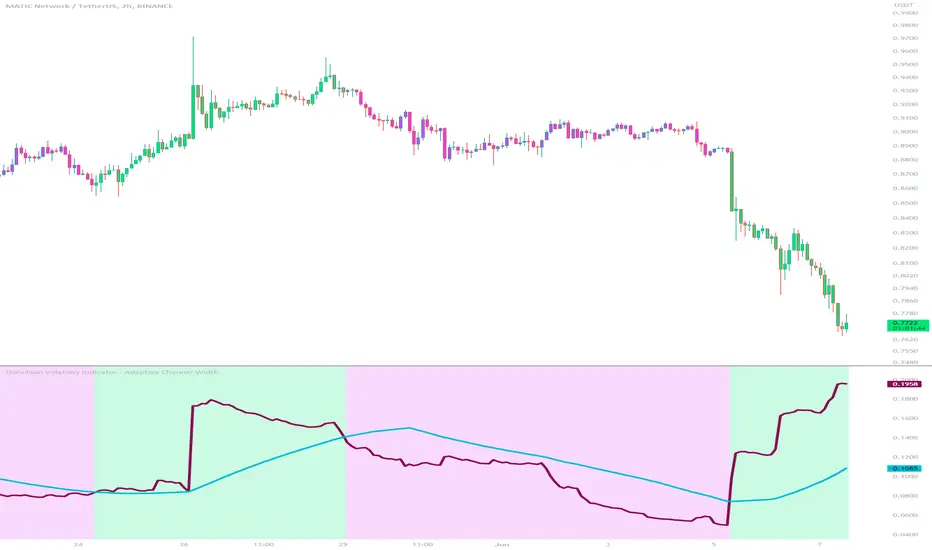
Donchian Volatility Indicator - Adaptive Channel WidthThis indicator is designed to help traders assess and analyze market volatility. By calculating the width of the Donchian channels, it provides valuable insights into the range of price movements over a specified period. This indicator helps traders identify periods of high and low volatility, enabling them to make more informed trading decisions.
The indicator is based on the concept of Donchian channels, which consist of the highest high and lowest low over a specified lookback period. The channel width is calculated as the difference between the upper and lower channels. A wider channel indicates higher volatility, suggesting potentially larger price movements and increased trading opportunities. On the other hand, a narrower channel suggests lower volatility, indicating a relatively calmer market environment with potentially fewer trading opportunities.
The adaptive aspect of the indicator refers to its ability to adjust the width of the channels dynamically based on market conditions. The indicator calculates the width of the channels using the Average True Range (ATR) indicator, which measures the average range of price movements over a specified period. By multiplying the ATR value with the user-defined ATR multiplier, the indicator adapts the width of the channels to reflect the current level of volatility. During periods of higher volatility, the channels expand to accommodate larger price movements, providing a broader range for assessing volatility. Conversely, during periods of lower volatility, the channels contract, reflecting the narrower price ranges and signaling a decrease in volatility. This adaptive nature allows traders to have a flexible and responsive measure of volatility, ensuring that the indicator reflects the current market conditions accurately.
To provide further insights, the indicator includes a signal line. The signal line is derived from the channel width and is calculated as a simple moving average over a specified signal period. This signal line acts as a reference level, allowing traders to compare the current channel width with the average width over a given time frame. By assessing whether the current channel width is above or below the signal line, traders can gain additional context on the volatility level in the market.
The colors used in the Donchian Volatility Indicator - Adaptive Channel Width play a vital role in visualizing the volatility levels:
-- Lime Color : When the channel width is above the signal line, it is colored lime. This color signifies that volatility has entered the market, indicating potentially higher price movements and increased trading opportunities. Traders can pay closer attention to the lime-colored channel width as it may suggest favorable conditions for trend-following or breakout trading strategies.
-- Fuchsia Color : When the channel width is below the signal line, it is colored fuchsia. This color represents relatively low volatility, suggesting a calmer market environment with potentially fewer trading opportunities. Traders may consider adjusting their strategies during periods of low volatility, such as employing range-bound or mean-reversion strategies.
-- Aqua Color : The signal line is represented by the aqua color. This color allows traders to easily identify the signal line amidst the channel width. The aqua color provides a visual reference for the average channel width and helps traders assess whether the current width is above or below this average.
The Donchian Volatility Indicator - Adaptive Channel Width has several practical applications for traders:
-- Volatility Assessment : Traders can use this indicator to assess the level of volatility in the market. By observing the width of the Donchian channels and comparing it to the signal line, they can determine whether the current volatility is relatively high or low. This information helps traders set appropriate expectations and adjust their trading strategies accordingly.
-- Breakout Trading : Wide channel widths may indicate an increased likelihood of price breakouts. Traders can use the Donchian Volatility Indicator - Adaptive Channel Width to identify potential breakout opportunities. When the channel width exceeds the signal line, it suggests a higher probability of significant price movements, potentially signaling a breakout. Traders may consider entering trades in the direction of the breakout.
-- Risk Management : The indicator can assist in setting appropriate stop-loss levels based on the current volatility. During periods of high volatility (lime-colored channel width), wider stop-loss orders may be warranted to account for larger price swings. Conversely, during periods of low volatility (fuchsia-colored channel width), narrower stop-loss orders may be appropriate to limit risk in a more range-bound market.
While the Donchian Volatility Indicator - Adaptive Channel Width is a valuable tool, it is important to consider its limitations:
-- Lagging Indicator : The indicator relies on historical price data, making it a lagging indicator. It provides insights based on past price movements and may not capture sudden changes or shifts in volatility. Traders should be aware that the indicator may not generate real-time signals and should be used in conjunction with other indicators and analysis tools.
-- False Signals : Like any technical indicator, the Donchian Volatility Indicator - Adaptive Channel Width is not immune to generating false signals. Traders should exercise caution and use additional analysis to confirm the signals generated by the indicator. Considering the broader market context and employing risk management techniques can help mitigate the impact of false signals.
-- Market Conditions : Market conditions can vary, and volatility levels can differ across different assets and timeframes. Traders should adapt their strategies and consider other market factors when interpreting the signals provided by the indicator. It is crucial to avoid relying solely on the indicator and to incorporate a comprehensive analysis of the market environment.
In conclusion, this indicator is a powerful tool for assessing market volatility. By examining the width of the Donchian channels and comparing it to the signal line, traders can gain insights into the level of volatility and adjust their trading strategies accordingly. The color-coded representation of the channel width and signal line allows for easy visualization and interpretation of the volatility dynamics. Traders should utilize this indicator as part of a broader trading approach, incorporating other technical analysis tools and considering market conditions for a comprehensive assessment of market volatility.
Market Cycle IndicatorThe Market Cycle Indicator is a tool that integrates the elements of RSI, Stochastic RSI, and Donchian Channels. It is designed to detect market cycles, enabling traders to enter and exit the market at the most opportune times.
This indicator provides a unique perspective on the market, combining multiple strategies into one unified and weighted approach. By factoring in the inputs from each of these popular technical analysis methods, it offers a more holistic view of the market trends and cycles.
Parameter Details:
Donchian Channels (DCO):
- donchianPeriod: Sets the period for the Donchian Channel calculation. Default is set to 14.
- donchianSmoothing: Sets the smoothing factor for the Donchian Channel calculation. Default is set to 3.
- donchianPrice: Selects the price type to be used in the Donchian Channel calculation. Default is set to the closing price.
Relative Strength Index (RSI):
- rsiPeriod: Sets the period for the RSI calculation. Default is set to 14.
- rsiSmoothing: Sets the smoothing factor for the RSI calculation. Default is set to 3.
- rsiPrice: Selects the price type to be used in the RSI calculation. Default is set to the closing price.
Stochastic RSI (StochRSI):
- srsiPeriod: Sets the period for the Stochastic RSI calculation. Default is set to 20.
- srsiSmoothing: Sets the smoothing factor for the Stochastic RSI calculation. Default is set to 3.
- srsiK: Sets the period for the %K line in the Stochastic RSI calculation. Default is set to 5.
- srsiD: Sets the period for the %D line in the Stochastic RSI calculation. Default is set to 5.
- srsiPrice: Selects the price type to be used in the Stochastic RSI calculation. Default is set to the closing price.
Weights:
- rsiWeight: Sets the weight for the RSI in the final aggregate calculation. Default is set to 1.
- srsiWeight: Sets the weight for the Stochastic RSI in the final aggregate calculation. Default is set to 1.
- dcoWeight: Sets the weight for the Donchian Channel in the final aggregate calculation. Default is set to 1.
Limits:
- limitHigh: Sets the upper limit for the indicator. Default is set to 80.
- limitLow: Sets the lower limit for the indicator. Default is set to 20.
By customizing these parameters, users can tweak the indicator to align with their own trading strategies and risk tolerance levels. Whether you're a novice or an experienced trader, the Comprehensive Market Cycle Indicator provides valuable insights into the market's behavior.
Uses library HelperTA

custom Bollinger bands with filters - indicator (AS)-----------Description-------------
This indicator is basically Bollinger bands with many ways to customize. It uses highest and lowest values of upper and lower band for exits. I think something is wrong with the script but cant find any mistakes – most probably smoothing. The ATR filter is implemented but is working incorrectly. In code you can also turn it into strategy but I do not recommend it for now as it is not ready yet.
So this is my first script and I am looking for any advice, ideas to improve this script, sets of parameters, markets to apply, logical mistakes in code or any ideas that you may have. Indicator was initially designed for EURUSD 5MIN but I would be interested in other ideas.
-----------SETTINGS--------------
---START - In starting settings we can choose
Line 1: what parts to use BB/DC/ATR
Line 2: what parts to plot on chart
Line 3 Whether or not apply smoothing to BB or ATR filter
Line 4 Calculate deviation for BB from price or Moving average
Line 5 Fill colors and plot other parts for debug (overlay=false)
Line 6:( for strategy) – enable Long/Short Trades
---BB and DC – here we modify Bollinger bands and Donchian
Line 1: Length and type of BB middle line and also length of DC from BB
Line 2: Length and type of BB standard deviation and multiplier
Line 3: Length and type of BB smoothing and %width for BB filter
---ATR filter – (not ready fully yet)
Line 1: type and length of ATR
Line 2: threshold and smoothing value of ATR
---DATE and SESSION
Line 1: apply custom date or session?
Line 2: session hours settings
Line 3:Custom starting date
Line 4: Custom Ending date
-----------HOW TO USE--------------
We open Long if BB width is bigger than threshold and close when upper band is no longer highest in the period set. Exact opposite with Short

Donchian Channels [Gu5]█ OVERVIEW
I changed the design of the classic indicator "Donchian Channels", for easy reading.
█ CONCEPTS
Donchian Channels is an indicator made up of upper and lower bands around a mid-band or Basis.
The upper band marks the highest price of a security for N periods, while the lower band marks the lowest price of a security for N periods. The area between the upper and lower bands.
In this version, when there are new Higher High (HH), the trend is Bullish and the channel is painted green.
When there are new Lower Low (LL), the trend is Bearish and the channel is painted Red
█ OTHER SECTIONS
A plus in this script: When there are no new highs or new lows, there is no certain trend
The channel is painted yellow
www.tradingview.com
• HOW TO USE
Menu "Display"
• '■ Basis On/Off': Shows the midline Basis
• '■ Alert On/Off': Shows alerts labels
• '■ Fill On/Off': Paint the entire channel the color of the trend
• '■ Bar Color On/Off': Paint the candle the color of the trend
• '■ Close Alert On/Off': Shows alerts end of trend
• NOTES:
This code was written using the recommendations from the Pine Script™ User Manual's Style Guide
• RAMBLINGS:
You can use the "Basis" line as Trailing Stop.
• THANKS:
Donchian Channels developed by Richard Donchian
and many MANY thanks to @PineCoders

Donchian Channel Oscillator (DonOsc) Preface
DonOsc stands for Donchian Channel Oscillator. This channel envelopes all prices, so if you set the height of the channel to 100 percent, you can plot the prices as percent in between, creating this sub-pane oscillator. For clarity the example chart shows a Donchian channel in the main-pane with the same look-back as the DonOsc, this way you can see how both are related.
Price River
Not only the close is plotted, but also the high and the low of the bar. Thus you get a structure that can be associated with a river, streaming from left to right, in which the price moves between the left bank (i.e. the plotted highs) and the right bank (i.e. the plotted lows), which meanders between the high border (100%) and the low border (0%) of the oscillator. The surface of the price river is gray. The price line is blue when up and dark red when down. The river has also color patches dark red, light red, blue and aqua. Stochastic patches; up: aqua, down: light red
If you look at the price river, you may notice that the price line is closer to the left bank (highs) when moving up and to the right bank (lows) when moving down. Because this phenomenon is used in the stochastic indicator, I named these stochastic patches. These are depicted on the wide side for visibility, so the aqua patches are to the right of the price line and the light-red patches to the left.
Widening patches; up: blue, down: red
If you look at tops or bottoms in bar charts, you may notice that long bars (wide range) tend to be there. You may say that prices turn with a ‘range bang’. This causes a widening of the price river, depicted as a patch on the wide side.
Channel Features
High (76.4 %) and low (23.6 %) Fibonacci levels.
In the oscillator there is no need to calculate Fibonacci levels, we can just plot them. If the price is above 50% the low level is shown with a green color, when below the high level with a pink color. When the price river crosses a level a ‘near border’ highlighter will flash, lime near the high border and orange near the low one.
New high and new low markers.
A flaw in the oscillator is that is doesn’t show actual new lows and new highs in the Donchian Channel, because everything is made relative. This is ‘repaired’ by adding markers, dark red for new low depicted between the high fib and border, blue for new high depicted between low fib and border. Used are the same colors as in the widening patches, because new highs and lows also lead to widening of the actual Channel.
Uptrend and downtrend highlighters.
If in the actual Channel the bars run in the upper half, an uptrend is happening as long as these remain there, a downtrend when the bars remain in the lower half. In the oscillator a yellow highlighter flashes when the price is higher than 50%, a red highlighter below 50%.
Interpretation of the DonOsc
This sub-pane indicator provides a wealth of useful information about what is going on in the market. First of all you immediately see whether there is an up or down trend and whether these lead to new highs or lows. Second of all you can estimate the importance of price movements in the context of the look-back period. Thirdly the width of the price river reveals the emotions in the market. The higher the emotions run, the more risk is involved in a postilion in the charted instrument.
Settings of the DonOsc
Look-back settings.
By default the script sets the look-back, depending on the time frame. This overrules the standard manual setting. If you switch this off, the manual setting will work. A feed-back label can by shown which informs about the current setting.
Smoothing
This concerns the price river. Default is 2, if you increase this setting, the river will loose its touch with the channel borders. O.t.o.h. the river wil be wider and better visible. Maximum setting is 5.
Colors
The momentum colors set both the river widening patches and new high and low markers.
Take care, Eykpunter.

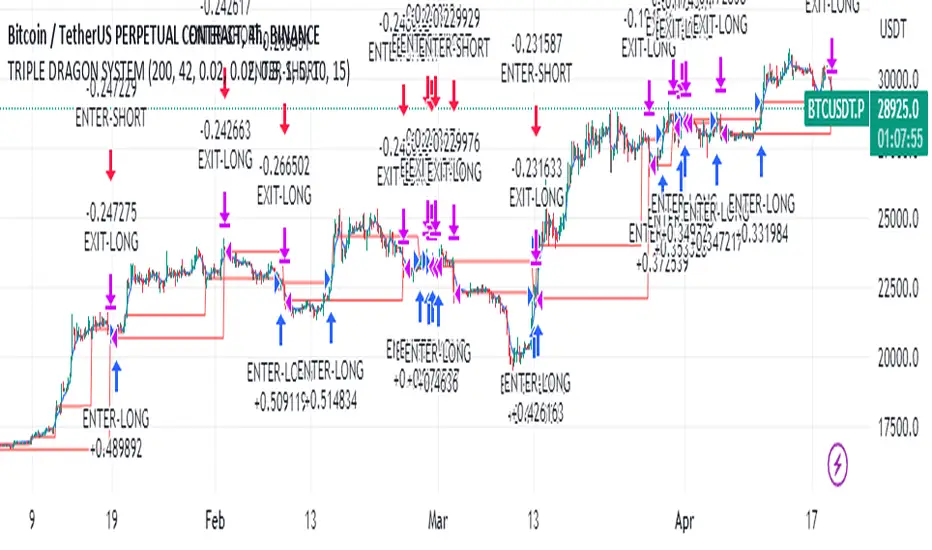
Educational Strategy : TRIPLE DRAG-ON SYSTEM V.1The Triple Dragon System is a technical trading strategy that uses a combination of three different indicators to identify potential buy and sell signals in the market. The three indicators used in this strategy are the Extended Price Volume Trend (EPVT), the Donchian Channels, and the Parabolic SAR. Each of these indicators provides different types of information about the market, and by combining them, we can create a more comprehensive trading system.
The EPVT is used to identify potential trend changes and measure the strength of a trend. The Donchian Channels are used to identify the direction of the trend, while the Parabolic SAR is used to provide additional confirmation of trend changes and help determine potential entry and exit points.
In this strategy, we first use the EPVT and Donchian Channels to identify the direction of the trend. When the EPVT is above its baseline and the price is above the upper Donchian Channel, it suggests an uptrend. Conversely, when the EPVT is below its baseline and the price is below the lower Donchian Channel, it suggests a downtrend.
Once we have identified the trend direction, we use the Parabolic SAR to help determine potential entry and exit points. When the Parabolic SAR is below the price and flips to above the price, it suggests a potential buy signal. Conversely, when the Parabolic SAR is above the price and flips to below the price, it suggests a potential sell signal.
To further refine our trading signals, we use multiple timeframes to confirm the trend direction and ensure that we are not entering the market during a period of high volatility. We also use multiple take-profit levels to lock in profits and manage risk.
Overall, the Triple Dragon System is a comprehensive technical trading strategy that combines multiple indicators to provide clear entry and exit signals. By using a combination of trend-following and momentum indicators, we can identify potential trading opportunities while minimizing risk. Please note that this strategy is for educational purposes only and should not be taken as financial advice.
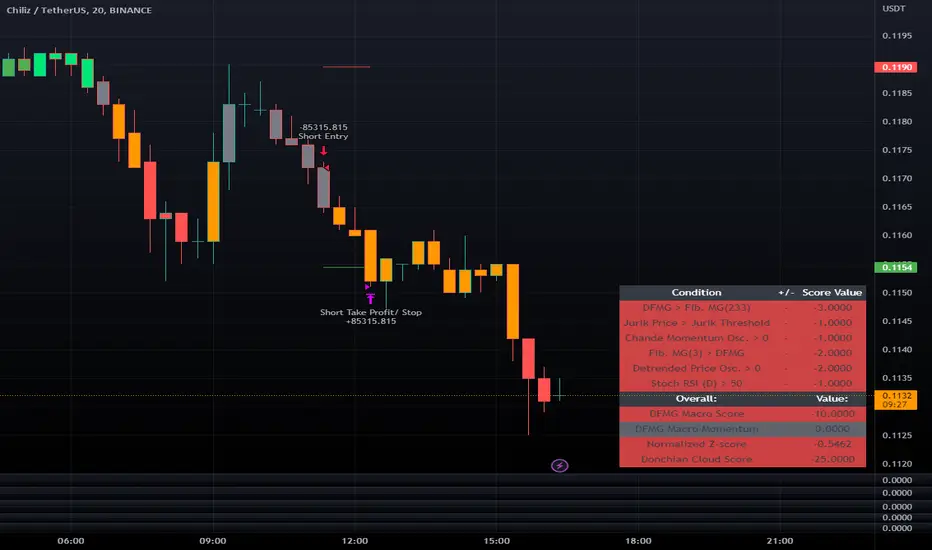
LeafAlgo Premium Macro StrategiesA "macro score", as defined here, is created by giving various weights to different signals and adding them together to get one smooth score. Positive or negative values are assigned to each of the signals depending on if the statement is true or false (e.g. DPO > 0: +1, DPO < 0: -1). This manner of strategy allows for a subset of the available signals to be present at one time as opposed to every technical signal having to be active in order for a long/short signal to trigger.
This strategy contains SIX different macro score strategies -- "Base DFMA", "Base DFMG", "Ichimoku", "TSI", "Donchian DFMA", and "Donchian DFMG". These strategies have the signals and weights pre-determined in the code. The "Base DFMA" strategy is based on our Democratic Fibonacci Moving Average (DFMA) indicator; the "Donchian DFMA" is the same as the base DFMA strategy, but with a signal from our Donchian Cloud Score indicator as added confluence. The "Base DFMG" strategy is based on our Democratic Fibonacci McGinley Dynamics (DFMG) indicator; the "Donchian DFMG" is the same, but with the Donchian Cloud Score as added confluence. The "Ichimoku" strategy is based on the major sub-indicators found within an Ichimoku Cloud in addition to our Donchian Cloud Score. The "TSI" strategy is based on the True Strength Index.
The ability to select your strategy of choice can be found at the top of the strategy settings under "Strategy Options", then in the drop-down menu labeled "Strategy Choice".
The DFMA - Democratic Fibonacci Moving Average - is a separate indicator that we have released that takes 10 different Fibonacci MAs (lengths of 3 to 233, at Fibonacci intervals) and averages them to form the DFMA line. This helps by creating a consensus on the trend based on moving averages alone. Crossovers of the DFMA with the various Fib MA lengths as well as a cross of the price source and these lines can provide adequate long and short signals. In the two DFMA strategies, the heaviest weights have been given to crosses of the DFMA line/Fib MA (233) as well as the crosses of the Fib MA (3)/DFMA. Additionally, there are thresholds for DPO ( Detrended Price Oscillator , above or below 0), CMO ( Chande Momentum Oscillator , above or below 0), Jurik Volatility Bands (above or below 0), and Stoch RSI (above or below 50). These four signals hold a lighter weight than the MA cross signals. The macro score itself ranges between -10 and 10. In addition to the macro score line, a momentum line (sourced by the macro score itself) has been included. A crossover/crossunder of the macro score and the macro momentum line is included into the long/short signal syntax in addition to a threshold for the macro score.
The DFMG - Democratic Fibonacci McGinley Dynamics - is a separate indicator that we have released that takes 10 different Fibonacci McGinley Dynamic liness (lengths of 3 to 233, at Fibonacci intervals) and averages them to form the DFMG line. This helps by creating a consensus on the trend based on moving averages alone. Crossovers of the DFMG with the various Fib MG lengths as well as a cross of the price source and these lines can provide adequate long and short signals. This strategy has the signals and weights pre-determined in the code. Heaviest weights have been given to crosses of the DFMG line/ McGinley (233) as well as the crosses of the McGinley (3)/DFMG. Additionally, there are thresholds for DPO ( Detrended Price Oscillator , above or below 0), CMO ( Chande Momentum Oscillator , above or below 0), Jurik Volatility Bands (above or below 0), and Stoch RSI (above or below 50). These four signals hold a lighter weight than the McGinley cross signals. The macro score itself ranges between -10 and 10. In addition to the macro score line, a momentum line (sourced by the macro score itself) has been included. A crossover/crossunder of the macro score and the macro momentum line is included into the long/short signal syntax in addition to a threshold for the macro score.
For the Ichimoku macro score, five signals were considered and weighted equally:
- Kijun-sen < Ichimoku Source
- Tenkan-sen < Ichimoku Source
- Kijun-sen > Chikou-span
- Tenkan-sen > Kijun-sen
- Senkou Span A > Senkou Span B
In addition to these factors, the Ichimoku strategy utilizes the Donchian Cloud Score in the long and short entry signals. Thus, the Donchian Cloud settings are applicable to this strategy.
For the True Strength Index strategy, the heaviest weights have been given to various TSI signals, including a crossover/crossunder of TSI signal and TSI value, a threshold for the TSI Signal (above or below 0), and a crossover/crossunder of the CMO ( Chande Momentum Oscillator ) and the TSI signal line. Additionally, there are thresholds for DPO ( Detrended Price Oscillator , above or below 0), Jurik Volatility Bands (above or below 0), and Stoch RSI (above or below 50). These three signals hold a lighter weight than the three TSI signals. The macro score itself ranges between -10 and 10. In addition to the macro score line, a momentum line (sourced by the macro score itself) has been included. A crossover/crossunder of the macro score and the macro momentum line is included into the long/short signal syntax in addition to a threshold for the macro score.
The Donchian Cloud Score is derived from a set of 5 Donchian channels (upper, lower, and basis plotted) defaulted to lengths of 25, 50, 100, 150, and 200. A set of conditions associated with the channels aims to determine ranging versus trending markets. Weights are given to these conditions accordingly, then tallied up to determine the "cloud score", ranging between -25 and 25. In general, a ranging market is determined by a cloud score between -10 and 10, while a positive trending market has a score higher than 10 and a negative trending market has a score lower than -10. That said, long and short thresholds similar to the macro score itself are included in the user settings and set to a default of 5 or -5. The cloud score is plotted as a line in the underlay with coloration reflecting ranging or trending markets (green color above the long threshold, gray between the thresholds, and red below the short threshold). The cloud score is incorporated into the strategy syntax for long and short positions in that the score must be above or below the set threshold for a trade to be placed. A breakdown for the Donchian scoring is as follows:
- Broke the 25-length DC (DC(25)) upper band in the previous 3 bars - +1 if true, 0 if false
- Broke the DC(50) upper band in the previous 3 bars - +2 if true, 0 if false
- Broke the DC(100) upper band in the previous 3 bars - +3 if true, 0 if false
- Broke the DC(150) upper band in the previous 3 bars - +4 if true, 0 if false
- Broke the DC(200) upper band in the previous 3 bars - +5 if true, 0 if false
- Broke the DC(25) lower band in the previous 3 bars - -1 if true, 0 if false
- Broke the DC(50) lower band in the previous 3 bars - -2 if true, 0 if false
- Broke the DC(100) lower band in the previous 3 bars - -3 if true, 0 if false
- Broke the DC(150) lower band in the previous 3 bars - -4 if true, 0 if false
- Broke the DC(200) lower band in the previous 3 bars - -5 if true, 0 if false
- DC(25) basis line above the DC(50) basis line - +1 if true, -1 if false
- DC(25) basis line above the DC(100) basis line - +1 if true, -1 if false
- DC(25)basis line above the DC(150) basis line - +1 if true, -1 if false
- DC(25) basis line above the DC(200) basis line - +1 if true, -1 if false
- DC(50) basis line above the DC(100) basis line - +1 if true, -1 if false
- DC(50) basis line above the DC(150) basis line - +1 if true, -1 if false
- DC(50) basis line above the DC(200) basis line - +1 if true, -1 if false
- DC(100) basis line above the DC(150) basis line - +1 if true, -1 if false
- DC(100) basis line above the DC(200) basis line - +1 if true, -1 if false
- DC(150) basis line above the DC(200) basis line - +1 if true, -1 if false
Thresholds for both the respective macro score and the Donchian Cloud score have been included. Entry signals for each strategy require the score to be >= the respective thresholds for longs and <= the respective thresholds for shorts.
Additionally, a normalized z-score has been included. The z-score does not affect the entry and exit signals, however, it is displayed on the chart in the form of bar coloration. The z-score has been normalized to a range of -1 to +1. A z-score under -0.60 is displayed as a red bar color, a score between -0.60 and -0.2 is displayed as an orange bar color, a score between -0.2 and 0.2 is displayed as a gray bar color, a score between 0.2 and 0.6 is displayed as a lime bar color, and a score over 0.6 is displayed in green.
Data for each respective strategy will be displayed in an overlaid table. This includes the factors that comprise the macro score of choice, the values of each signal that adds up to the macro score, the macro score itself, the value of the momentum line of the macro score, the normalized z-score value, and the Donchian Cloud score (if applicable). Green coloration notes bullish sentiment within the signals or values, gray coloration is neutral, and red coloration notes bearish sentiment.
Take profit, stop loss, and trailing percentages are also included, found at the bottom of the Input tab under “TT and TTP” as well as “Stop Loss”. The take profit and stop loss levels will be reflected as green and red lines respectively on the chart as they occur. Make sure to understand the TP/SL ratio that you desire before use, as the desired hit rate/profitability percentage will be affected accordingly. The option for adding in a trailing stop has also been included, with options to choose between an ATR-based trail or a percentage-based trail. This strategy does NOT guarantee future returns. Apply caution in trading regardless of discretionary or algorithmic. Understand the concepts of risk/reward and the intricacies of each strategy choice before utilizing them in your personal trading.
Profitview/Pineconnector Settings:
If you wish to utilize Profitview’s automation system, find the included “Profitview Settings” under the Input tab of the strategy settings menu. If not, skip this section entirely as it can be left blank. Options will be “OPEN LONG TITLE”, “OPEN SHORT TITLE”, “CLOSE LONG TITLE”, and “CLOSE SHORT TITLE”. If you wished to trade SOL, for example, you would put “SOL LONG”, “SOL SHORT”, “SOL CLOSE LONG”, and “SOL CLOSE SHORT” in these areas. Within your Profitview extension, ensure that your Alerts all match these titles. To set an alert for use with Profitview, go to the “Alerts” tab in TradingView, then create an alert. Make sure that your desired asset and timeframe are currently displayed on your screen when creating the alert. Under the “Condition” option of the alert, select the strategy, then select the expiration time. If using TradingView Premium, this can be open-ended. Otherwise, select your desired expiration time and date. This can be updated whenever desired to ensure the strategy does not expire. Under “Alert actions”, nothing necessarily needs to be selected unless so desired. Leave the “Alert name” option empty. For the “Message”, delete the generated message and replace it with {{strategy.order.alert_message}} and nothing else. If using Pineconnector, follow the same directions for setting up an alert, but use the ",buy,,risk=" syntax as noted in the tooltips.
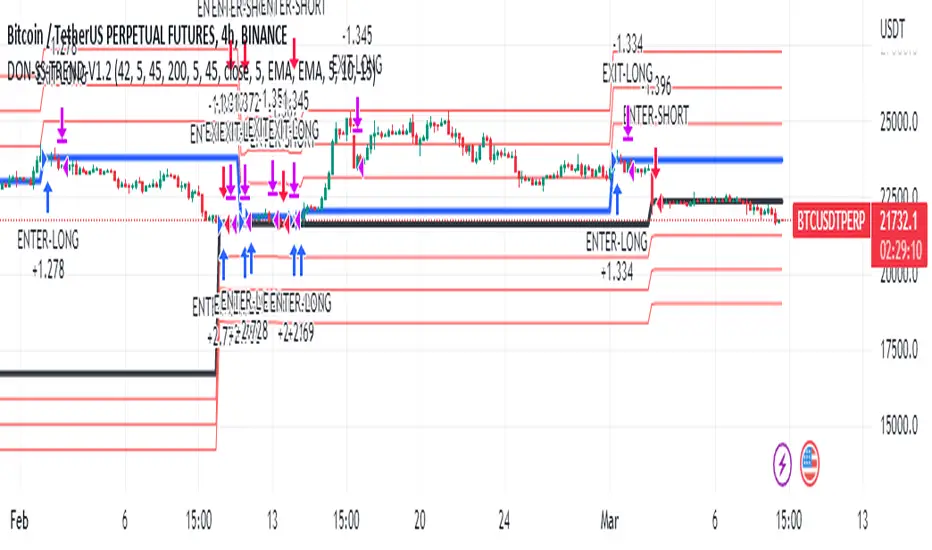
Donchian Trend V1The Donchian Trend strategy is a trend-following approach that uses the Donchian Channels indicator to identify potential entry and exit points in a security. The Donchian Channels are formed by taking the highest high and the lowest low prices over a specified period and plotting them as upper and lower channels around the current price. The width of the channels indicates the level of volatility in the market.
In this strategy, the Donchian Channels are used as a trend filter to determine the direction of the market. When the price is above the upper channel, it suggests an uptrend, and when the price is below the lower channel, it indicates a downtrend. The length of the Donchian Channels is a key parameter in the strategy, as it determines the look-back period for identifying the high and low prices.
Additional Logic: To further refine the entry and exit signals, The script uses two moving averages, a fast one (MA5) and a slow one (MA45), to identify trends and generate trading signals. When the fast moving average crosses above the slow moving average, a buy signal is generated, indicating that the market is trending upwards. Conversely, when the fast moving average crosses below the slow moving average, a sell signal is generated, indicating that the market is trending downwards.
Evaluation: The script was backtested on historical price data for the pair. The backtest results showed that the script was able to generate a net profit of , with a profit factor of and a Sharpe ratio of . The script also includes metrics such as the number of winning and losing trades, the average trade, and the largest winning and losing trades.
The strategy is evaluated based on its net profit, gross profit, gross loss, max run-up, max drawdown, buy & hold return, Sharpe ratio, Sortino ratio, and profit factor. The parameters used in the backtest include a Donchian Channel length of 42, which corresponds to a weekly time with divide of 4h time frame, and a short-term MA of 5 and a long-term MA of 45 for more accurate entry and exit signals.
Disclaimer: This script is for educational and research purposes only and should not be used for trading with real money without further testing and validation. Past performance is not indicative of future results.
Double Alligator x Donchian Cloud StrategyThis strategy is based on two sets of Williams Alligator indicators, taking crossovers and crossunders of the two pairs of lips as the main entry signal with confluence from the Donchian Cloud. The first Alligator used is set to the standard 13/8/5 lengths found in the standard indicator. The second Alligator is multiplied tenfold (10x) to 130/80/50 with the offset values also being multiplied. This second set is colored yellow, aqua, and purple for the jaw, teeth, and lips, respectively. A strategy similar to a moving average crossover can be created using these sets of Alligator indicators. While there are 6 lines in total, and can be used for discretionary matters outside of the strategy entry/exits, a cross of the lip pairs seems to yield the most optimal results. As a filter for these signals, we have introduced our Donchian Cloud Score code.
The Donchian Cloud Score is derived from a set of 5 Donchian channels (upper, lower, and basis plotted) defaulted to lengths of 25, 50, 100, 150, and 200. A set of conditions associated with the channels aims to determine ranging versus trending markets. Weights are given to these conditions accordingly, then tallied up to determine the "cloud score", ranging between -25 and 25. In general, a ranging market is determined by a cloud score between -10 and 10, while a positive trending market has a score higher than 10 and a negative trending market has a score lower than -10. That said, long and short thresholds similar to the macro score itself are included in the user settings and set to a default of 3 or -3. Trade frequency will increase the closer these numbers are to zero, however, the stronger (yet infrequent) signals come with values approaching +/- 10 or greater. The cloud score is plotted as a line in the underlay with coloration reflecting ranging or trending markets (green color above the long threshold, gray between the thresholds, and red below the short threshold). The cloud score is incorporated into the strategy syntax for long and short positions in that the score must be above or below the set threshold for a trade to be placed. A breakdown for the Donchian scoring is as follows:
- Broke the 25-length DC (DC(25)) upper band in the previous 3 bars - +1 if true, 0 if false
- Broke the DC(50) upper band in the previous 3 bars - +2 if true, 0 if false
- Broke the DC(100) upper band in the previous 3 bars - +3 if true, 0 if false
- Broke the DC(150) upper band in the previous 3 bars - +4 if true, 0 if false
- Broke the DC(200) upper band in the previous 3 bars - +5 if true, 0 if false
- Broke the DC(25) lower band in the previous 3 bars - -1 if true, 0 if false
- Broke the DC(50) lower band in the previous 3 bars - -2 if true, 0 if false
- Broke the DC(100) lower band in the previous 3 bars - -3 if true, 0 if false
- Broke the DC(150) lower band in the previous 3 bars - -4 if true, 0 if false
- Broke the DC(200) lower band in the previous 3 bars - -5 if true, 0 if false
- DC(25) basis line above the DC(50) basis line - +1 if true, -1 if false
- DC(25) basis line above the DC(100) basis line - +1 if true, -1 if false
- DC(25)basis line above the DC(150) basis line - +1 if true, -1 if false
- DC(25) basis line above the DC(200) basis line - +1 if true, -1 if false
- DC(50) basis line above the DC(100) basis line - +1 if true, -1 if false
- DC(50) basis line above the DC(150) basis line - +1 if true, -1 if false
- DC(50) basis line above the DC(200) basis line - +1 if true, -1 if false
- DC(100) basis line above the DC(150) basis line - +1 if true, -1 if false
- DC(100) basis line above the DC(200) basis line - +1 if true, -1 if false
- DC(150) basis line above the DC(200) basis line - +1 if true, -1 if false
Take profit, stop loss, and trailing percentages are also included, found at the bottom of the Input tab under “TT and TTP” as well as “Stop Loss”. Make sure to understand the TP/SL ratio that you desire before use, as the desired hit rate/profitability percentage will be affected accordingly. The option for adding in a trailing stop has also been included, with options to choose between an ATR-based trail or a percentage-based trail. This strategy does NOT guarantee future returns. Apply caution in trading regardless of discretionary or algorithmic. Understand the concepts of risk/reward and the intricacies of each strategy choice before utilizing them in your personal trading.
Profitview/Pineconnector Settings:
If you wish to utilize Profitview’s automation system, find the included “Profitview Settings” under the Input tab of the strategy settings menu. If not, skip this section entirely as it can be left blank. Options will be “OPEN LONG TITLE”, “OPEN SHORT TITLE”, “CLOSE LONG TITLE”, and “CLOSE SHORT TITLE”. If you wished to trade SOL, for example, you would put “SOL LONG”, “SOL SHORT”, “SOL CLOSE LONG”, and “SOL CLOSE SHORT” in these areas. Within your Profitview extension, ensure that your Alerts all match these titles. To set an alert for use with Profitview, go to the “Alerts” tab in TradingView, then create an alert. Make sure that your desired asset and timeframe are currently displayed on your screen when creating the alert. Under the “Condition” option of the alert, select the strategy, then select the expiration time. If using TradingView Premium, this can be open-ended. Otherwise, select your desired expiration time and date. This can be updated whenever desired to ensure the strategy does not expire. Under “Alert actions”, nothing necessarily needs to be selected unless so desired. Leave the “Alert name” option empty. For the “Message”, delete the generated message and replace it with {{strategy.order.alert_message}} and nothing else. If using Pineconnector, follow the same directions for setting up an alert, but use the ",buy,,risk=" syntax as noted in the tooltips.
Macro Score (DFMA) and Donchian Cloud Score StrategyA "macro score", as defined here, is created by giving various weights to different signals and adding them together to get one smooth score. Positive or negative values are assigned to each of the signals depending on if the statement is true or false (e.g. DPO > 0: +1, DPO < 0: -1). This manner of strategy allows for a subset of the available signals to be present at one time as opposed to every technical signal having to be active in order for a long/short signal to trigger.
The DFMA - Democratic Fibonacci Moving Average - is a separate indicator that we have released that takes 10 different Fibonacci MAs (lengths of 3 to 233, at Fibonacci intervals) and averages them to form the DFMA line. This helps by creating a consensus on the trend based on moving averages alone. Crossovers of the DFMA with the various Fib MA lengths as well as a cross of the price source and these lines can provide adequate long and short signals.
This strategy has the signals and weights pre-determined in the code. Heaviest weights have been given to crosses of the DFMA line/Fib MA (233) as well as the crosses of the Fib MA (3)/DFMA. Additionally, there are thresholds for DPO ( Detrended Price Oscillator , above or below 0), CMO ( Chande Momentum Oscillator , above or below 0), Jurik Volatility Bands (above or below 0), and Stoch RSI (above or below 50). These four signals hold a lighter weight than the MA cross signals.
The macro score itself is printed in an underlay as a white line that goes between -10 and 10 for this strategy. In addition to the macro score line, a blue momentum line (sourced by the macro score itself) has been included. A crossover/crossunder of the macro score and the macro momentum line is included into the long/short signal syntax in addition to a threshold for the macro score. Long and short thresholds can be determined by the user in the settings menu.
The Donchian Cloud Score is derived from a set of 5 Donchian channels (upper, lower, and basis plotted) defaulted to lengths of 25, 50, 100, 150, and 200. A set of conditions associated with the channels aims to determine ranging versus trending markets. Weights are given to these conditions accordingly, then tallied up to determine the "cloud score", ranging between -25 and 25. In general, a ranging market is determined by a cloud score between -10 and 10, while a positive trending market has a score higher than 10 and a negative trending market has a score lower than -10. That said, long and short thresholds similar to the macro score itself are included in the user settings and set to a default of 5 or -5. The cloud score is plotted as a line in the underlay with coloration reflecting ranging or trending markets (green color above the long threshold, gray between the thresholds, and red below the short threshold). The cloud score is incorporated into the strategy syntax for long and short positions in that the score must be above or below the set threshold for a trade to be placed. A breakdown for the Donchian scoring is as follows:
- Broke the 25-length DC (DC(25)) upper band in the previous 3 bars - +1 if true, 0 if false
- Broke the DC(50) upper band in the previous 3 bars - +2 if true, 0 if false
- Broke the DC(100) upper band in the previous 3 bars - +3 if true, 0 if false
- Broke the DC(150) upper band in the previous 3 bars - +4 if true, 0 if false
- Broke the DC(200) upper band in the previous 3 bars - +5 if true, 0 if false
- Broke the DC(25) lower band in the previous 3 bars - -1 if true, 0 if false
- Broke the DC(50) lower band in the previous 3 bars - -2 if true, 0 if false
- Broke the DC(100) lower band in the previous 3 bars - -3 if true, 0 if false
- Broke the DC(150) lower band in the previous 3 bars - -4 if true, 0 if false
- Broke the DC(200) lower band in the previous 3 bars - -5 if true, 0 if false
- DC(25) basis line above the DC(50) basis line - +1 if true, -1 if false
- DC(25) basis line above the DC(100) basis line - +1 if true, -1 if false
- DC(25)basis line above the DC(150) basis line - +1 if true, -1 if false
- DC(25) basis line above the DC(200) basis line - +1 if true, -1 if false
- DC(50) basis line above the DC(100) basis line - +1 if true, -1 if false
- DC(50) basis line above the DC(150) basis line - +1 if true, -1 if false
- DC(50) basis line above the DC(200) basis line - +1 if true, -1 if false
- DC(100) basis line above the DC(150) basis line - +1 if true, -1 if false
- DC(100) basis line above the DC(200) basis line - +1 if true, -1 if false
- DC(150) basis line above the DC(200) basis line - +1 if true, -1 if false
Take profit, stop loss, and trailing percentages are also included, found at the bottom of the Input tab under “TT and TTP” as well as “Stop Loss”. Make sure to understand the TP/SL ratio that you desire before use, as the desired hit rate/profitability percentage will be affected accordingly. The option for adding in a trailing stop has also been included, with options to choose between an ATR-based trail or a percentage-based trail. This strategy does NOT guarantee future returns. Apply caution in trading regardless of discretionary or algorithmic. Understand the concepts of risk/reward and the intricacies of each strategy choice before utilizing them in your personal trading.
Profitview/Pineconnector Settings:
If you wish to utilize Profitview’s automation system, find the included “Profitview Settings” under the Input tab of the strategy settings menu. If not, skip this section entirely as it can be left blank. Options will be “OPEN LONG TITLE”, “OPEN SHORT TITLE”, “CLOSE LONG TITLE”, and “CLOSE SHORT TITLE”. If you wished to trade SOL, for example, you would put “SOL LONG”, “SOL SHORT”, “SOL CLOSE LONG”, and “SOL CLOSE SHORT” in these areas. Within your Profitview extension, ensure that your Alerts all match these titles. To set an alert for use with Profitview, go to the “Alerts” tab in TradingView, then create an alert. Make sure that your desired asset and timeframe are currently displayed on your screen when creating the alert. Under the “Condition” option of the alert, select the strategy, then select the expiration time. If using TradingView Premium, this can be open-ended. Otherwise, select your desired expiration time and date. This can be updated whenever desired to ensure the strategy does not expire. Under “Alert actions”, nothing necessarily needs to be selected unless so desired. Leave the “Alert name” option empty. For the “Message”, delete the generated message and replace it with {{strategy.order.alert_message}} and nothing else. If using Pineconnector, follow the same directions for setting up an alert, but use the ",buy,,risk=" syntax as noted in the tooltips.

Donchian Cloud Score w/ TableThis indicator contains a set of 5 Donchian channels (upper, lower, and basis plotted) defaulted to lengths of 25, 50, 100, 150, and 200. A set of conditions associated with the channels aims to determine ranging versus trending markets. Weights are given to these conditions accordingly, then tallied up to determine the "cloud score", ranging between -25 and 25. For the purposes of this indicator, a ranging market is determined by a cloud score between -10 and 10, while a positive trending market has a score higher than 10 and a negative trending market has a score lower than -10. This score is accompanied by altered bar color to reflect the score - gray for ranging markets, green for positive trending markets, and red for negative trending markets. Breaking of upper or lower Donchian bands is typically a good indication of a potential breakout. Having a weighted system for these conditions will provide more insight and layers of confirmation into a Donchian breakout trading strategy. The table will reflect these values through positive, negative, and neutral coloration.
The list of conditions and their associated weights for this indicator are as follows:
- Broke the 25-length DC (DC(25)) upper band in the previous 3 bars - +1 if true, 0 if false
- Broke the DC(50) upper band in the previous 3 bars - +2 if true, 0 if false
- Broke the DC(100) upper band in the previous 3 bars - +3 if true, 0 if false
- Broke the DC(150) upper band in the previous 3 bars - +4 if true, 0 if false
- Broke the DC(200) upper band in the previous 3 bars - +5 if true, 0 if false
- Broke the DC(25) lower band in the previous 3 bars - -1 if true, 0 if false
- Broke the DC(50) lower band in the previous 3 bars - -2 if true, 0 if false
- Broke the DC(100) lower band in the previous 3 bars - -3 if true, 0 if false
- Broke the DC(150) lower band in the previous 3 bars - -4 if true, 0 if false
- Broke the DC(200) lower band in the previous 3 bars - -5 if true, 0 if false
- DC(25) basis line above the DC(50) basis line - +1 if true, -1 if false
- DC(25) basis line above the DC(100) basis line - +1 if true, -1 if false
- DC(25)basis line above the DC(150) basis line - +1 if true, -1 if false
- DC(25) basis line above the DC(200) basis line - +1 if true, -1 if false
- DC(50) basis line above the DC(100) basis line - +1 if true, -1 if false
- DC(50) basis line above the DC(150) basis line - +1 if true, -1 if false
- DC(50) basis line above the DC(200) basis line - +1 if true, -1 if false
- DC(100) basis line above the DC(150) basis line - +1 if true, -1 if false
- DC(100) basis line above the DC(200) basis line - +1 if true, -1 if false
- DC(150) basis line above the DC(200) basis line - +1 if true, -1 if false

Super 8 - 30M BTCWelcome to Super 8, the ultimate automatic trading script for Pine!
This bad boy is designed to go both long and short, and it's equipped with all the tools you need to maximize your profits. Whether you're looking to take profit, set a trailing stop, or protect yourself with a stop loss, Super 8 has you covered.
But that's not all! Super 8 is also loaded with 8 powerful indicators to help you make informed decisions. We've got the EMA, ADX, SAR, MACD, VOLUME, BOLLINGER BANDS, DONCHIAN, and ATR all working together to give you the best possible trading experience.
And if you want to take it to the next level, Super 8 also has a feature that lets you use stepped entries in normal mode or incremental 1,2,3,... to improve your average price. Plus, if you're using trailing stop, you can activate the Backtest precision to use lower timeframes.
But what's in a name? Super 8 is called that because it's just that... super! It's tailored specifically for the OKX:BTCUSDT.P pair, so you know you're getting the best possible results. it's highly adjustable and can be used with any other pair. So no matter what market you're trading in, Super 8 has got you covered.
So if you want to level up your trading game, give Super 8 a try. You won't be disappointed.
Certain Risks of Live Algorithmic Trading:
Backtesting Cannot Assure Actual Results.
The relevant market might fail or behave unexpectedly.
Your broker may experience failures in its infrastructure, fail to execute your orders in a correct or timely fashion or reject your orders.
The system you use for generating trading orders, communicating those orders to your broker, and receiving queries and trading results from your broker may fail.
Time lag at various point in live trading might cause unexpected behavior.
The systems of third parties in addition to those of the provider from which we obtain various services, your broker, and the applicable securities market may fail or malfunction.

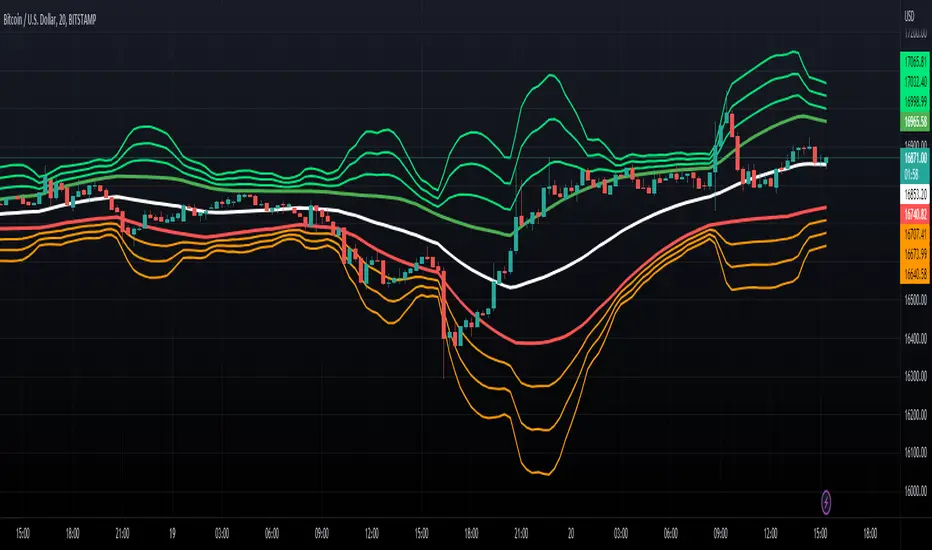
McGinley Dynamic x Donchian ChannelsThis indicator combines the McGinley Dynamic and Donchian Channels by taking the lowest and highest values over a set length (defaulted to 14) then applying the McGinley Dynamic math to these values. The upper range is denoted by a green line while the lower range is denoted by a red line. Additionally, standard deviations of 1, 2, and 3 have been put in place using the upper and lower values as the basis for the deviations as opposed to the baseline average of the upper and lower bands. These deviations are plotted as lime and orange colors. These channels can be used to determine when the price is gaining or losing momentum based on the distance between the channels. Otherwise, the channels can be used to determine potential overbought and oversold levels.
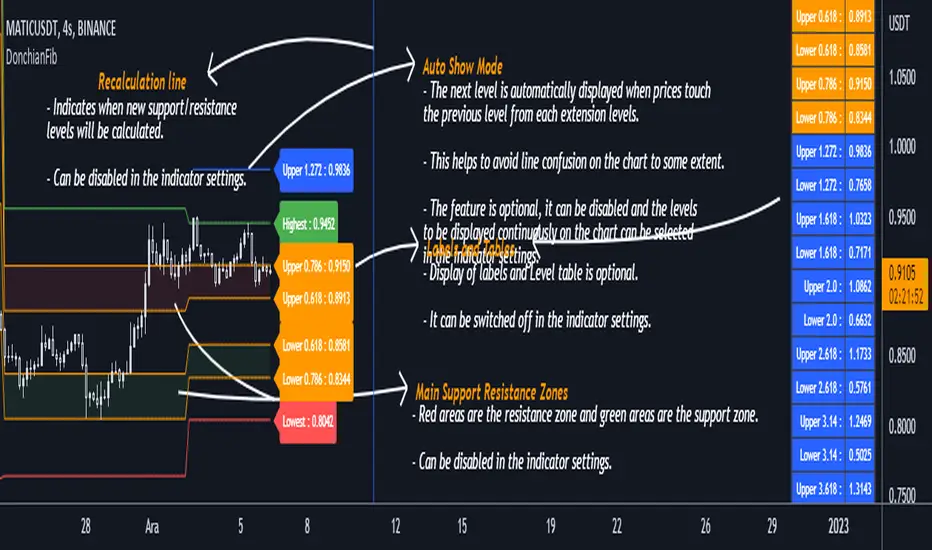
DonchianFib[Akcay]How does it work?
- The indicator detects the highest and lowest price level in the last x periods every time prices advance by x periods.
- From these values, retracement (0.618, 0.786) and expansion levels (1.272, 1.618, 2, 2.618, 3.14, 3.618, 4.236) are obtained.
- Since the symmetrical counterpart of the retracement levels is used, there are two of each of the 0.618 and 0.786 lines, for a total of four.
How can it be used?
- It can be used for step buying.
- It can be used for step selling.
- Can be used to set a profit target.
- Can be used to set a stop target.
- This indicator can be used in the same way as Pivot levels can be used. You can think of this indicator like the Pivot Points Standard indicator, where you set the period more flexibly.
Which indicators can it be combined with?
- I don't think there are any limitations, but I think it is compatible with trend detection indicators, trend detection with DonchianFib, and stepped buy/sell with limit orders.
- If you want to enter a position with mismatch signals, you can wait for the DonchianFib levels to break.
- Its use is limited by your imagination :)
Where does the name come from?
- As the name suggests, Donchian Channels. I was inspired by Donchian Channels when developing the indicator. Donchian channels show the highs and lows of prices over the last x number of periods. DonchianFib does this once for every x periods and uses the fibonacci levels to create upper and intermediate levels.
Note : I don't know if such an indicator has been done before or not. If it has been done, I haven't seen it in tradingview.
Çalışma mantığı nedir ?
- Gösterge, fiyatlar her x periyot kadar ilerlediğinde son x periyot içerisindeki en yüksek ve en düşük fiyat seviyesini tespit eder.
- Bu değerler üzerinden geri çekilme (0.618, 0.786) ve genişleme seviyeleri (1.272, 1.618, 2, 2.618, 3.14, 3.618, 4.236) elde edilir.
- Geri çekilme seviyelerinin simetrik karşılığı kullanıldığından 0.618 ve 0.786 çizgilerinden her birinden iki adet olmak üzere toplamda dört adet bulunur.
Nasıl kullanılabilir ?
- Kademeli alım yapmak için kullanılabilir.
- Kademeli satım yapmak için kullanılabilir.
- Kâr hedefi belirlemek için kullanılabilir.
- Stop hedefi belirlemek için kullanılabilir.
- Pivot seviyelerinden nasıl faydalanılıyorsa bu göstergeden de aynı şekilde faydalanılabilir. Bu göstergeyi, periyodunu kendinizin daha esnek bir şekilde belirlediğiniz Pivot Noktalar Standartı göstergesi gibi düşünebilirsiniz.
Hangi göstergelerle kombine edilebilir ?
- Bunun için herhangi sınırlama yapmak doğru değil ancak trend tespit etmeye çalışan göstergelerle uyumlu olduğunu düşünüyorum. Bu göstergeler ile trend tespiti yapıp DonchianFib ile alım/satım yerleri belirlenebilir ve limit emirleri ile kademeli alım/satım yapılabilir.
- Uyuşmazlık sinyalleri ile pozisyona girilmek isteniliyorsa DonchianFib seviyelerinin kırılması beklenebilir.
- Kullanımı sizin hayal gücünüz ile sınırlıdır :)
Adı nereden geliyor ?
- Adından da anlaşılacağı üzere Donchian Kanallarından. Göstergeyi geliştirirken Donchian Kanallarından ilham aldım. Donchian kanalları fiyatların son x periyot içerisindeki en yüksek ve en düşük seviyelerini grafikte gösteriyor. DonchianFib ise bunu her x periyot için bir defa yapıp, fibonacci seviyelerini de kullanarak üst ve ara seviyeler oluşturuyor.
Not : Daha önce böyle bir göstergenin yapılıp yapılmadığını bilmiyorum. Yapıldı ise ben tradingview'da görmedim.
Advanced Donchian Channels
Advanced Donchian Channels displays future donchian channel values based on the current information on the chart.
It displays a normal donchian channel at the specified user length with the future values extending from the current bar.
Depending on the direction of price movement, these values do not repaint. It is known when it does and does not repaint, and the actions are normal. See below for more information.
In a down trend, when the price is making new lows, the future "channel low" value will update every time the low is broken. The mean will also update, since the mean is the average of the channel high and channel low.
In a downtrend, the "channel high" value is concrete . It will not update until the high is broken.
Reverse these examples for uptrends.
Q;
How does it know the future values?
A:
Consider This: If we are below the current highest high, going down (aka: not setting new highs), the donchian channel "high" value will create a flat top, the flat top will start to decrease after we go further than our specified length. This is because the highest high within our specified length is no longer what it was previously. This action of time decay is a consistent movement of donchian channels . Because of this I am able to calculate these values before the current bar actually reaches them.
The indicator calculates the current length donchian channel at the current bar and then for every future bar up to your length specified it subtracts 1 from your length, calculates and displays the values accordingly.
The farthest future value is 1 length and the current bar is your specified length.
VALUES WILL ONLY BE UPDATED WHEN THE CHANNEL HIGH OR LOW IS BROKEN.
If price stays within the channel, all the future channel values will become solidified when the time reaches them.
This is not a gimmick, This data is accurate and can be used to help see future price trends
This chart should assist in visualizing what data you are seeing in this indicator.
Enjoy!

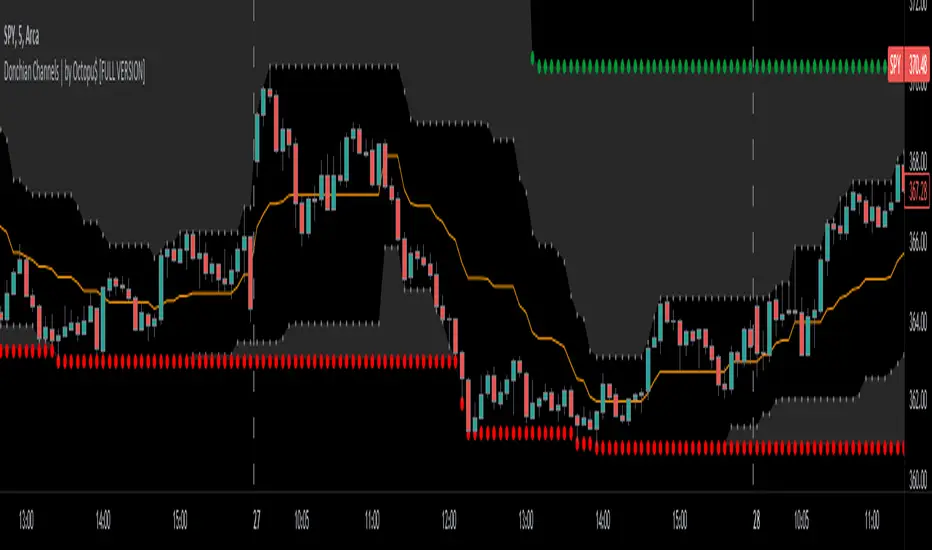
Donchian Channels with Limits and Shadows | by Octopu$ 🌊 Donchian Channels with Middle Line, Limits and Shadows | by Octopu$
Donchian Channels are three lines generated by Moving Average calculations.
These lines formed by upper and lower bands around a midrange or median band.
The Upper Band marks the Highest price of a security over X periods of time.
While the Lower Band marks the Lowest price over the same period.
Now, the Limit bands are the High and Low prices over a Y period of time (different than X)
The difference about using Limits with the Bands on Donchian Channels is the time length:
By using different time comparisons (X and Y) you are able to identify previous Highs and Lows.
This is very useful for Support and Resistance levels regarding the Price Action
As well as Pivot Points, considering the possibility off Breakouts or Bounces.
Usually - as a General Rule - the Price tends to navigate in-between these channels
That's where DC Channels + Limits w/ Shadows come into play!
Highs and Lows serve as Supply and Demand Zones as well.
The Middle Line can be used as a spot for Reversal/Continuation.
All of this also makes the Donchian Channels a great tool for Trend Identification.
The combination of your understanding and analysis as well as other Indicators and Factors as Confluence, you can improve your Charting Analysis.
www.tradingview.com
AMEX:SPY
ANY Ticker. ANY Timeframe.
( SPY 5m as an example only.)
Features:
• Upper Channel
• Lower Channel
• Limit High
• Limit Low
• Middle Line
• Shadow
Options:
• Color Picker
• Line Styling
• Toggle On/Off
• Length Customization
• Background Transparency
Notes:
v1.0
Indicator release.
Changes and updates can come in the future for additional functionalities or per requests. Follow and Stay Tuned!
Did you like it? Please Support and Shoot me a message! I'd appreciate if you dropped by to say thanks! Thank you.
- Octopu$
🐙