Breakout FilterIntroduction:
The Breakout Filter is a technical analysis indicator designed to identify potential breakout trading opportunities in the financial markets. It combines breakout conditions based on price and volume with the visualization of Exponential Moving Average (EMA) lines. This indicator can be a valuable tool for traders seeking to capture breakout movements while utilizing EMA lines for additional trend analysis.
Indicator Overview:
The Breakout Filter consists of three main filters: Filter 1, Filter 2, and Filter 3. Each filter has its own set of conditions that need to be met for a breakout signal to be generated. Additionally, the indicator plots EMA lines on the chart to provide further insights into the market trend.
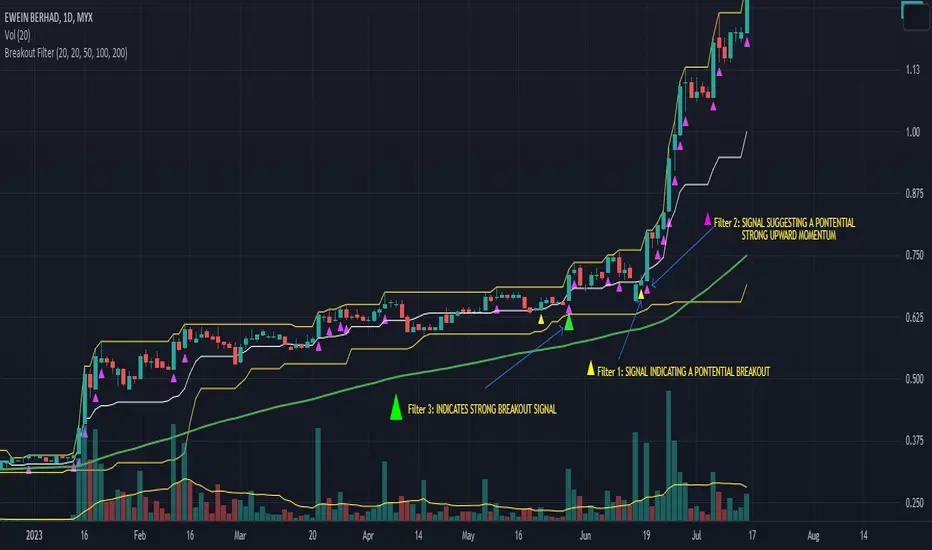
Filter 1: Price & Volume Breakout (Default symbol: Tiny Yellow Triangle)
Filter 1 focuses on identifying breakouts based on both price and volume criteria. It considers the following conditions:
- Price Breakout: The close price crosses above the Donchian Channel's middle line, indicating a potential upward breakout.
- Volume Breakout: The trading volume exceeds the moving average of volume, suggesting increased market participation during the breakout.
When both the price breakout and volume breakout conditions are met, Filter 1 generates a signal indicating a potential breakout in the market. This filter helps traders identify significant price movements accompanied by higher trading volumes.
Filter 2: Upper Band Breakout
Filter 2 specifically looks for breakouts above the upper band of the Donchian Channel. This condition suggests a potential strong upward momentum in the market. When the high price exceeds the upper band, Filter 2 generates a signal, indicating a breakout above the recent price range.
Filter 3: Combined Filter 1 and Filter 2
Filter 3 combines the conditions of both Filter 1 and Filter 2. It requires that both Filter 1 and Filter 2 generate signals simultaneously. When this happens, it indicates a strong breakout signal with price and volume confirming the upward momentum.
EMA Lines:
The Breakout Filter with EMA Lines also includes the visualization of Exponential Moving Average (EMA) lines on the chart. EMA is a popular technical indicator used to identify the overall trend in the market. The indicator plots three EMA lines with different periods: EMA1, EMA2, and EMA3. Traders can choose the periods for each EMA line based on their preference and trading strategy.
The EMA lines can provide additional insights into the market trend and potential support or resistance levels. By observing the interaction between the price and the EMA lines, traders can gain a better understanding of the prevailing market sentiment and make informed trading decisions.
How to screen these filters using Trading View Screener
Insert column "DONCHIAN20 UP" and set to "EQUAL HIGH"
Conclusion:
The Breakout Filter with EMA Lines is a comprehensive indicator that combines breakout conditions based on price and volume with the visualization of EMA lines. It helps traders identify potential breakout trading opportunities while providing insights into the market trend. By using this indicator, traders can enhance their trading strategies and potentially improve their trading outcomes.
Please note that this write-up is for informational purposes only and should not be considered as financial advice. Traders should conduct their own analysis and exercise caution when making trading decisions.
Canali Donchian (DC)
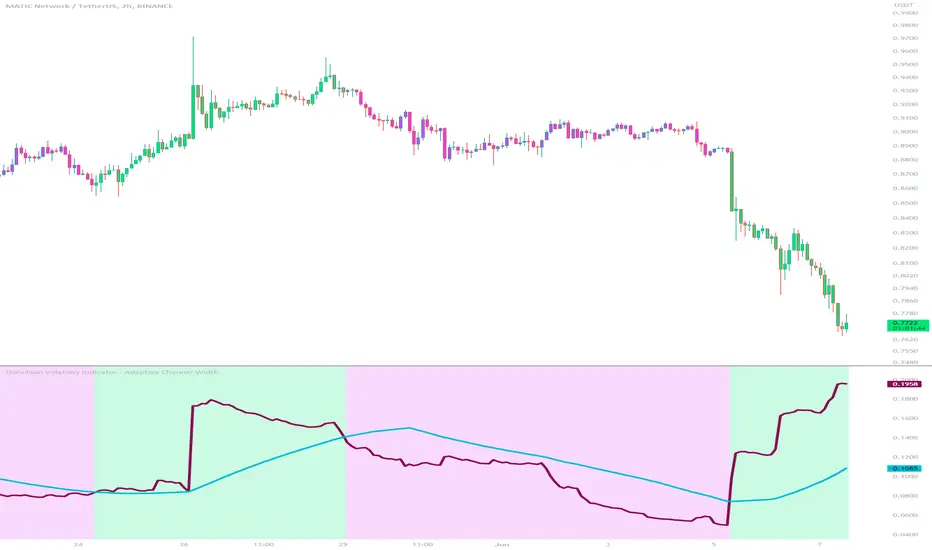
Donchian Volatility Indicator - Adaptive Channel WidthThis indicator is designed to help traders assess and analyze market volatility. By calculating the width of the Donchian channels, it provides valuable insights into the range of price movements over a specified period. This indicator helps traders identify periods of high and low volatility, enabling them to make more informed trading decisions.
The indicator is based on the concept of Donchian channels, which consist of the highest high and lowest low over a specified lookback period. The channel width is calculated as the difference between the upper and lower channels. A wider channel indicates higher volatility, suggesting potentially larger price movements and increased trading opportunities. On the other hand, a narrower channel suggests lower volatility, indicating a relatively calmer market environment with potentially fewer trading opportunities.
The adaptive aspect of the indicator refers to its ability to adjust the width of the channels dynamically based on market conditions. The indicator calculates the width of the channels using the Average True Range (ATR) indicator, which measures the average range of price movements over a specified period. By multiplying the ATR value with the user-defined ATR multiplier, the indicator adapts the width of the channels to reflect the current level of volatility. During periods of higher volatility, the channels expand to accommodate larger price movements, providing a broader range for assessing volatility. Conversely, during periods of lower volatility, the channels contract, reflecting the narrower price ranges and signaling a decrease in volatility. This adaptive nature allows traders to have a flexible and responsive measure of volatility, ensuring that the indicator reflects the current market conditions accurately.
To provide further insights, the indicator includes a signal line. The signal line is derived from the channel width and is calculated as a simple moving average over a specified signal period. This signal line acts as a reference level, allowing traders to compare the current channel width with the average width over a given time frame. By assessing whether the current channel width is above or below the signal line, traders can gain additional context on the volatility level in the market.
The colors used in the Donchian Volatility Indicator - Adaptive Channel Width play a vital role in visualizing the volatility levels:
-- Lime Color : When the channel width is above the signal line, it is colored lime. This color signifies that volatility has entered the market, indicating potentially higher price movements and increased trading opportunities. Traders can pay closer attention to the lime-colored channel width as it may suggest favorable conditions for trend-following or breakout trading strategies.
-- Fuchsia Color : When the channel width is below the signal line, it is colored fuchsia. This color represents relatively low volatility, suggesting a calmer market environment with potentially fewer trading opportunities. Traders may consider adjusting their strategies during periods of low volatility, such as employing range-bound or mean-reversion strategies.
-- Aqua Color : The signal line is represented by the aqua color. This color allows traders to easily identify the signal line amidst the channel width. The aqua color provides a visual reference for the average channel width and helps traders assess whether the current width is above or below this average.
The Donchian Volatility Indicator - Adaptive Channel Width has several practical applications for traders:
-- Volatility Assessment : Traders can use this indicator to assess the level of volatility in the market. By observing the width of the Donchian channels and comparing it to the signal line, they can determine whether the current volatility is relatively high or low. This information helps traders set appropriate expectations and adjust their trading strategies accordingly.
-- Breakout Trading : Wide channel widths may indicate an increased likelihood of price breakouts. Traders can use the Donchian Volatility Indicator - Adaptive Channel Width to identify potential breakout opportunities. When the channel width exceeds the signal line, it suggests a higher probability of significant price movements, potentially signaling a breakout. Traders may consider entering trades in the direction of the breakout.
-- Risk Management : The indicator can assist in setting appropriate stop-loss levels based on the current volatility. During periods of high volatility (lime-colored channel width), wider stop-loss orders may be warranted to account for larger price swings. Conversely, during periods of low volatility (fuchsia-colored channel width), narrower stop-loss orders may be appropriate to limit risk in a more range-bound market.
While the Donchian Volatility Indicator - Adaptive Channel Width is a valuable tool, it is important to consider its limitations:
-- Lagging Indicator : The indicator relies on historical price data, making it a lagging indicator. It provides insights based on past price movements and may not capture sudden changes or shifts in volatility. Traders should be aware that the indicator may not generate real-time signals and should be used in conjunction with other indicators and analysis tools.
-- False Signals : Like any technical indicator, the Donchian Volatility Indicator - Adaptive Channel Width is not immune to generating false signals. Traders should exercise caution and use additional analysis to confirm the signals generated by the indicator. Considering the broader market context and employing risk management techniques can help mitigate the impact of false signals.
-- Market Conditions : Market conditions can vary, and volatility levels can differ across different assets and timeframes. Traders should adapt their strategies and consider other market factors when interpreting the signals provided by the indicator. It is crucial to avoid relying solely on the indicator and to incorporate a comprehensive analysis of the market environment.
In conclusion, this indicator is a powerful tool for assessing market volatility. By examining the width of the Donchian channels and comparing it to the signal line, traders can gain insights into the level of volatility and adjust their trading strategies accordingly. The color-coded representation of the channel width and signal line allows for easy visualization and interpretation of the volatility dynamics. Traders should utilize this indicator as part of a broader trading approach, incorporating other technical analysis tools and considering market conditions for a comprehensive assessment of market volatility.
Donchian Channels [Gu5]█ OVERVIEW
I changed the design of the classic indicator "Donchian Channels", for easy reading.
█ CONCEPTS
Donchian Channels is an indicator made up of upper and lower bands around a mid-band or Basis.
The upper band marks the highest price of a security for N periods, while the lower band marks the lowest price of a security for N periods. The area between the upper and lower bands.
In this version, when there are new Higher High (HH), the trend is Bullish and the channel is painted green.
When there are new Lower Low (LL), the trend is Bearish and the channel is painted Red
█ OTHER SECTIONS
A plus in this script: When there are no new highs or new lows, there is no certain trend
The channel is painted yellow
www.tradingview.com
• HOW TO USE
Menu "Display"
• '■ Basis On/Off': Shows the midline Basis
• '■ Alert On/Off': Shows alerts labels
• '■ Fill On/Off': Paint the entire channel the color of the trend
• '■ Bar Color On/Off': Paint the candle the color of the trend
• '■ Close Alert On/Off': Shows alerts end of trend
• NOTES:
This code was written using the recommendations from the Pine Script™ User Manual's Style Guide
• RAMBLINGS:
You can use the "Basis" line as Trailing Stop.
• THANKS:
Donchian Channels developed by Richard Donchian
and many MANY thanks to @PineCoders

Turtle tradingA minimal breakout trend following indicator (Turtle trading). Entry is on the break of a Donchian channel and exit is on the reversal at a shorter-term Donchian channel (trailing stop).
Entry levels are hidden in an active trend, and only the active exit level is shown. Levels and entry/exit markers can be shown or hidden independently.

Donchian Channel Smoothed (Linear Regression)The script is an implementation of the Donchian Channel Smoothed indicator using linear regression to smooth the data. The indicator plots three curves: the middle curve, which represents the average of the upper and lower curves, and the upper and lower curves, which are the standard Donchian channels.
The smoothing is done using linear regression on the highest and lowest of the given period. This helps filter out the noise in the data and provides a smoother curve that can help traders identify trends and key levels of support and resistance. The advantages of using linear regression for smoothing are reduced data volatility, better identification of long-term trends, and improved ability to identify support and resistance levels.
Using this indicator, traders can identify potential entry and exit points in a trend, as well as key support and resistance levels. Donchian channels are also useful for measuring asset volatility and determining trading range boundaries.
In summary, using linear regression to smooth the data in the Donchian Channel Smoothed indicator presents significant advantages for traders, such as reduced data volatility and better identification of long-term trends. This allows traders to more easily identify support and resistance levels and make more informed trading decisions.

OBV-MACDThe OBV-MACD indicator is a momentum-based technical analysis tool that helps traders identify trend reversals and trend strength. This Pine script is an implementation of the OBV-MACD indicator that uses the On-Balance Volume (OBV) and Moving Average Convergence Divergence (MACD) indicators to provide a momentum data of OBV.
The OBV-MACD indicator uses the OBV to calculate the cumulative volume, which is then smoothed using two moving averages - fast and slow. The difference between these moving averages is plotted as a histogram, with a signal line plotted over it. A buy signal is generated when the histogram crosses above the signal line, indicating a bullish trend, while a sell signal is generated when the histogram crosses below the signal line, indicating a bearish trend.
This Pine script also includes an OBV-MACD-Donchian version that incorporates Donchian channels for the OBV-MACD. The Donchian channel is a technical analysis indicator that helps traders identify the highs and lows of an asset's price over a certain period. The OBV-MACD-Donchian version uses the OBV-MACD indicator along with the Donchian channels to provide signals that the momentum of OBV is making new high/low during that period of time.
Traders can customize the input parameters of the OBV-MACD indicator, such as the timeframe, method of calculation for the moving averages, and the lengths of the moving averages and breakout lengths. The colors of the plot can also be customized to suit the trader's preferences.

Reversal PointsHi , in this script i tried to find reversal points on big trends. For this purpose i have used Supertrend and Donchian channels. I combined both in a single indicator for finding reversal points. I am suggesting for using higher time frames like 4 hours or 1 day. It will be work in lower time frames too. But the signals will be less reliable than higher timeframes. Here is settings in this script:
New low sensitiity : this setting for donchian channels lookback. Bigger value result as less signals.
Atr Period: Period for Atr , it is for supertrend indicator in it.
Source: Source for supertrend indicator.
Atr Multiplier : Atr multiplier setting for Supertrend. Bigger value will be result as less signals.
Good luck.
Enes.

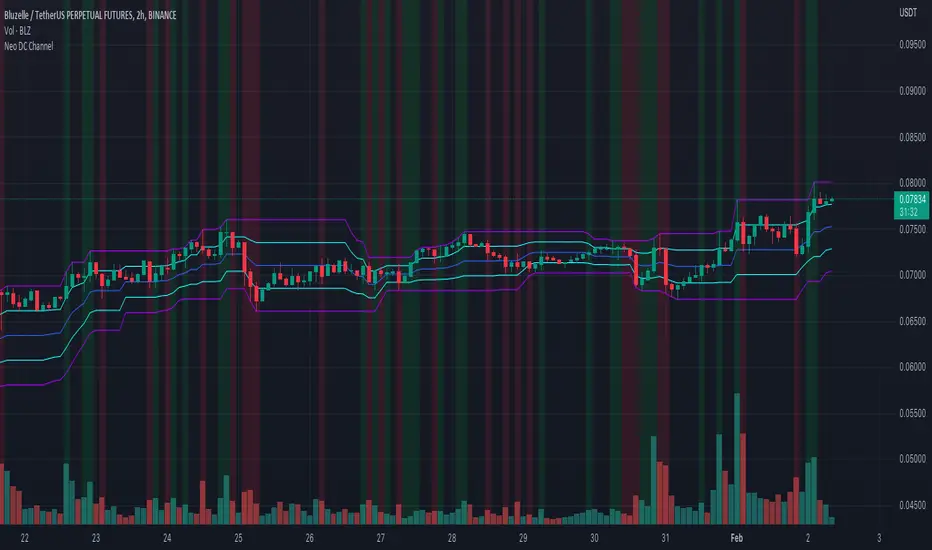
Neo DC ChannelWhat is Neo DC Channel
Neo DC Channel is using the concept of Donchian Channels but add some more functions in other to represent more data.
Donchian Channels are three lines generated by moving average calculations that comprise an indicator formed by upper and lower bands around a midrange or median band. The upper band marks the highest price of a security over N periods while the lower band marks the lowest price of a security over N periods.
The Background color will bedisplay when the bar range is more than x% of the Upper – Lower’s Donchian Channels width and the bar is cross up/down the middle line.
Green Background will display when bar is crossing up the middle line
Red Background will display when bar is crossing down the middle line
What made Neo DC Channel?
- Donchian Channels
- MA Concept
- Percentage of bar due to the Donchian Channels’s Channels width
Use of Neo DC Channel
- can be use as the confirmation indicator if trader apply the indicator to any trading strategy which already have trend identifier Indicator.
- can also be use as trend changer/switcher indicator.
Channel Based Zigzag [HeWhoMustNotBeNamed]🎲 Concept
Zigzag is built based on the price and number of offset bars. But, in this experiment, we build zigzag based on different bands such as Bollinger Band, Keltner Channel and Donchian Channel. The process is simple:
🎯 Derive bands based on input parameters
🎯 High of a bar is considered as pivot high only if the high price is above or equal to upper band.
🎯 Similarly low of a bar is considered as pivot low only if low price is below or equal to lower band.
🎯 Adding the pivot high/low follows same logic as that of regular zigzag where pivot high is always followed by pivot low and vice versa.
🎯 If the new pivot added is of same direction as that of last pivot, then both pivots are compared with each other and only the extreme one is kept. (Highest in case of pivot high and lowest in case of pivot low)
🎯 If a bar has both pivot high and pivot low - pivot with same direction as previous pivot is added to the list first before adding the pivot with opposite direction.
🎲 Use Cases
Can be used for pattern recognition algorithms instead of standard zigzag. This will help derive patterns which are relative to bands and channels.
Example: John Bollinger explains how to manually scan double tap using Bollinger Bands in this video: www.youtube.com This modified zigzag base can be used to achieve the same using algorithmic means.
🎲 Settings
Few simple configurations which will let you select the band properties. Notice that there is no zigzag length here. All the calculations depend on the bands.
With bands display, indicator looks something like this
Note that pivots do not always represent highest/lowest prices. They represent highest/lowest price relative to bands.
As mentioned many times, application of zigzag is not for buying at lower price and selling at higher price. It is mainly used for pattern recognition either manually or via algorithms. Lets build new Harmonic, Chart patterns, Trend Lines using the new zigzag?

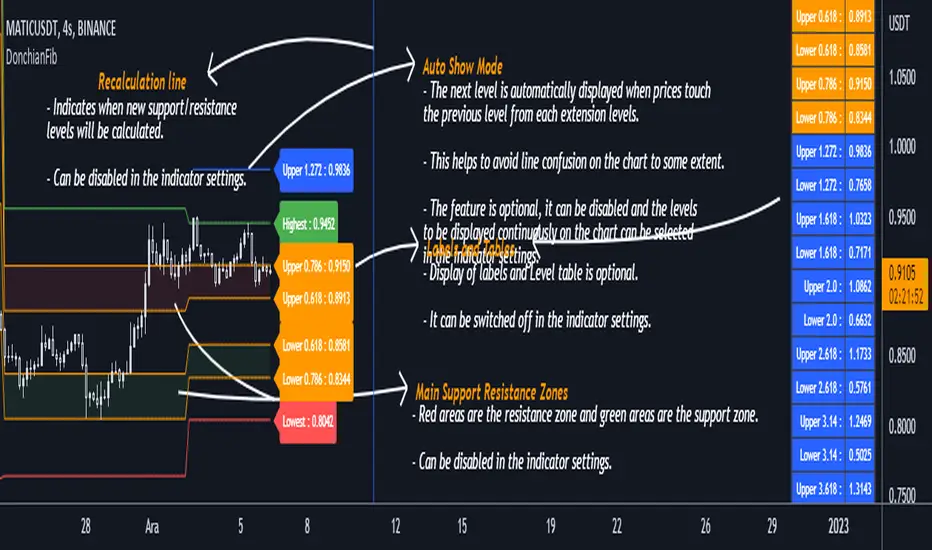
DonchianFib[Akcay]How does it work?
- The indicator detects the highest and lowest price level in the last x periods every time prices advance by x periods.
- From these values, retracement (0.618, 0.786) and expansion levels (1.272, 1.618, 2, 2.618, 3.14, 3.618, 4.236) are obtained.
- Since the symmetrical counterpart of the retracement levels is used, there are two of each of the 0.618 and 0.786 lines, for a total of four.
How can it be used?
- It can be used for step buying.
- It can be used for step selling.
- Can be used to set a profit target.
- Can be used to set a stop target.
- This indicator can be used in the same way as Pivot levels can be used. You can think of this indicator like the Pivot Points Standard indicator, where you set the period more flexibly.
Which indicators can it be combined with?
- I don't think there are any limitations, but I think it is compatible with trend detection indicators, trend detection with DonchianFib, and stepped buy/sell with limit orders.
- If you want to enter a position with mismatch signals, you can wait for the DonchianFib levels to break.
- Its use is limited by your imagination :)
Where does the name come from?
- As the name suggests, Donchian Channels. I was inspired by Donchian Channels when developing the indicator. Donchian channels show the highs and lows of prices over the last x number of periods. DonchianFib does this once for every x periods and uses the fibonacci levels to create upper and intermediate levels.
Note : I don't know if such an indicator has been done before or not. If it has been done, I haven't seen it in tradingview.
Çalışma mantığı nedir ?
- Gösterge, fiyatlar her x periyot kadar ilerlediğinde son x periyot içerisindeki en yüksek ve en düşük fiyat seviyesini tespit eder.
- Bu değerler üzerinden geri çekilme (0.618, 0.786) ve genişleme seviyeleri (1.272, 1.618, 2, 2.618, 3.14, 3.618, 4.236) elde edilir.
- Geri çekilme seviyelerinin simetrik karşılığı kullanıldığından 0.618 ve 0.786 çizgilerinden her birinden iki adet olmak üzere toplamda dört adet bulunur.
Nasıl kullanılabilir ?
- Kademeli alım yapmak için kullanılabilir.
- Kademeli satım yapmak için kullanılabilir.
- Kâr hedefi belirlemek için kullanılabilir.
- Stop hedefi belirlemek için kullanılabilir.
- Pivot seviyelerinden nasıl faydalanılıyorsa bu göstergeden de aynı şekilde faydalanılabilir. Bu göstergeyi, periyodunu kendinizin daha esnek bir şekilde belirlediğiniz Pivot Noktalar Standartı göstergesi gibi düşünebilirsiniz.
Hangi göstergelerle kombine edilebilir ?
- Bunun için herhangi sınırlama yapmak doğru değil ancak trend tespit etmeye çalışan göstergelerle uyumlu olduğunu düşünüyorum. Bu göstergeler ile trend tespiti yapıp DonchianFib ile alım/satım yerleri belirlenebilir ve limit emirleri ile kademeli alım/satım yapılabilir.
- Uyuşmazlık sinyalleri ile pozisyona girilmek isteniliyorsa DonchianFib seviyelerinin kırılması beklenebilir.
- Kullanımı sizin hayal gücünüz ile sınırlıdır :)
Adı nereden geliyor ?
- Adından da anlaşılacağı üzere Donchian Kanallarından. Göstergeyi geliştirirken Donchian Kanallarından ilham aldım. Donchian kanalları fiyatların son x periyot içerisindeki en yüksek ve en düşük seviyelerini grafikte gösteriyor. DonchianFib ise bunu her x periyot için bir defa yapıp, fibonacci seviyelerini de kullanarak üst ve ara seviyeler oluşturuyor.
Not : Daha önce böyle bir göstergenin yapılıp yapılmadığını bilmiyorum. Yapıldı ise ben tradingview'da görmedim.
Enhanced ShareGenius Swing TradingSwing Trading Strategy Features:
1. Point out candles where days low price matched 20 day low price (Blue Triangle with Yellow Bar)
2. Hollow Body candles depict days when days close is within the threshold of 20 day high (defaulted to 5%). An indication to start GTT buy orders.
3. Point out candles when GTT buy order was triggered (Light Green body)
Experimental:
1. Using tolerance to low price matching logic (instead of exact match)
As a result if the days low is within the tolerance, such candles will be highlighted with light blue triangle and yellow body

Donchian Channels Multitimeframe JaimeSimple indicador with Donchian channels multitimeframe but you can see a cloud similar to ichimoku with the middle of the donchain channels between the actual timeframe and the upper one.

Advanced Donchian Channels
Advanced Donchian Channels displays future donchian channel values based on the current information on the chart.
It displays a normal donchian channel at the specified user length with the future values extending from the current bar.
Depending on the direction of price movement, these values do not repaint. It is known when it does and does not repaint, and the actions are normal. See below for more information.
In a down trend, when the price is making new lows, the future "channel low" value will update every time the low is broken. The mean will also update, since the mean is the average of the channel high and channel low.
In a downtrend, the "channel high" value is concrete . It will not update until the high is broken.
Reverse these examples for uptrends.
Q;
How does it know the future values?
A:
Consider This: If we are below the current highest high, going down (aka: not setting new highs), the donchian channel "high" value will create a flat top, the flat top will start to decrease after we go further than our specified length. This is because the highest high within our specified length is no longer what it was previously. This action of time decay is a consistent movement of donchian channels . Because of this I am able to calculate these values before the current bar actually reaches them.
The indicator calculates the current length donchian channel at the current bar and then for every future bar up to your length specified it subtracts 1 from your length, calculates and displays the values accordingly.
The farthest future value is 1 length and the current bar is your specified length.
VALUES WILL ONLY BE UPDATED WHEN THE CHANNEL HIGH OR LOW IS BROKEN.
If price stays within the channel, all the future channel values will become solidified when the time reaches them.
This is not a gimmick, This data is accurate and can be used to help see future price trends
This chart should assist in visualizing what data you are seeing in this indicator.
Enjoy!

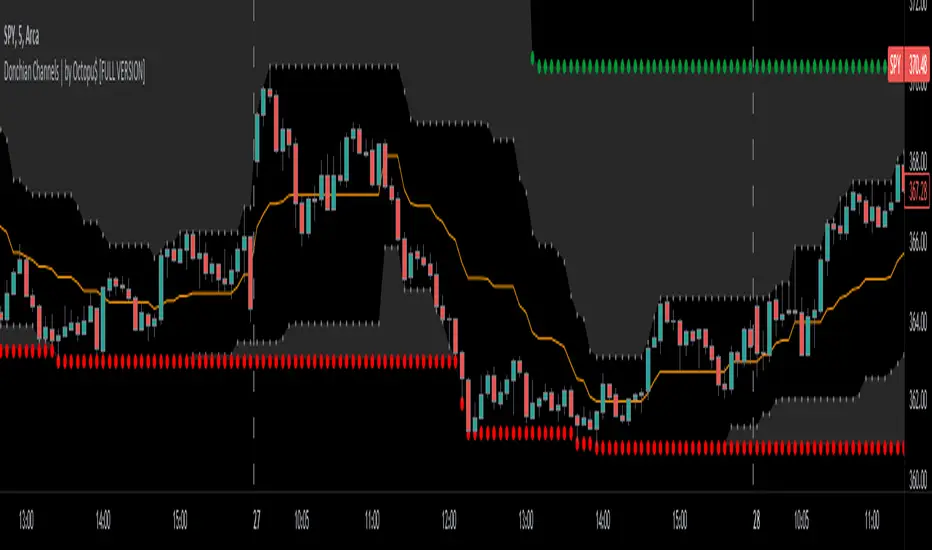
Donchian Channels with Limits and Shadows | by Octopu$ 🌊 Donchian Channels with Middle Line, Limits and Shadows | by Octopu$
Donchian Channels are three lines generated by Moving Average calculations.
These lines formed by upper and lower bands around a midrange or median band.
The Upper Band marks the Highest price of a security over X periods of time.
While the Lower Band marks the Lowest price over the same period.
Now, the Limit bands are the High and Low prices over a Y period of time (different than X)
The difference about using Limits with the Bands on Donchian Channels is the time length:
By using different time comparisons (X and Y) you are able to identify previous Highs and Lows.
This is very useful for Support and Resistance levels regarding the Price Action
As well as Pivot Points, considering the possibility off Breakouts or Bounces.
Usually - as a General Rule - the Price tends to navigate in-between these channels
That's where DC Channels + Limits w/ Shadows come into play!
Highs and Lows serve as Supply and Demand Zones as well.
The Middle Line can be used as a spot for Reversal/Continuation.
All of this also makes the Donchian Channels a great tool for Trend Identification.
The combination of your understanding and analysis as well as other Indicators and Factors as Confluence, you can improve your Charting Analysis.
www.tradingview.com
AMEX:SPY
ANY Ticker. ANY Timeframe.
( SPY 5m as an example only.)
Features:
• Upper Channel
• Lower Channel
• Limit High
• Limit Low
• Middle Line
• Shadow
Options:
• Color Picker
• Line Styling
• Toggle On/Off
• Length Customization
• Background Transparency
Notes:
v1.0
Indicator release.
Changes and updates can come in the future for additional functionalities or per requests. Follow and Stay Tuned!
Did you like it? Please Support and Shoot me a message! I'd appreciate if you dropped by to say thanks! Thank you.
- Octopu$
🐙
+ Dynamic Fibo-Donchian ChannelsThis is my second Donchian Channels indicator (and will probably be my last because how many does one really need). This version is different from my other one in that, well, it's 'dynamic' which simply means that it self adjusts based on the same formula that my Ultimate Moving Average does. What does that mean? It just means that the script takes an average of 8 different length, in this case, highest highs and lowest lows. The user doesn't need to pick a lookback/length/period/what-have-you. The indicator does it all itself. This, I think, makes for a very nice baseline or bias indicator to fit within a system that utilizes something like that. I also think it makes for a more accurate gauge of higher highs and lower lows within a timeframe, because honestly what does it mean to make a lower low over 20 periods or 8 periods or 50 periods? I don't know. What I do know is that traditional Donchian Channels never made much sense to me, but this does.
Additionally, I've kept (I guess that's not 'additionally') the fibonacci retracement levels from my other Donchian Channels indicator. These are calculated off the high and the low of the Donchian Channels themselves. You will see that there are only three retracement levels (.786, .705, .382), one of which is not a fib level, but what some people call the 'OTE,' or 'optimal trade entry.'' If you want more info on the OTE just web search it. So, why no .618 or .236? Reason being that the .618 overlaps the .382, and the .236 is extremely close to the .786. This sounds confusing, but the retracement levels I'm using are derived from the high and low, so it was unnecessary to have all five levels from each. I could have just calculated from the high, or just from the low, and used all the levels, but I chose to just calculate three levels from the high and three from the low because that gives a sort of mirror image balance, and that appeals to me, and the utility of the indicator is the same.
The plot lines are all colored, and I've filled certain zones between them. There is a center zone filled between both .382 levels, an upper and lower zon filled between the .786 and either the high or the low, and a zone between the .705 and .785
If you like the colored zones, but don't like the plots because they cause screen compression, turn off the plots under the "style" tab, or much more simply right click on the price scale and click 'scale price chart only.' Voila! No more screen compression due to a moving average or some other annoyance.
Besides that basis being a nice baseline indicator the various fib bands (or just the high and low bands) make for excellent mean reversion extremes in ranging environments.
There are alerts for candle closes across every line.
Below is an image of the indicator at default settings.
Below is an image of the indicator with the center .382 channel turned off.
Below is an image of the indicator with just the .786/.705 channel showing .
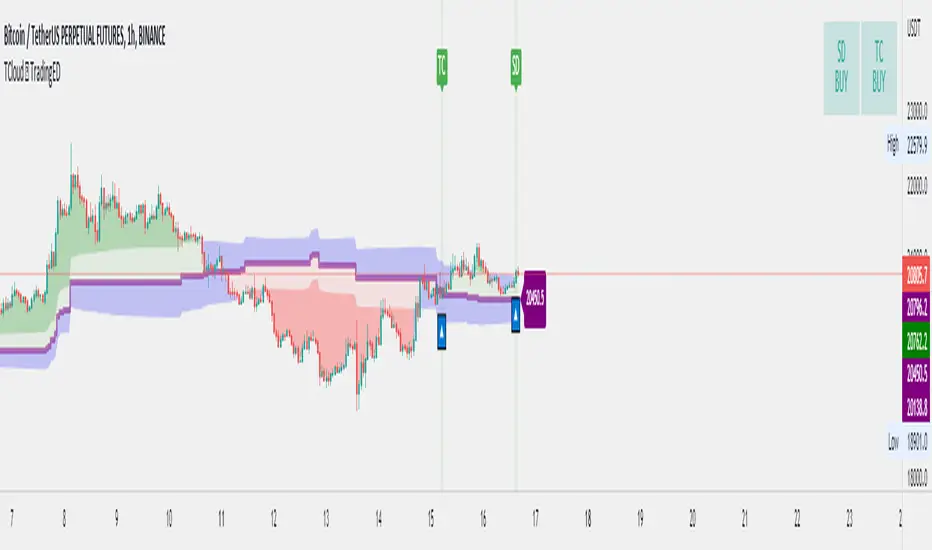
Trend Strategy - TradingEDThis case study is based on different previous studies: Trend Cloud Performance & Bollinger Bands Performance , with only one count for the different indicators and independent performance charts. The use of this indicator is restricted to private use and it can be used only by invitation. Different functionalities have been added to the original code, such as alerts and signals that seek to make trading much easier to interpret by any type of trading operator of any experience level , from beginner to intermediate and advanced.
Main functions of this modified indicator:
1) The SOURCE for the count can be determined by the trader (close, open, etc).
2) The MEASURE can be based on a CANDLES count if you are trading OHLC Charts from 1D onwards, or if your trading is intraday, you can also select counts by MINUTES , HOURS or DAYS , depending on your trading style.
3) LENGTH , by default it will be loaded as 20 but considering the previous point, you can modify it according to your convenience.
4) STANDARD DEVIATION , by default it will come loaded with 2 deviations, but you can modify it according to your convenience to operate.
6) You have the option to hide or show a LABEL at the top of the chart, with respect to the signals: bullish green, bearish red.
7) You have the option to hide or show SIGNALS based on the MOVING AVERAGES that you have previously chosen.
8) You have the option to hide or show SIGNALS based on the STANDARD DEVIATION that you have previously chosen.
Main functions to customize the style of this indicator:
a) You can select the colors for the UPPER BAND , MOVING AVERAGE and LOWER BAND depending on the trend, whether it is BEARISH or BULLISH , with the colors that best suit you. *
b) When you have a SHORT SIGNAL or a LONG SIGNAL , you can change the EMOTICON that comes by default. **
c) For any type of SIGNAL , it is painted as a VERTICAL LINE in the graph, you can change the color that comes by default. *
d) In the case of the LABELS that appear at the top, the text is not modifiable, but you can customize both the type of label and change the default color. *
e) You can select the colors for the BACKGROUND of the indicator according to the trend, whether it is BEARISH or BULLISH , with the colors that best suit you. *
* By default, they are marked as red for downtrends and green for uptrends.
** By default, they are marked with an emoticon indicating the possible direction of the price, down if it is bearish or up if it is bullish.

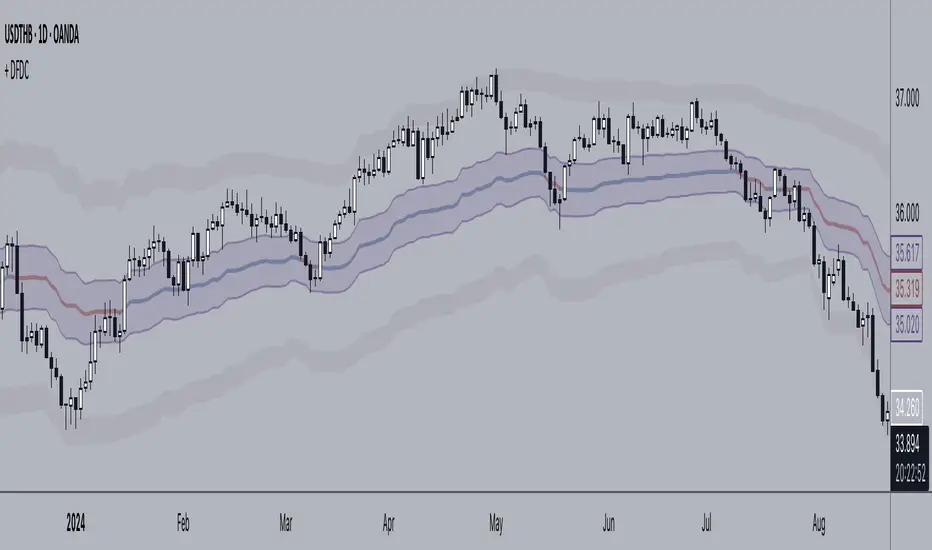
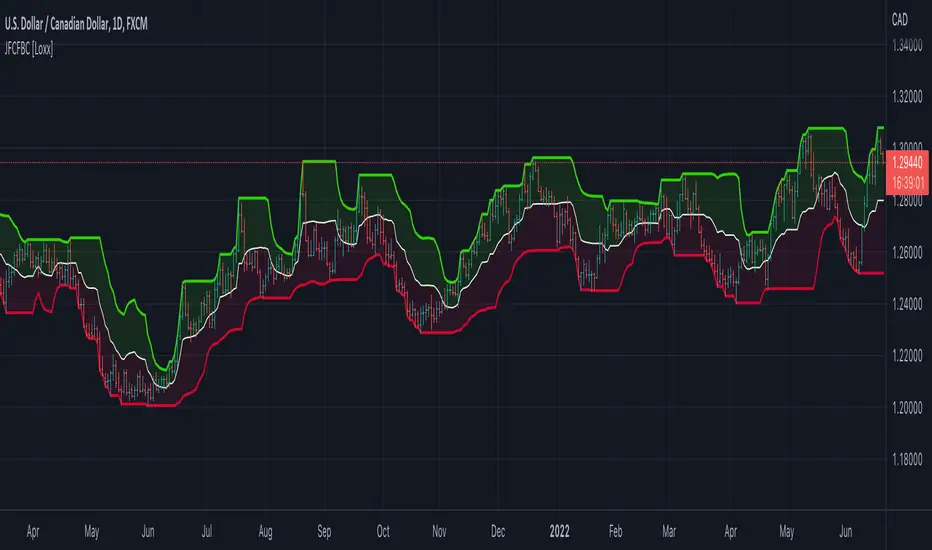
Trend Cloud Performance - TradingEDThis case study is based on a Price Level Average as in Donchian Channels but with a Variance Level (aka Standard Deviation ), and a performance chart. The use of this indicator is restricted to private use, and it can be used only by invitation. Different functionalities have been added to the original code, such as alerts and signals that seek to make trading much easier to interpret by any type of trading operator of any experience level , from beginner to intermediate and advanced.
Key components of the original indicator:
• Donchian Channels are a technical indicator seeks to identify bullish and bearish extremes that favor reversals as well as higher and lower breakouts, breakdowns, and emerging trends.
• The middle band simply computes the average between the highest high over N periods and the lowest low over N periods.
• These points identify the median or mean reversion price.
Donchian Channels are three lines generated by moving average calculations that comprise an indicator formed by upper and lower bands around a midrange or median band.
The center line identifies the median or mean reversion price for the period, highlighting the middle ground achieved for the period through the bull-bear conflict. The bottom line identifies the extent of bearish energy, highlighting the lowest price achieved for the period through the bull-bear conflict.
Main functions of this modified indicator:
1) The SOURCE for the count can be determined by the trader (close, open, etc).
2) The MEASURE can be based on a CANDLES count if you are trading OHLC Charts from 1D onwards, or if your trading is intraday, you can also select counts by MINUTES , HOURS or DAYS , depending on your trading style.
3) LENGTH , by default it will be loaded as 20 but considering the previous point, you can modify it according to your convenience.
4) STANDARD DEVIATION , by default it will come loaded with 2 deviations, but you can modify it according to your convenience to operate.
6) You have the option to hide or show a LABEL at the top of the chart, with respect to the signals: bullish green, bearish red.
7) You have the option to hide or show SIGNALS based on the MOVING AVERAGE that you have previously chosen.
8) You have the option to hide or show SIGNALS based on the STANDARD DEVIATION that you have previously chosen.
Main functions to customize the style of this indicator:
a) You can select the colors for the UPPER BAND , MOVING AVERAGE and LOWER BAND depending on the trend, whether it is BEARISH or BULLISH , with the colors that best suit you. *
b) When you have a SHORT SIGNAL or a LONG SIGNAL , you can change the EMOTICON that comes by default. **
c) For any type of SIGNAL , it is painted as a VERTICAL LINE in the graph, you can change the color that comes by default. *
d) In the case of the LABELS that appear at the top, the text is not modifiable, but you can customize both the type of label and change the default color. *
e) You can select the colors for the BACKGROUND of the indicator according to the trend, whether it is BEARISH or BULLISH , with the colors that best suit you. *
* By default, they are marked as red for downtrends and green for uptrends.
** By default, they are marked with an emoticon indicating the possible direction of the price, down if it is bearish or up if it is bullish.
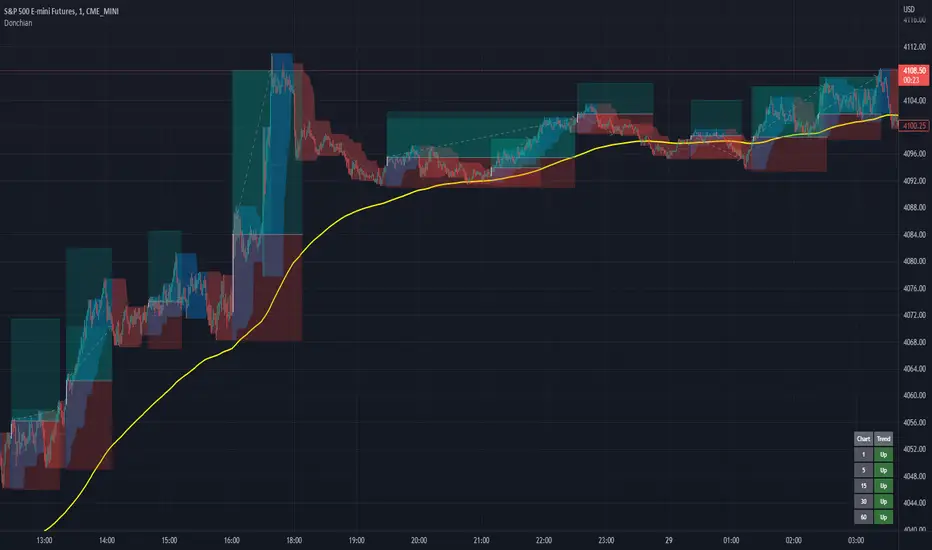
Donchian Channels+Standard Donchian Channels, this includes a Trend EMA which can be configured and the channels will use to give buy and sell signals. The channels are also colored in such a way to indicate a trend reversals. My favorite part that sets this apart from others is, if using the bClose option (which I recommend you do) the trend will not reverse until there is a close above/below the previous channel high/low. i.e. a reversal into an uptrend requires the current bar to close above the previous upper channel rather than just a new high.
The coloring of the current trend allows for a quick read of current market conditions and I use this on any timeframe across all forms of charts (forex stock, futures , crypto, etc). When taking one of the signals I use the opposite channel as the stop loss (when buying use bottom, and selling use top channel)
Update 1:
- Added my name to the code
- Updated the picture to show off the indicator better
- Raised the brightness of the fill color a bit, looks nicer I think
As a warning: I have obviously hand picked this picture to really show off this indicator's power to work in a trending market. Donchian Channels are a trending indicator and work best in trending markets with decent pull backs. If there are multiple signals going in each direction, it is a choppy market and you should stay out until it starts trending again. I generally use a 1:1.5 risk to reward ratio but sometimes will stretch it to 1:2 if it is a nice trade and I feel the market is in my favor as you can see from the trades placed in the picture (and I use that method for any commodity / chart and timeframe). I use the close of the white candle and then (since they are trades going short) I use the upper Donchian Channel as my stop loss.
I personally like to have the lines and labels turned off and enable all other options. Labels are just there to really stand out so you don't miss the white candle indication for a trade. OH! Also, I've had comments from friends that the white candles are hard to see, I turn off my candle borders in settings; makes it super easy to see them then. I turn lines off as the fill does the job well enough and it seems cleaner in my eyes.
If you'd like to see this picture on your chart, it is Micro E-Mini S&P 500 Futures from July 10, 2022 @ 18:00 on the 1-min chart.
just now
Update 2:
- Added day trading time highlights
- Added ranging market indicator (This I'm still working on so use at your own discretion, it's intended purpose is to tell when the Donchian Channels are not going to give great signals and to use a ranging indicator instead)
- Added multi-timeframe trend screener (handy if you want to quickly see the trend direction (based on the Trend EMA you set) of several time frames without having to change charts). It will draw in the bottom right of the chart.
Donchian with Trend IndicatorStandard Donchian Channels, this includes a Trend EMA which can be configured and the channels will use to give buy and sell signals. The channels are also colored in such a way to indicate a trend reversal. My favorite part that sets this apart from others is, if using the bClose option (which I recommend you do) the trend will not reverse until there is a close above/below the previous channel high/low. i.e. a reversal into an uptrend requires the current bar to close above the previous upper channel rather than just a new high.
The coloring of the current trend allows for a quick read of current market conditions and I use this on any timeframe across all forms of charts (forex stock, futures, crypto, etc). When taking one of the signals I use the opposite channel as the stop loss (when buying use bottom, and selling use top channel)

SST Table NewData Table for Update GTT Orders in Stocks....
Updated GTT Order details for SST , also added Relative Strength of Stock compared with NIFTY Index for 55 Days (3 Months) period.
RS line plotted on chart… taken reference of close price of day candle… just a bigger picture of actual RS indicator plotted on chart itself... RS line in red color means below zero line (negative) and green color means above zero line (positive).
Added code for checking RS value on chart for any previous day.

Jurik Filtered, Composite Fractal Behavior (CFB) Channels [Loxx]Double Jurik-Filtered Composite Fractal Behavior (CFB) Channels is a channel indicator that acts as both a baseline, similar to Donchian, and as support and resistance levels. This indicator is price time adaptive meaning it flexes to price volatility waves. The indicators adaptive nature is calculated using the Composite Fractal Behavior (CFB) algorithm. The result of this adaptive calculation is then smoothed using Jurik Filtering, and then it's normalized to conform to a range of values. This helps better identify trends.
What is Composite Fractal Behavior (CFB)?
All around you mechanisms adjust themselves to their environment. From simple thermostats that react to air temperature to computer chips in modern cars that respond to changes in engine temperature, r.p.m.'s, torque, and throttle position. It was only a matter of time before fast desktop computers applied the mathematics of self-adjustment to systems that trade the financial markets.
Unlike basic systems with fixed formulas, an adaptive system adjusts its own equations. For example, start with a basic channel breakout system that uses the highest closing price of the last N bars as a threshold for detecting breakouts on the up side. An adaptive and improved version of this system would adjust N according to market conditions, such as momentum, price volatility or acceleration.
Since many systems are based directly or indirectly on cycles, another useful measure of market condition is the periodic length of a price chart's dominant cycle, (DC), that cycle with the greatest influence on price action.
The utility of this new DC measure was noted by author Murray Ruggiero in the January '96 issue of Futures Magazine. In it. Mr. Ruggiero used it to adaptive adjust the value of N in a channel breakout system. He then simulated trading 15 years of D-Mark futures in order to compare its performance to a similar system that had a fixed optimal value of N. The adaptive version produced 20% more profit!
This DC index utilized the popular MESA algorithm (a formulation by John Ehlers adapted from Burg's maximum entropy algorithm, MEM). Unfortunately, the DC approach is problematic when the market has no real dominant cycle momentum, because the mathematics will produce a value whether or not one actually exists! Therefore, we developed a proprietary indicator that does not presuppose the presence of market cycles. It's called CFB (Composite Fractal Behavior) and it works well whether or not the market is cyclic.
CFB examines price action for a particular fractal pattern, categorizes them by size, and then outputs a composite fractal size index. This index is smooth, timely and accurate
Essentially, CFB reveals the length of the market's trending action time frame. Long trending activity produces a large CFB index and short choppy action produces a small index value. Investors have found many applications for CFB which involve scaling other existing technical indicators adaptively, on a bar-to-bar basis.
What is Jurik Volty used in the Juirk Filter?
One of the lesser known qualities of Juirk smoothing is that the Jurik smoothing process is adaptive. "Jurik Volty" (a sort of market volatility ) is what makes Jurik smoothing adaptive. The Jurik Volty calculation can be used as both a standalone indicator and to smooth other indicators that you wish to make adaptive.
What is the Jurik Moving Average?
Have you noticed how moving averages add some lag (delay) to your signals? ... especially when price gaps up or down in a big move, and you are waiting for your moving average to catch up? Wait no more! JMA eliminates this problem forever and gives you the best of both worlds: low lag and smooth lines.
Ideally, you would like a filtered signal to be both smooth and lag-free. Lag causes delays in your trades, and increasing lag in your indicators typically result in lower profits. In other words, late comers get what's left on the table after the feast has already begun.
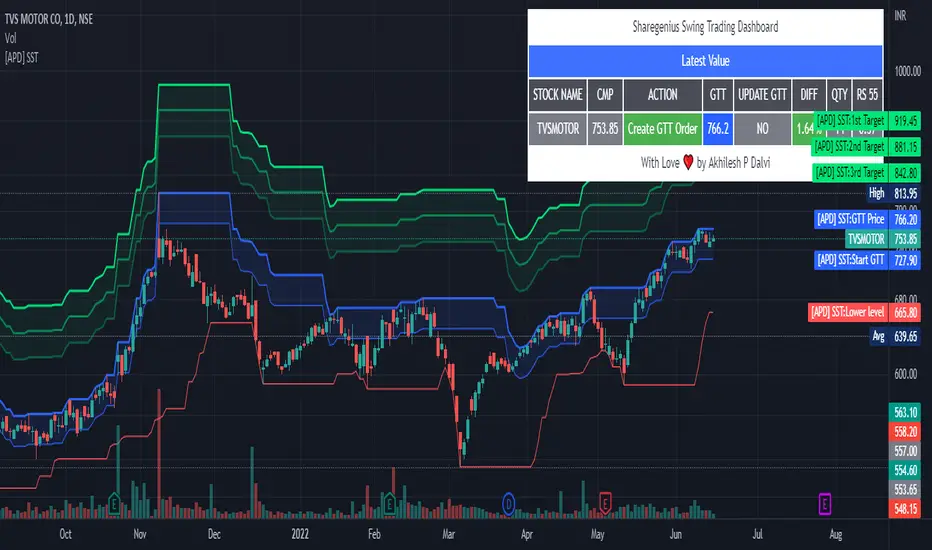
[APD] Sharegenius Swing Trading StrategyThis script plots GTT Price , Target Prices , Buy Zone , Target Zone and Information Dashboard according to Sharegenius Swing Trading Strategy. SST is for Swing Trading.
👉🏻 Strategy by Mahesh Kaushik -
1️⃣ Track the 20-Day Low of the instrument.
2️⃣ Create a GTT order which is 5% above 20 DL.
3️⃣ If the share makes a new 20 DL before getting purchased, then update your GTT order to be 5% above the new 20 DL.
4️⃣ Next GTT will be started when the average price falls by 10%. (GTT will be created as 5% above the last 20 DL or Buy on 10%, 20%, 30% fall in average price.)
5️⃣ Sell target is 5% of the average price. Sell all units or Set sell target on buy price.
6️⃣ No stop loss is needed as we buy when the stock falls.
👉🏻 Note:-
Trade in fundamentally good stocks & strong stocks those are outperforming index because we do not take stop loss in this strategy.
DISCLAIMER:- This Script is for educational purposes only. Nothing in this content should be interpreted as financial advice or a recommendation to buy or sell any sort of security or investment.
donchian diff [LM]Hello traders,
I would like to present you Donchian diff script. The idea behind this script is that as in Ichimoku I consider base line as equilibrium so I calculate percentages between base line and current price and calculate percentage between base line and conversion line and use them as a filter. For signals I used also that candle has to be highest or lowest in x(configurable) consecutive candles.
It has following setting:
Base line setting
Conversion line setting
buy/sell signal setting - here you can setup buy/sell condition
filter setting - here you can set up percentages of the distances
Hope you will enjoy it,
L
