Oster's Fair Index (OFI)Note : Excitingly, this indicator is optimized to work exclusively with weekly candles (1W) ! Because fundamental analyses, with their longer-term outlook, thrive on the broader perspective provided by weekly data.
Overview:
Oster's Fair Index (OFI) stands out as a sophisticated indicator to offer traders a comprehensive assessment of a stock's fundamental valuation. Unlike many conventional indicators that focus solely on technical analysis, OFI places a strong emphasis on fundamental metrics, providing traders with a deeper understanding of a stock's intrinsic worth. It applies Oster's method (explained below) to determine the fundamental fair price of a stock.
Innovative Approach to Fundamental Analysis:
OFI employs a unique approach to fundamental analysis, integrating multiple key metrics including Yield , P/S (Price-to-Sales) ratio , P/E (Price-to-Earnings) ratio , Debt/Asset ratio , and P/FCF (Price-to-Free-Cash-Flow) ratio . These metrics collectively offer a holistic view of a company's financial health, allowing traders to gauge its potential for growth and profitability. Notably, the fundamental metrics included in OFI are regarded as the most crucial indicators for fundamental stock evaluation according to Oster's method. Dividend yield and P/S ratio are prioritized as the most significant, followed by the P/E ratio, with supplementary consideration given to the debt-to-asset ratio and price-to-free cash flow ratio. This weighting reflects their importance in determining a stock's fair value according to the methodology, which is integrated into OFI's calculation process.
Customizable Parameters for Tailored Analysis:
One of OFI's standout features is its flexibility, allowing users to customize the fundamental parameters based on their specific investment strategy or preferences. Traders can selectively include or exclude metrics , adjust weighting factors , and set alarm thresholds to align with their unique trading objectives. This customization empowers traders to tailor OFI according to their individual preferences and market perspectives. Although a default value has been set for the weighting of the parameters, traders still have the option to customize it based on their own trading strategy and preference, ensuring that OFI remains adaptable to diverse trading styles and objectives.
Sophisticated Calculation Methodology:
Behind the scenes, OFI employs a sophisticated calculation methodology to derive its insights. It retrieves fundamental data for the selected stock, such as total revenue, earnings per share, debt-to-asset ratio, free cash flow per share, and dividend yield. However, these metrics are not viewed in isolation; rather, they are considered in relation to historical trends . For instance, while a low debt-to-asset ratio may indicate fundamental strength for a company, it must be interpreted in the context of its historical performance. If the debt-to-asset ratio has historically been consistently lower, it may suggest weaker performance despite the seemingly favorable current ratio. Furthermore, OFI goes beyond mere fundamental metrics by incorporating the stock price itself into its analysis . A low debt-to-asset ratio becomes even more attractive for the company if the stock price is also historically low, indicating undervaluation. OFI takes all these aspects into account, providing traders with a comprehensive and nuanced evaluation of a stock's fundamental attractiveness, considering all these aspects in relation to each of the fundamental metrics mentioned above.
Normalized Fairness Differentials for Standardized Comparison:
OFI employs a method where the aforementioned fundamental metrics interact as described earlier. These metrics are combined into a fundamental, normalized value using weighting factors. This value is then normalized by the moving price range of the last 12 months. The result provides insights not only into when the stock price was undervalued, overvalued, or fair, but also enables traders to estimate potential price movements based on the fundamental health of the company. Additionally, a dashed fair price line simply represents the sum of the current stock price and the OFI value. This line illustrates the fair price level of the stock derived from the methodology.
Interpretation:
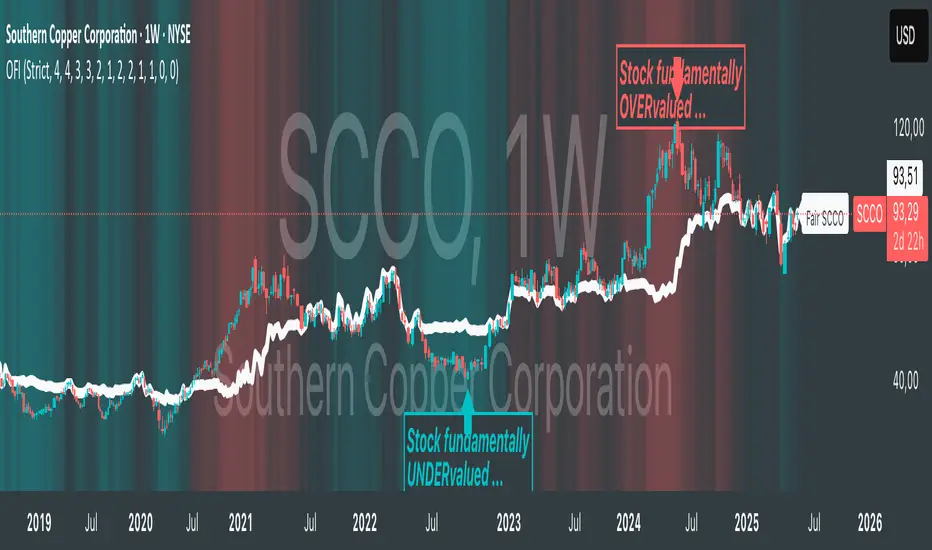
A negative OFI indicates that the stock may be undervalued based on fundamental metrics. Conversely, a positive OFI suggests that the stock may be overvalued according to fundamental analysis. A zero OFI implies that the stock is trading at a fair price relative to its fundamentals, indicating a balanced valuation scenario. The values of OFI are not arbitrary; they represent the degree of overvaluation or undervaluation in the currency set in the chart settings. This means traders can discern, for example, how many USD the stock is undervalued or overvalued by . Additionally, a dashed fair price line simply represents the sum of the current stock price and the OFI value, illustrating the fair price levels of the stock derived from the methodology.
Dynamic Color Coding for Visual Clarity:
To enhance usability, OFI features dynamic color coding that visually highlights the fair price differentials. Green signifies potential undervaluation , red indicates potential overvaluation , and neutral colors represent fair valuation . This intuitive visual feedback enables traders to quickly identify opportunities and risks.
Alerts:
OFI generates alerts based on these interpretations to assist traders in making informed decisions. An Undervalued Signal (BUY) is triggered when the OFI is below zero and meets the buy threshold criteria. This indicates that the stock is fundamentally undervalued, prompting a BUY alert. Conversely, an Overvalued Signal (SELL) is generated when the OFI surpasses zero and meets the sell threshold criteria. This signals that the stock is fundamentally overvalued, prompting a SELL alert. When OFI hovers around zero, suggesting that the stock is trading at a fair price, a Fair Price Reached (FAIR) alert is generated. This encourages traders to consider profit-taking strategies given the balanced valuation.
Justification of Originality and Value:
In a landscape saturated with technical indicators, OFI distinguishes itself by offering traders a refreshingly simple yet powerful approach to fundamental analysis. While traditional methods often involve laborious scrutiny of financial metrics or even poring over entire company balance sheets, OFI streamlines this process, providing traders with a swift overview of a stock's fundamental health. Its strength lies in seamlessly integrating fundamental analysis with stock price movements, offering insights into how price correlates with fundamental metrics.
One could say we marry the simplicity of technical analysis with the depth of fundamental analysis. This unique combination empowers traders to make informed decisions with ease, leveraging the best of both worlds to navigate the markets effectively.
Conclusion:
In conclusion, Oster's Fair Index (OFI) represents a pioneering advancement in the realm of fundamental analysis, offering both sophisticated calculation methodologies and intuitive, user-friendly features. By marrying these elements with customizable parameters and intuitive visuals, OFI equips traders with a powerful tool for evaluating the fundamental valuation of stocks. Whether you're a seasoned investor or a novice trader, OFI offers invaluable insights that can inform and enrich your trading journey.
Earning
Financial IndicesThis indicator provides simple table at the top of the screen that shows the most important financial indices
1. Dividend Yield (DY), Fiscal quarter.
2. Earning per Share Growth (EG), Fiscal quarter.
3. Price-to=Book (PB) Ratio, Fiscal quarter.
4. Price-to-Earning (PE) Ratio, Twelve trailing Months.
Debt-to-Equity (D/E) Ratio, Fiscal quarter.
You can configure your preferences regarding the minimum and maximum acceptable values. Also, you can configure the table color of positive values or negative values

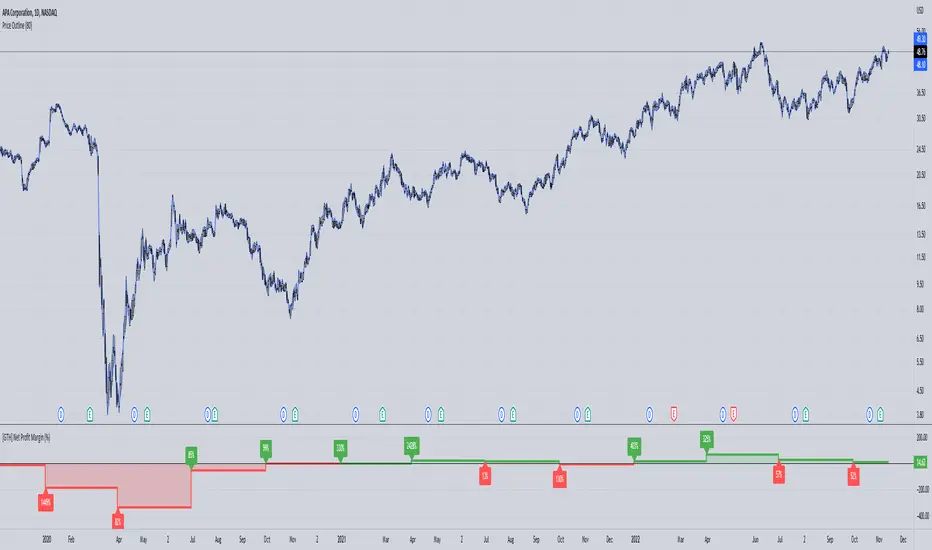
[GTH] Net Profit Margin (%)Displays the Net Profit Margin in a more "readable" fashion than the built-in TV Indicator.
This indicator concludes the series of 'Minervini-indicators', consisting of "GTH Earnings", "GTH Revenues" and "GTH Net Profit Margin (%)".
Famous trader Mark Minervini repeately describes rising earnings, revenues and net profit margin as the most important financials for finding superperformers.
In case of reporting a malfunction: Please be specific. Statements like "does not work" are useless. Thanks.
EPS & SalesHi everyone,
I just adapted a little utility script to visualise EPS % increase (quarters vs Year -1) and sales.
I used the code from @ARUN_SAXENA and modified it to fix what I saw as issues.
(Using base 3M instead of 1M +
request.earnings(syminfo.tickerid, earnings.actual, ignore_invalid_symbol=true)
instead of
request.financial(syminfo.tickerid, "EARNINGS_PER_SHARE", "FQ")
Data will differ from MarketSmith because they use sometimes actual EPS sometimes standard, but think we can at least trust what we see in term of %
The tool is far from being perfect !


Earnings DashboardThe Earnings Dashboard Indicator is a fast way to check the most recent quarterly earnings growth on TradingView.
Colors
The colors should help you get an easy overview of the quarters that are particularly outstanding.
- Earnings /Sales Growth & Surprise >= 20% -> Green
- Earnings /Sales Growth & Surprise <= -20% -> Red
- Net Margin < 5% -> Red
- Net Margin >15% -> Green
Indicator Configuration
- Not available at the moment. Feel free to leave us a comment on TradingView with your idea and we will see what we can do.
Planned Future Update
- Extension with annual (FY) financial data
Happy Trading 📈😎
Important : All data is retrieved using the variables provided by TradingView.

EARNING FANDA TRADING SIGNALThis Indicator will give buy and sell signal based on modified trend analysis.
This Indicator is Modified and Better Version of trading signal, which will give you less but better signals
Buy and Sell only on bar / candle close.

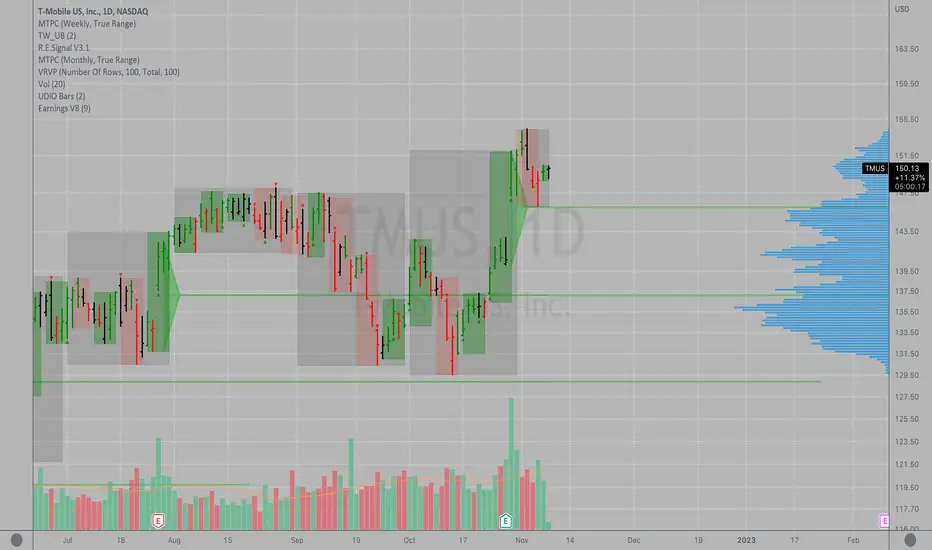
Key Earnings Level by Tim WestKEY EARNINGS LEVELS:
1. It is a composite price of an equity with a quarterly earnings report. The price line attempts to indicate the most important price for the release of earnings of that company. Only companies that have quarterly earnings will be able to have Key Earnings Levels. Indexes, commodities or other futures and crypto markets will not have these lines available.
After the earnings release (aka "ER"), the stock will tend to be supported by the price of the Key Earnings Level (KEL). If the stock is NOT supported at the KEL, then you can assume the stock is under distribution and one could further assume the earnings report was not accepted well by the market and the stock will likely continue to be sold in the future until the KEL no longer stops the advance of the stock.
2. The Earnings Level is designed to be plotted on the DAILY time frame only, and not the weekly or monthly time frames. It is also not designed for the hourly or any time other than daily.
3. Earnings Levels seem to be useful for a long period of time, perhaps up to a year or more based on the observations that I have done since 2012-2014 when I created the concept. I designed the software to allow you to advance the line forward in time by periods of 3 months, 6 months, 9 months and 12 months. The levels could last longer and you could add a "horizontal ray" at each earnings level so that it extends indefinitely into the future.
4. There are many additional uses of KEL's that include a combined KEL for an index, such as the DJIA, SP500 or any other basket of stocks if you combine all of the stocks KEL's together to form a market support/resistance level. I have published this research here at TradingView under the $DJI DJIA symbol.
5. The concept behind this EARNINGS RELEASE is to also see HOW VOLATILE a stock is on the day before, day of and day after the EARNINGS are released as a gauge of uncertainty in the stock. The larger the range of the stock price on an EARNINGS report, the more varied the opinions are of investors and the more uncertain analysts are on the valuation of the company or its future outlook. Volatility is an important concept for risk management in a stock and understanding how volatile a stock is on the 4 most important days of the year for any stock will help any investor understand more deeply about the risk of the stock itself.
6. I comment on stocks using the earnings levels concepts in chat room Key Hidden Levels here at TradingView for many years now. I am eager to hear your comments and success with this tool and others and hope you can pass it along to others to help them be informed too.