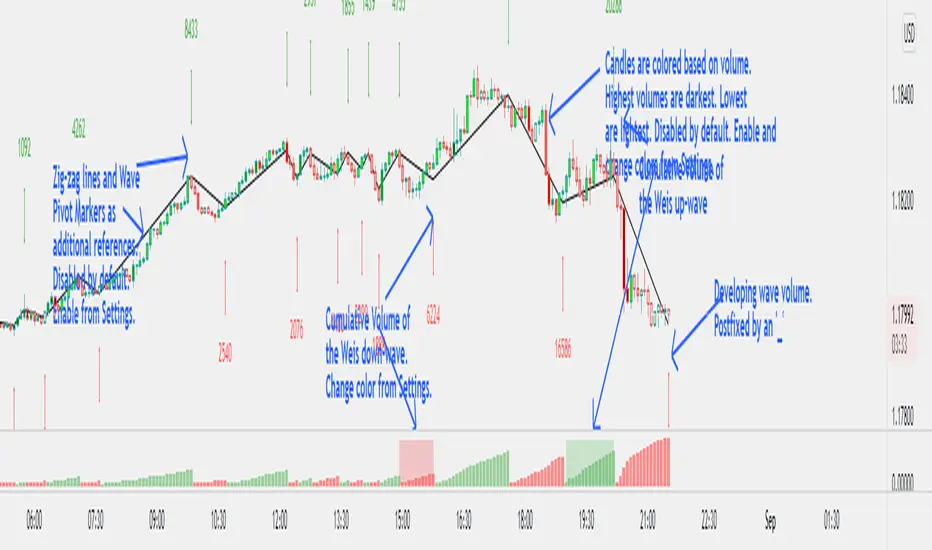
Weis Wave Volume NumbersWhat is it?
This is an indicator to complement @modhelius' Weis Wave Volume Indicator.
Original code has been modified to display wave volume (cumulative) numbers above or below the latest candle of the corresponding wave on the main pane. Since we are concerned only with relative volume, VOLUME NUMBERS HAVE BEEN SCALED DOWN. (If you need actual volume numbers, uncheck "Scale Down Volume" option in Settings). Rising wave volume is denoted in green. Falling wave volume is denoted in red. Developing wave volume is postfixed with a '_'. Confirmed wave volumes won't have this.
Who is it for?
This indicator is useful if you already use Weis Waves in your analysis and could do with an additional numerical representation of the wave volume on the main pane. Can be used in conjunciton with @modhelius' Weis Wave Volume (WWV) indicator (need to be added separately) to complement the visual representation of the waves. Can be used independently as well.
Pelase note that if you use any other Weis Wave indicator (other than @modhelius'), the numbers and the waveforms might not match.
Onda di Elliott
Elliot Wave - ImpulseLets dabble a bit into Elliot Waves.
This is a simple script which tries to identify Wave 1 and 2 of Elliot Impulese Wave and then projects for Wave 3.
Ratios are taken from below link: elliottwave-forecast.com - Section 3.1 Impulse
Wave 2 is 50%, 61.8%, 76.4%, or 85.4% of wave 1 - used for identifying the pattern.
Wave 3 is 161.8%, 200%, 261.8%, or 323.6% of wave 1-2 - used for setting the targets
Important input parameters
Length : Zigzag Length. Keep the numbers low if you are looking for smaller and shorter trades. Keep the numbers high if you are looking for longer and bigger trades.
Error Percent : Adjustments for ratios as it is not always possible to find exactly equal retracement ratio.
Entry Percent : Once Wave 2 is formed, entry is set after reversing 30% of wave 2. This number can be increased or decreased. Caution: Keeping the number too low may result in false signals.
Ignore Trend Direction : If unchecked, it will only look for pattern if Wave 1 has made a higher high. If not, it will ignore Wave 1 condition and only look at wave 1 to 2 ratio.
Handle Duplicates : Since, the labels are generated upon crossover of entry price, this crossover may happen multiple times. Or sometimes wave 2 can further extend and generate new signal with same wave 1. This parameter says how to handle such cases. Keep Last is set to default and is most preferred option.
ShowRatios and ShowWaves lets you display wave line and retracement ratios for each pivots
TradeChartist Catalyst™TradeChartist Catalyst is an elegant script that combines Catalyst Trade Bands and automatic ZigZag/Fibonacci plots using an original logic to help users interact in a visually engaging and meaningful way with the charts.
===================================================================================================================
™TradeChartist Catalyst features
=============================
1. Catalyst Trade Bands
Catalyst Trade Bands comprises Equilibrium or Mean Bands, Inner Bands, Outer Bands and a Overall Mean Line. Catalyst Trade Bands help visualize the price action in relation to the Equilibrium Bands and clearly show how far away from the mean the current price is. The Trade Bands are of two types - Normal and Weighted. Weighted Bands are very sensitive to price action and a higher Bands length is recommended.
Simple 144 vs Weighted 144 Trade Bands
2. Equilibrium Touch Points
Every time the price touches the Equilibrium, an orange touch point appears on the chart. Normally, the Equilibrium line, for an optimal sample, acts as support or resistance. Price breaching or failing this line usually signals a Pull Back, a Throw Back or a Trend Change based on how the price interacts with it. This can be used with a secondary confirmation like RSI, Stochastic etc. For example, if the price falls back significantly only to touch the Equilibrium Line and fails to test the Overall Mean Line when Stochastic is below 30, this could mean a strong Pull Back rather than a Trend Change as shown in the example chart below.
When price fails the Equilibrium Bands, the fill colour of the Equilibrium bands changes to Bearish colour. If the Overall Mean line is below the Equilibrium bands and is in a reasonable distance, Mean will act as support as shown in the example below. Price failing the mean will test Inner Bands and strong bear momentum could take price to Outer Bands and beyond.
All the components of the Catalyst Trade Bands including the Touch Points can be enabled or disabled from the settings.
3. ZigZag & Fibonacci
Catalyst automatically plots ZigZag and Auto Fibonacci Retracement based on an intelligent logic and can be tweaked by changing the Zigzag & Auto-Fibs Factor from the settings. It also plots Fib ratios and connectors along with price highs and lows of ZigZag. The ratios can be especially useful to visually detect harmonic patterns and also serves as a useful feature for Fibonacci traders.
4. Fibonacci Customisation
Catalyst users can customise Fibonacci type and levels, including levels colour from Catalyst settings. In addition to Auto-Fibs, users can also plot Fibonacci levels based on Days or Candles lookback. This is a very useful feature if the user wants to override Auto-Fibs to suit his/her needs. Users can also reverse the Fibonacci Levels by enabling Reverse from settings.
In the following example chart of OANDA:USDCAD , Fibonacci levels based on 10 days lookback is plotted.
===================================================================================================================
Best Practice: Test with different settings first using Paper Trades before trading with real money
===================================================================================================================
Linear Regression & RSI Multi-Function Screener with Table-LabelHi fellow traders..
Happy to share a Linear Regression & RSI Multi-Function Custom Screener with Table-Labels...
The Screener scans for Linear Regression 2-SD Breakouts and RSI OB/OS levels for the coded tickers and gives Summary alerts
Uses Tables (dynamica resizing) for the scanner output instead of standard labels!
This Screener cum indicator collection has two distinct objectives..
1. Attempt re-entry into trending trades.
2. Attempt Counter trend trades using linear regression , RSI and Zigzag.
Briefly about the Screener functions..
a. It uses TABLES as Labels a FIRST for any Screener on TV.
b. Tables dynamically resize based on criteria..
c. Alerts for breakouts of the UPPER and the LOWER regression channels.(2 SD)
d. In addition to LinReg it also Screens RSI for OB/OS levels so a multifunction Screener.
e. Of course has the standard summary Alerts and programmable format for Custom functions.
f. Uses only the inbuilt Auto Fib and Lin Reg code for the screener.(No proprietary stuff)
g. The auto Zigzag code is derived(Auto fib).
Question what are all these doing in a single screener ??
ZigZag is very useful in determining Trend Up or Down from one Pivot to another.
So Once you have a firm view of the Current Trend for your chosen timeframe and ticker…
We can consider few possible trading scenarios..
a. Re-entry in an Up Trend - Combination of OS Rsi And a Lower Channel breach followed by a re-entry back into the regression channel CAN be used as an effective re-entry.
b. Similarily one can join a Down Trend on OB Rsi and Upper Channel line breach followed by re-entry into the regression channel.
If ZigZag signals a range-bound market, bound within channel lines then the Upper breakout can be used to Sell and vice-versa!
In short many possibilities for using these functions together with Scanner and Alerts.
This facilitates timely PROFITABLE Trending and Counter trend opportunities across multiple tickers.
You must give a thorough READ to the various available tutorials on ZigZag / Regression and Fib retracements before attempting counter trend trades using these tools!!
A small TIP – Markets are sideways or consolidating 70% of the time!!
Acknowledgements: - Thanks a lot DGTRD for the Auto ZigZag code and also for the eagerness to help wherever possible..Respect!!
Disclaimer: The Alerts and Screener are just few tools among many and not any kind of Buy/Sell recommendations. Unless you have sufficient trading experience please consult a Financial advisor before investing real money.
*The alerts are set for crossovers however for viewing tickers trading above or below the channel use code in line 343 and 344 after setting up the Alerts!
** RSI alerts are disabled by default to avoid clutter, but if needed one can activate code lines 441,442,444 and 445
Wish you all, Happy Profitable Trading!

Auto Fib Time Zones and Trend-Based Fib Time by DGTFibonacci time zones, based on the Fibonacci number sequence, are vertical lines that represent potential areas where a swing high, low, or reversal could occur.
Trend-Based Fib Time shows probable price corrections in an existing trend. A useful tool to use in addition to Elliot Wave counting, Fib Time helps to identify how far the wave is likely to travel
Please note, Time zones aren't concerned with price, only time
Disclaimer :
Trading success is all about following your trading strategy and the indicators should fit within your trading strategy, and not to be traded upon solely
The script is for informational and educational purposes only. Use of the script does not constitute professional and/or financial advice. You alone have the sole responsibility of evaluating the script output and risks associated with the use of the script. In exchange for using the script, you agree not to hold dgtrd TradingView user liable for any possible claim for damages arising from any decision you make based on use of the script

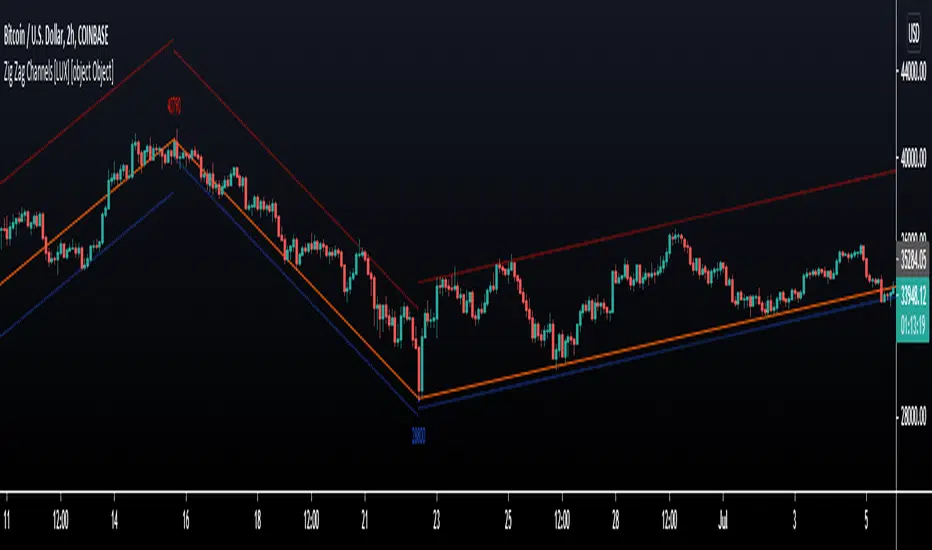
Zig Zag Channels [LuxAlgo]The Zig Zag indicator is a useful indicator when it comes to visualizing past underlying trends in the price and can make the process of using drawing tools easier. The indicator consists of a series of lines connecting points where the price deviates more than a specific percentage from a maximum/minimum point ultimately connecting local peaks and troughs.
This indicator by its very nature backpaints by default, meaning that the displayed components are offset in the past.
🔶 USAGE
The Zig Zag indicator is commonly used to returns points of references for the usage of specific drawing tools, such as Fibonacci retracements, fans, squares...etc.
The proposed indicator estimates peaks and troughs by using rolling maximums/minimums with a window size determining their significance. This window size approach allows us to have an indicator that works with a certain regularity no matter the scale of the price, something the percentage-based approach struggles with. Additionally, one upper and lower extremity are displayed, highlighting the price point that deviates the most from the Zig Zag lines.
A common usage also includes the easy determination of Elliot wave patterns in the price.
The Zig Zag indicator above highlights a downtrending motive wave.
🔹 Extremities
The novel approach taken by this Zig Zag indicator is the addition of two extremities derived from the distance between the price and the Zig Zag line, thus returning channels. It is uncommon seeing extremities in Zig Zag indicators since the line connecting peaks and troughs has rarely any other utility than seeing trend variations with more clarity and is not meant to provide an accurate estimate of underlying local trends in the price.
This channel can be useful to study the potential relationship between underlying trends and the Zig Zag line. A low width between the Zig Zag and the upper extremity indicates price variations mostly located below the Zig Zag while equal width indicates more linear trends.
When the indicator is extended to the last line, the extremities provide potential support and resistances, thus making this indicator able to forecast price variations.
🔶 SETTINGS
Length: Determines the significance of the detected peaks and troughs.
Extend To Last Bar: Extend the most recent line to the most recent closing price value.
Show Extremities: Displays the extremities.
Show Labels: Display labels highlighting the high/low prices located at peaks and troughs.
🔹 Style
Upper Extremity Color: Color of the upper extremity displayed by the indicator.
Zig Zag Color: Color of the ZigZag lines.
Lower Extremity Color: Color of the lower extremity displayed by the indicator.
ZigZag (Using Line Array)This is standard zigzag indicator. I just coded them using lines array feature of pine - so that it can be done in least number of lines of code.
Few possible improvements:
Use label array to mark HH, HL, LH and LL
Add standard deviation check

Detrended Rhythm Oscillator (DRO)How to detect the current "market beat" or market cycle?
A common way to capture the current dominant cycle length is to detrend the price and look for common rhythms in the detrended series. A common approach is to use a Detrended Price Oscillator (DPO). This is done in order to identify and isolate short-term cycles.
A basic DPO description can be found here:
www.tradingview.com
Improvements to the standard DPO
The main purpose of the standard DPO is to analyze historical data in order to observe cycle's in a market's movement. DPO can give the technical analyst a better sense of a cycle's typical high/low range as well as its duration. However, you need to manually try to "see" tops and bottoms on the detrended price and measure manually the distance from low-low or high-high in order to derive a possible cycle length.
Therefore, I added the following improvements:
1) Using a DPO to detrend the price
2) Indicate the turns of the detrended price with a ZigZag lines to better see the tops/bottoms
3) Detrend the ZigZag to remove price amplitude between turns to even better see the cyclic turns ("rhythm")
4) Measure the distance from last detrended zigzag pivot (high-high / low-low) and plot the distance in bars above/below the turn
Now, you can clearly see the rhythm of the dataset indicated by the Detrended Rhythm Oscillator including the exact length between the turns. This makes the procedure to "spot" turns and "measure" distance more simple for the trader.
How to use this information
The purpose is to check if there is a common rhythm or beat in the underlying dataset. To check that, look for recurring pattern in the numbers. E.g. if you often see the same measured distance, you can conclude that there is a major dominant cycle in this market. Also watch for harmonic relations between the numbers. So in the example above you see the highlighted cluster of detected length of around 40,80 and 120. There three numbers all have a harmonic relation to 40.
Once you have this cyclic information, you can use this number to optimize or tune technical indicators based on the current dominant cycle length. E.g. set the length parameter of a technical indicator to the detected harmonic length with the DRO indicator.
Example Use-Case
You can use this information to set the input for the following free public open-source script:
Disclaimer
This is not meant to be a technical indicator on its own and the derived cyclic length should not be used to forecast the next turn per se. The indicator should give you an indication of the current market beat or dominant beats which can be use to further optimize other oscillator or trading related settings.
Options & settings
The indicator allows to plot different versions. It allows to plot the original DPO, the DRO with ZigZag lines, the DRO with detrended ZigZag lines and length labels on/off. You can turn on or off these version in the indicator settings. So you can tweak it visually to your own needs.

Zig Lines with Percent & ValueOverview, Features, and Usage:
The Zig Lines with Percent & Value is an indicator that highlights the highest and lowest points of the market from pivot points and zigzag lines based on the ZigZag Period setting. By a default value of 13 for the ZigZag Period this works well on Bitcoin or other alt coins on the 1 hour or higher timeframe charts.
What makes this indicator unique is that it draws a green line to signify an uptrend or a red line to signify a down trend. It will also show the percent difference between the previous point/line, for example: If you see a -negative percentage point with a red line drawn to it, then you are looking at a low pivot point and then as the green line is drawn to a +positive percentage value the percentage you see is the difference between the two points. This is great to see a trend reversal as you can look at previous pivot points and notice about how far the price moves before it changes direction (trend reversal).
There is an invisible EMA line that is used to assist with coloring the negative vs positive values. The value above or below the percentage is the lowest or highest price at that pivot point . The display of the price at the pivot point depends on your ZigZag Period setting and the timeframe of your chart.
Added Bollinger Bands as it fits perfectly with the visuals of the Zig Lines & Pivots.
Usage of Bollinger Bands:
~As the price or candle gets close to the top or bottom of the Bollinger band it can give you a better confirmation that the pivot location is at it's final place, and the trend is more likely to switch directions.
It’s important to know this indicator should not be used for alerts of any type it does repaint as the green or red line is drawing based on live chart data and it can change depending on the direction of the market. This is a great visual tool for trend analysis or to be used with other indicators as a confirmation for a possible good entry or exit position.
Credits ( and consent to use ):
Credits go to user LonesomeTheBlue for creation of this 'Double Zig Zag with HHLL' script.
The addition of the Value above/below the Percentages is from user Noldo and that script is found here:
The Bollinger Bands setup was suggested by user countseven12 and his script that uses the same BB setup is found here:
References:
1. Chen, James. (2021 March 15). Zig Zag Indicator . Received from http: www.investopedia.com
2. Mitchell, Cory. (2021 April 30). Pivot Points . Received from http: www.investopedia.com

Pivot Detective Indicator v1.0Overview of Features
The Pivot Detective is an indicator that simply highlights the waves of the market by identifying the pivot highs and pivot lows by using shapes and zigzag lines.
What makes this indicator unique is that you do not have to specify the number of bars to the left or right side of the pivots (aka pivot strength), nor do you need to specify percent deviation for filtering the zigzag (1)lines. Thus, the indicator will monitor price action and keep track of pivot high and low prices and implements a common trend analysis algorithm to determine when the trend has reversed to confirm the pivot price and begin tracking the next pivot price. The tolerance of the trend reversal can be configured to be strict or loose depending on your preference.
Be aware that this indicator does not determine key levels of price like support (S1, S2, etc.) and resistance (R1, R2, etc.) levels that are found in the traditional Pivot Points indicators (2).
Usage Information
The indicator can be applied to any chart at any time frame. It is very customizable where you can add or change various chart elements to help you enhance your interpretation of the price action trend reversals at the pivots. You can specify the pivot shapes, colors, and visibility as well as zigzag line thickness, color, and visibility. You can adorn the pivot shapes with any combination of price, rate of change percentage, and pivot trend using HH/LH/LL/HL text as well as control the coloring schemes for the in-progress pivot. The size of the text can also be customized.
Be aware that this indicator makes use of lines and labels which are limited to 500 lines and 500 labels, so if traverse far into the history, they will not appear because they have reached these limits and were removed by the chart's rendering engine.
Lastly, you can define "any alert() function call" messages on the "New Pivot High Point" and "New Point Low Point" events. These alerts provide custom placeholders that can be used in the messages, which are: {{exchange}}, {{ticker}}, {{currency}}, {{new_pivot_point_price}}, and {{new_pivot_point_roc}}
References
1. Chen, James. (2021 March 15). Zig Zag Indicator. Received from http: www.investopedia.com
2. Mitchell, Cory. (2021 April 30). Pivot Points. Received from http: www.investopedia.com

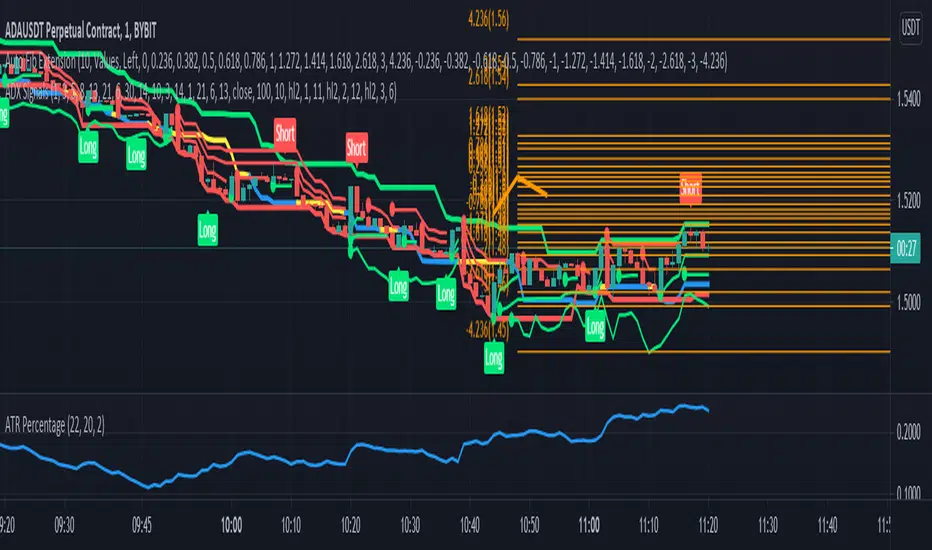
ADX SignalsThis script uses the Average Direction Index, On Balance Volume, and Exponential Moving Average, Moving Average Cross, MACD, Donchian Channels and two Parabolic SARs for stop loss, a normal one and a line one.
I tried to make the script as straightforward as possible, Buy when there is a buy signal and sell when there is a sell signal. I like using it on the smaller time-frames because I'm a scalper and I like going in and out quickly, but this indicator can be used on any timeframe and works on any instrument. The buy signal is triggered when the DI+ goes above the 30 level, the ADX is not increasing, on balance volume is at it's lowest, the price is above the lower Donchian Channel and last MACD hist bar is lower than the previous one. The sell signal is triggered when the DI- goes above the 30 level, the ADX is not increasing, on balance volume is at it's highest, the price is below the upper Donchian Channel and last MACD hist bar is upper than the previous one.
If you have any suggestions feel free to leave them in the comments below or Message me directly.
LTB Zigzag CirclesHello All,
Today I am here with a new idea and script, " LTB Zigzag Circles ". The idea is to create Circles using last 2 zigzag waves and to catch the breakouts earlier than horizontal lines. if a circle is broken then the script shows entry for Long/Short positions. and if broken circle reappears again then the position is closed. You can change Zigzag period as you wish and see the different results.
Here you can see how the script calculates and draws the Circles:
Below you can see how the script draws part of the circle on each bar:
Optionally the script can show levels:
P.S. I haven't tested it as a strategy, Result and Performance may change by Zigzag period, you need to find best Zigzag period according to your strategy. By the way, my Zigzag Circles idea can be improved, if you have any recommendation let me know please ;)
Enjoy!

Auto PitchFan, Fib Extension/Retracement and ZigZag by DGT Aᴜᴛᴏ PɪᴛᴄʜFᴀɴ, Fɪʙ Exᴛᴇɴꜱɪᴏɴ/Rᴇᴛʀᴀᴄᴇᴍᴇɴᴛ ᴀɴᴅ ZɪɢZᴀɢ
This study aim to automate PitchFan drawing tool and combines it with Fibonacci Extentions/Retracements and ZigZag.
Common setting options, applied to all components of the study
Deviation , is a multiplier that affects how much the price should deviate from the previous pivot in order for the bar to become a new pivot. Increasing its value is one way to get higher timeframe Levels
Depth , affects the minimum number of bars that will be taken into account when building
Historical PitchFan / Fibonacci Levels option will allow plotting of PitchFan / Fibonacci Levels on previous Pivot Highs/Lows
█ PɪᴛᴄʜFᴀɴ — is a set of rays spreading out of the point of a trend's beginning. These rays inclined with the coefficients formed by a Fibonacci number sequence. It is recommended to adjust the Pitchfan plottings to fit after the first wave of the trend has passed and the correction has clearly begun.
PitchFan rays corresponding to Fibonacci levels appear on a chart and represent inclined lines of support and resistance. Price areas near these rays are estimated areas from which the price can turn around or make a significant rebound. The whole logic of working with a pitchfan is based on one simple idea - if the price has bounced off the level, then the correction is likely to end, and the trend will continue. If the price has broken the first resistance, you should wait for the next level test
- Automatically plots PitchFan Rays, based on Pivot Lows/Highs.
- Ability to set ALERTs for each PitchFan Ray Level
- PitchFan Labels displays the price of the line at the last bar, the price value will be recalculated in each new bar
Please check the link provided below with the educational post of how to apply pitchfork, application of pitchfan is same keeping in mind the recommendation stated above
█ Fɪʙ Rᴇᴛʀᴀᴄᴇᴍᴇɴᴛs / Exᴛᴇɴꜱɪᴏɴꜱ
Fibonacci retracements is a popular instrument used by technical analysts to determine support and resistance areas. In technical analysis, this tool is created by taking two extreme points (usually a peak and a trough) on the chart and dividing the vertical distance by the key Fibonacci coefficients equal to 23.6%, 38.2%, 50%, 61.8%, and 100%.
Fibonacci extensions are a tool that traders can use to establish profit targets or estimate how far a price may travel AFTER a retracement/pullback is finished. Extension levels are also possible areas where the price may reverse.
IMPORTANT NOTE: Fibonacci extensions option may require to do further adjustment of the study parameters for proper usage. Extensions are aimed to be used when a trend is present and they aim to measure how far a price may travel AFTER a retracement/pullback. I will strongly suggest users of this study to check the education post for further details where to use extensions and where to use retracements
- Automatically plots possible Support and Resistance levels, based on Pivot Lows/Highs.
- Ability to set ALERTs for each Fibonacci Extension/Retracement Level
- Labels displays the level and the level price
█ Zɪɢ Zᴀɢ — The Zig Zag indicator is used to help identify price trends and changes in price trends. The Zig Zag indicator plots points on a chart whenever prices reverse by a percentage greater than a Deviation variable. Straight lines are then drawn, connecting these points. The Zig Zag indicator serves base for PitchFan and Fibonacci Retracements / Extensions
█ OTHER
PitchFan is often used in combination with the other indicators and/or drawing tools such as Fibonacci Retracement, Fibonacci Channels, Fibonacci Time Zone and others. It allows identify the most powerful areas from which price can turn and to get more accurate trading signal
Andrews’ Pitchfork, how to apply pitchfork and automated pitchfork study
Fibonacci Fans, how to apply fibonacci fans and automated fibonacci speed and resistance fans study
Fibonacci Extension / Retracement, where to use extensions and where to use retracements and automated fibonacci extension / retracement / pivot points study
Others
Fibonacci Channels, how to apply fibonacci channels and automated fibonacci channels study
Linear Regression Channels, , what linear regression channels are? and linear regression channel/curve/slope study
Disclaimer :
Trading success is all about following your trading strategy and the indicators should fit within your trading strategy, and not to be traded upon solely
The script is for informational and educational purposes only. Use of the script does not constitute professional and/or financial advice. You alone have the sole responsibility of evaluating the script output and risks associated with the use of the script. In exchange for using the script, you agree not to hold dgtrd TradingView user liable for any possible claim for damages arising from any decision you make based on use of the script

Fibonacci Extension / Retracement / Pivot Points by DGTFɪʙᴏɴᴀᴄᴄɪ Exᴛᴇɴᴛɪᴏɴ / Rᴇᴛʀᴀᴄᴍᴇɴᴛ / Pɪᴠᴏᴛ Pᴏɪɴᴛꜱ
This study combines various Fibonacci concepts into one, and some basic volume and volatility indications
█ Pɪᴠᴏᴛ Pᴏɪɴᴛꜱ — is a technical indicator that is used to determine the levels at which price may face support or resistance. The Pivot Points indicator consists of a pivot point (PP) level and several support (S) and resistance (R) levels. PP, resistance and support values are calculated in different ways, depending on the type of the indicator, this study implements Fibonacci Pivot Points
The indicator resolution is set by the input of the Pivot Points TF (Timeframe). If the Pivot Points TF is set to AUTO (the default value), then the increased resolution is determined by the following algorithm:
for intraday resolutions up to and including 5 min, 4HOURS (4H) is used
for intraday resolutions more than 5 min and up to and including 45 min, DAY (1D) is used
for intraday resolutions more than 45 min and up to and including 4 hour, WEEK (1W) is used
for daily resolutions MONTH is used (1M)
for weekly resolutions, 3-MONTH (3M) is used
for monthly resolutions, 12-MONTH (12M) is used
If the Pivot Points TF is set to User Defined, users may choose any higher timeframe of their preference
█ Fɪʙ Rᴇᴛʀᴀᴄᴇᴍᴇɴᴛ — Fibonacci retracements is a popular instrument used by technical analysts to determine support and resistance areas. In technical analysis, this tool is created by taking two extreme points (usually a peak and a trough) on the chart and dividing the vertical distance by the key Fibonacci coefficients equal to 23.6%, 38.2%, 50%, 61.8%, and 100%. This study implements an automated method of identifying the pivot lows/highs and automatically draws horizontal lines that are used to determine possible support and resistance levels
█ Fɪʙᴏɴᴀᴄᴄɪ Exᴛᴇɴꜱɪᴏɴꜱ — Fibonacci extensions are a tool that traders can use to establish profit targets or estimate how far a price may travel AFTER a retracement/pullback is finished. Extension levels are also possible areas where the price may reverse. This study implements an automated method of identifying the pivot lows/highs and automatically draws horizontal lines that are used to determine possible support and resistance levels.
IMPORTANT NOTE: Fibonacci extensions option may require to do further adjustment of the study parameters for proper usage. Extensions are aimed to be used when a trend is present and they aim to measure how far a price may travel AFTER a retracement/pullback. I will strongly suggest users of this study to check the education post for further details, where to use extensions and where to use retracements
Important input options for both Fibonacci Extensions and Retracements
Deviation, is a multiplier that affects how much the price should deviate from the previous pivot in order for the bar to become a new pivot. Increasing its value is one way to get higher timeframe Fib Retracement Levels
Depth, affects the minimum number of bars that will be taken into account when building
█ Volume / Volatility Add-Ons
High Volatile Bar Indication
Volume Spike Bar Indication
Volume Weighted Colored Bars
This study benefits from build-in auto fib retracement tv study and modifications applied to get extentions and also to fit this combo
Disclaimer:
Trading success is all about following your trading strategy and the indicators should fit within your trading strategy, and not to be traded upon solely
The script is for informational and educational purposes only. Use of the script does not constitute professional and/or financial advice. You alone have the sole responsibility of evaluating the script output and risks associated with the use of the script. In exchange for using the script, you agree not to hold dgtrd TradingView user liable for any possible claim for damages arising from any decision you make based on use of the script

chanlunGenerate a small line according to the pattern of the K-line, where green represents long and red represents short; (we call it pen)
then according to the small line segment, a large line(we call it line) is generated according to the new high or new low rule; (we call it line)
finally, a rectangle is generated according to the overlap interval of the large line.(we call it zhongshu)

Avatar trading indicatorIndicator description:
The Avatar indicator is to provide trading insights including trend and momentum, reversal points, Fibonacci retracement, and projections of future reversal or breakout levels.
Avatar is four indicators built into one.
Trend power: shows strength of trend and a change in momentum.
Red: The trend has been determined and is short
Lime: The trend has been determined and is long
Aqua: Continuation of the down trend, but showing down trend is in weakness.
Fuchsia: Continuation of the up trend, but showing up trend is in weakness
Yellow: Trend is reversing or trend is missing direction
Zig Zag: is used to help identify price trends. It plots points on a chart whenever prices reverse.
Major
The trend is graphed based on changes in price. The major trend should be used in deciding which way to enter the trade.
Minor
The minor trend is similar to the major but it is used to determine your entry point. It is easy to spot higher highs or lower lows. Take not when the minor trend fails to set a new high or a new low.
Channels : are price ranges that can provide useful trading information.
These dotted lines are provided as a quick guide to determine where the trend is headed. They show if price is getting squeezed and we should look for a break out using a flag or pennant pattern or is there an ever widening channel creating a broadening wedge . Look for hesitation or a reversal near the channel lines.
Fibonacci base on Zigzag
The Fibonacci retracement is created by taking two reverse points of major Zig Zag on a stock chart and dividing the vertical distance by the key Fibonacci ratios of 0%, 50%, and 100%.
Strategies for using the indicator
To be decided by traders. You are welcome to discuss trading strategies base on Avatar indicator, if your strategies are really good, we can write codes and do backtest on it.
Notes:
1) The code use 'valuewhen' feature which will cause repaint.
2) You can not use it to setup alerts.

Auto Fib Speed Resistance Fans by DGTFibonacci Speed and Resistance Fan is an analytical drawing tool used to indicate the support and resistance levels of an existing trend and the price level at which possible changes in the trend may occur.
A Fibonacci Speed Resistance Fan consists of a trend line drawn between two extreme points - a trough and opposing peak or a peak and opposing trough - on which a set of sequential speed resistance lines are drawn above (which represents time) and below (which represents price). These lines are drawn based on time/price percentages of the distance between the beginning and the end of the trend line.
Speed resistance lines not only help to measure trend corrections but also measure the speed of a trend (the rate at which a trendline ascends or descends)
Traders can use the lines of the Fibonacci Speed and Resistance Fan to predict key points of resistance or support, at which they might expect price trends to reverse. Once a trader identifies patterns within a chart, they can use those patterns to predict future price movements and future levels of support and resistance. Traders use the predictions to time their trades. Key support and resistance levels tend to occur frequently at the 61.8-percent level on both uptrends and downtrends.
Please check for further details in the education post that I will share shortly after this publication :
Nobody appears to know whether Fibonacci tools work because markets exhibit some form of natural pattern or because many investors use Fibonacci ratios to predict price movements, making them a self-fulfilling prophecy.
█ Study OPTIONS
Auto Fibonacci Speed and Resistance Fan , the main aim of the study
- Pivot threshold can be adjusted via “Deviation” and “Depth” input options
- Historical Fans option will allow plotting of Speed and Resistance Fans on previous pivot high/lows
- Ability to set ALERTs for the Speed and Resistance Levels
- Price Grid Lines if extended it will result with Fib Retracement levels
- All lines, line levels are customizable, default values are set exactly to the same with the available Fib Speed and Resistance Fan drawing tool
Zig Zag – Derived from build-in Auto Fib Retracement with some customization options.
Example Usages :
Disclaimer :
Trading success is all about following your trading strategy and the indicators should fit within your trading strategy, and not to be traded upon solely
The script is for informational and educational purposes only. Use of the script does not constitute professional and/or financial advice. You alone have the sole responsibility of evaluating the script output and risks associated with the use of the script. In exchange for using the script, you agree not to hold dgtrd TradingView user liable for any possible claim for damages arising from any decision you make based on use of the script
Auto Pitchfork, Fib Retracement and Zig Zag by DGTPitchfork is a technical indicator for a quick and easy way for traders to identify possible levels of support and resistance of an asset's price. It is presents and based on the idea that the market is geometric and cyclical in nature
Developed by Alan Andrews, so sometimes called Andrews’ Pitchfork
It is created by placing three points at the end of previous trends
Schiff and Modified Pitchfork is a technical analysis tool derived from Andrews' Pitchfork
In general, traders will purchase the asset when the price falls near the support of either the center trendline or the lowest trendline. Conversely, they'll sell the asset when it approaches the resistance of either the center line or the highest trendline.
█ Study OPTIONS
Auto Pitchfork , the main aim of the study
Pivots threshold can be customized by “Deviation” and “Depth” input options
Pitchfork Type selection, available options Andrews' Pitchfork (Original), Schiff and Modified Pitchfork
Ability to set ALERTs for the Pitchfork Levels
Ability to add customized levels (all level lines customizable)
Auto Fib Retracement – This is the build-in study of TradingView, slight changes applied to fit with Auto Pitchfork
Zig Zag – Derived from build-in Auto Fib Retracement with some customization options.
█ Usage Tips :
Andrews' Pitchfork (Original) best fit in a Strong Trending Market
Schiff and Modified Pitchfork better with Correcting or Sideways Market. Modified Pitchfork is almost identical to a Parallel Chanel
Disclaimer :
Trading success is all about following your trading strategy and the indicators should fit within your trading strategy, and not to be traded upon solely
The script is for informational and educational purposes only. Use of the script does not constitute professional and/or financial advice. You alone have the sole responsibility of evaluating the script output and risks associated with the use of the script. In exchange for using the script, you agree not to hold dgtrd TradingView user liable for any possible claim for damages arising from any decision you make based on use of the script

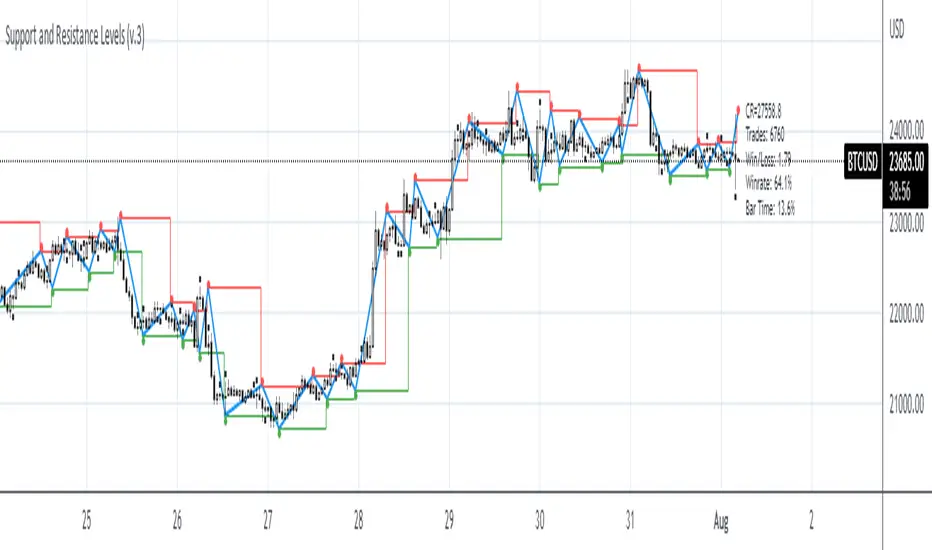
Support and Resistance Levels (v.3)Support and Resistance Levels augmanted and reprocessed
Description:
This is an augmented version of my earlier script that can be found here:
This time it features zigzag and channel lines, signal generation and filtering and performance testing. Signal generation and filtering procedures are used only for performance testing, not for the actual labelling. The labelling is governed by zigzag logic.
Donchian Zig-Zag [LuxAlgo]The following indicator returns a line bouncing of the extremities of a Donchian channel, with the aim of replicating a "zig-zag" indicator. The indicator can both be lagging or lagging depending on the settings user uses.
Various extended lines are displayed in order to see if the peaks and troughs made by the Donchian zig-zag can act as potential support/resistance lines.
User Settings
Length : Period of the Donchian channel indicator, higher values will return fewer changes of directions from the zig-zag line
Bounce Speed : Determine the speed of bounces made by the zig-zag line, with higher values making the zig-zag line converge faster toward the extremities of the Donchian channel.
Gradient : Determine whether to use a gradient to color the area between each Donchian channel extremities, "On" by default.
Transparency : Transparency of the area between each Donchian channel extremities.
Usage
It is clear that this is not a very common indicator to see, as such usages can be limited and very hypothetical. Nonetheless, when a bounce speed value of 1 is used, the zig-zag line will have the tendency to lag behind the price, and as such can provides crosses with the prices which can provide potential entries.
The advantage of this approach against most indicators relying on crosses with the price is that the linear nature of the indicator allows avoiding retracements, thus potentially holding a position for the entirety of the trend.
Altho this indicator would not necessarily be the most adapted to this kind of usage.
When using a bounce speed superior to 1, we can see the predictive aspects of the indicator:
We can link the peaks/troughs made by the zig-zag with the precedent ones made to get potential support and resistance lines, while such a method is not necessarily accurate it still allows for an additional to interpret the indicator.
Conclusions
We presented an indicator aiming to replicate the behaviour of a zig-zag indicator. While somehow experimental, it has the benefits of being innovative and might inspire users in one way or another.

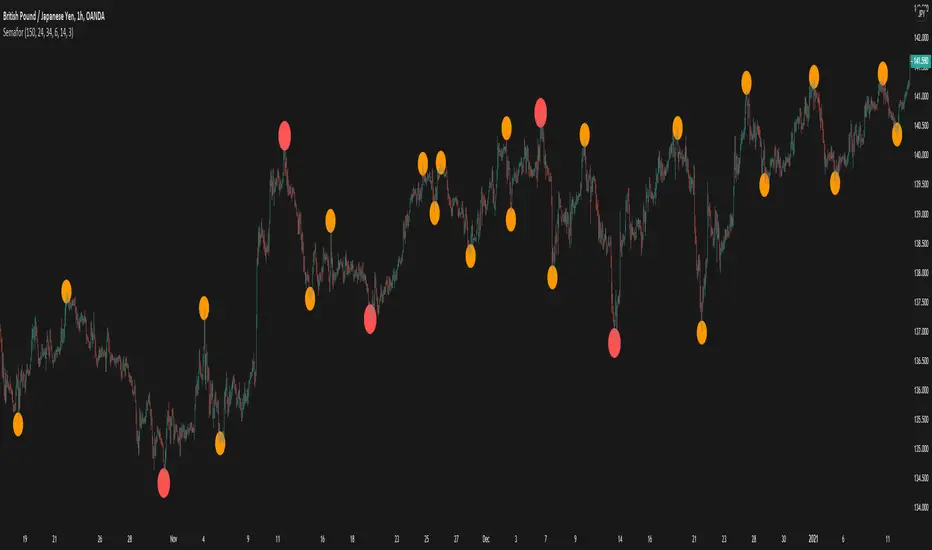
zigzag support&resistance levels [LM]Hello Traders,
I would like to introduce you zigzag support&resistance levels. It is based on the ZigZag semafor script made by DevLucem so shout out to him
The Semafor is used to spot future multi-level Supports and Resistance zones.
It is also useful to spot HL or LL or HH or LH zones at different Depth settings.
The red zones are the extreme places where the market has a higher chance of reversing while the green zones have the lowest setting with lower chances of the market reversal
I have refactored script and extended it with the horizontals.
The lines can be extended like so if you want to see
The lines also can expire when the price will reach it you can change this in general settings:
Also you can use view from the original script with just label circles
Enjoy!
SemaforHello Traders!
I have been away for a while but am recovering back gradually! Here is a gift to all of you.
It is based on the much loved ZigZag++ Script
The Semafor is used to spot future multi-level Supports and Resistance zones.
It is also useful to spot HL or LL or HH or LH zones at different Depth settings.
The red zones are the extreme places where the market has a higher chance of reversing while the green zones have the lowest setting with lower chances of the market reversal
To ease understanding of the code, I used the function `zigzag()` to show the simplicity in calculation
More will be coming this Year!
Tweezers and Kangaroo TailHello Traders,
Here Tweezers and Kangaroo Tail script is in your service. The script searches for Tweezer / Kangaroo Tail candlestick patterns and shows them as T (Tweezer) and K (Kangaroo Tail). Thanks to RorschachT who game me the idea and some details while working on this script.
What are these candlestick patterns?
Tweezers :
- A tweezers pattern occurs when the highs/Lows of two candlesticks occur at almost exactly the same level
- Both candles must have wicks
- Bigger Wick / Smaller Wick rate should not be greater than 150% ( 150% by default and you have option to change it)
- First Candle must be highest/lowest for last 5 candles (5 by default and you have option to change it)
- The level of High for Top, Low for Bottom must be almost lower than 20% of the bigger wick of tweezer candles (20% by default and you have option to change it)
- The Candles can be right next to each other or apart but not more than 12 candles apart (12 by default and you have option to change it)
- You will see that Tweezers pattern occurs frequently
Kangaroo Tail:
- Looks almost like a Hammer or Inverted Hammer candle
- They have both its open and close in the top or bottom third of the candle
- There must be some space/room on the left of the kangaroo tail
- The open and close of the Kangaroo Tail candle must be inside the range of the previous candlestick
- The next candle should create a new high or new low
- You have several options to set details about the "Room" that should be on the left and also options for Wick/Body rates
- You can see example below
You have option to enable/disable any of these patterns.
as far as I have tested they are strong reversal patterns but none of the indicators or patterns may not be enough alone. so you should confirm the signals using other indicators or tools
If you need more information you can find a lot of info on the net ;)
Example: Tweezers - Aparted
Example: Kangaroo Tail - Bullish
Enjoy!
