Displacement Intelligence Channel (DIC) @darshaksscThe Displacement Intelligence Channel (DIC) is a clean, minimal, non-repainting analytical tool designed to help traders observe how price behaves around its dynamic equilibrium.
It does not generate buy/sell signals, does not predict future price movement, and should not be interpreted as financial advice.
All calculations are based strictly on confirmed historical bars.
⭐ What This Indicator Does
Price constantly fluctuates between expansion (large moves) and compression (small moves).
The DIC analyzes these changes through:
Displacement (how far price moves per bar)
ATR response (how volatility reacts over time)
Dynamic width calculation (channel widens or tightens as volatility changes)
EMA-based core midline (a smooth equilibrium reference)
The result is a smart two-line channel that adapts to market conditions without cluttering the chart.
This is NOT a fair value gap, moving average ribbon, or premium/discount model.
It is a purely mathematical displacement-ATR engine.
⭐ How It Works
The indicator builds three elements:
1. Intelligence Midline
A smooth EMA that acts as the channel’s core “equilibrium.”
It gives a stable reference of where price is gravitating during the current session or trend.
2. Adaptive Upper Boundary
Calculated using displacement + ATR.
When volatility increases, the channel expands outward.
When volatility compresses, the channel tightens.
3. Adaptive Lower Boundary
Mirrors the upper boundary.
Also expands and contracts based on market conditions.
All lines update only on confirmed bar closes, keeping the script non-repainting.
⭐ What to Look For (Purely Analytical)
This indicator does not imply trend continuation, reversal, or breakout.
Instead, here’s what traders typically observe:
1. Price Reactions Around the Midline
Price often oscillates around the midline during equilibrium phases.
Strong deviation from the midline highlights expansion or momentum phases.
2. Channel Expansion / Contraction
Wider channel → increased volatility, displacement, and uncertainty
Tighter channel → compression and calm conditions
Traders may use this for context only — not for decision-making.
3. Respect of Channel Boundary
When market structure respects the upper/lower channel lines, it simply indicates volatility boundaries, not overbought/oversold conditions.
⭐ How to Add This Indicator
Open TradingView
Select any chart
Click Indicators → Invite-Only Scripts / My Scripts
Choose “Displacement Intelligence Channel (DIC)”
The channel will appear automatically on the chart
⭐ Recommended Settings (Optional)
These settings do not change signals (because the indicator has none).
They only adjust sensitivity:
Center EMA Length (default 34)
Smoother or faster midline
Displacement Lookback (default 21)
Controls how much recent displacement affects width
ATR Lookback (default 21)
Governs how volatility is interpreted
Min/Max Multipliers
Limits how tight or wide the channel can expand
Adjust them cautiously for different timeframes or asset classes.
⭐ Important Notes
This tool is non-repainting
It does not use future data
It does not repaint previous channel widths
It follows TradingView House Rules
It contains no signals, no alerts, and no predictions
The DIC is designed for visual context only and should be used as an analytical overlay, not as a stand-alone decision tool.
⭐ Disclaimer
This script is strictly for informational and educational purposes only.
It does not provide or imply any trading signals, financial advice, or expected outcomes.
Always do your own research and consult a licensed financial professional before making trading decisions.
Media mobile esponenziale (EMA)

EMA [Fax Academy]EMA is a refined, high-precision exponential moving average suite engineered for professional traders in Forex, metals (gold), indices, and crypto.
Built for clarity, reliability, and structural market insight — without unnecessary complexity.
Why This Indicator
Institution-grade trend detection
Dynamic support/resistance that adapts to volatility
Optimized for execution, pullback entries, and structural clarity
Zero repainting — all calculations use confirmed price data
Minimalist by design — only essential EMAs are enabled to keep your chart clean
Included EMA Levels
A complete set of strategic EMAs tailored for intraday, swing, and long-term analysis.
Toggle EMAs:
20 · 50 · 100 · 200 · 300 · 400 · 500 · 800 · 1000
Custom EMAs (4 Slots):
User-defined range (1–1000)
Individual ON/OFF switches
Fully customizable colors and styling
This design ensures flexibility for every strategy — from scalping to macro positioning.
How to Use
Add the indicator to your chart.
Enable only the EMA levels relevant to your trading style.
Use the custom EMA slots to tailor the indicator to your personal strategy.
Adjust colors and thickness under Style for maximum clarity.
The result: a clean, professional workspace tailored to your workflow.
Recommended Setups (Forex / Gold)
Intraday Momentum & Pullback
EMA 20 – Short-term directional strength
EMA 50 – Pullback structure and micro-trend filter
EMA 200 – Higher-timeframe trend bias (above = bullish, below = bearish)
Swing & Position Trading
EMA 50 + 200 – Classic trend structure
Add EMA 100 – Dynamic mid-term support/resistance
Macro Trend & Regime Analysis
EMA 300 / 400 / 500 / 800 / 1000
Reveal long-cycle trend behavior and institutional structure — ideal for gold and indices
How to Interpret EMAs
Trend Guidance: slope and price positioning
Dynamic Levels: reactions around EMA 20/50 indicate continuation or slowdown
Major Pullbacks: EMA 100/200 define deeper structural retests
Confluence Zones: clusters of EMAs highlight high-probability decision points
This indicator is built to help you see structure, not noise.
Default Settings
EMA 100 → Enabled (balanced mid-term anchor)
All other levels → Disabled (activate only what you need)
Colors optimized for clarity and easily editable
Additional Notes
Works seamlessly on all instruments and timeframes
Fast and lightweight, engineered for real-time decision-making
Non-repainting and built with efficient logic
Ideal for professional traders who prioritize structure and simplicity
Brand Statement
Designed by Fax Academy, this indicator reflects a commitment to precision, clarity, and professional-grade tools.
It is intended for educational and analytical use only — always combine with proven risk management.

paigep.llc - SuperMASuperMA is a multi-layered moving-average and candle-coloring system that combines SMA, EMA, and optional HMA logic to help traders visualize trend shifts, pullbacks, and momentum changes in a clean, structured way.
The script includes multiple modules: trend-based moving averages, pullback signals, exit logic, and an optional HMA cross engine.
📌 Core Features
1. Full SMA + EMA Framework
The indicator plots multiple moving averages (8, 9, 13, 20, 50, 200) using both SMA and EMA calculations. Each line automatically colors bullish or bearish based on its relationship to the 200-period baseline.Users can toggle SMAs and EMAs independently for clearer chart control.
2. Main Trend Entry & Exit Logic (8×200 and 8×20)
Built-in crossover logic detects:
Main Entry: SMA 8 crossing above/below EMA 200
Main Exit: SMA 8 and SMA 20 cross (with an option to choose which SMA is treated as the “fast” leg)
A “first exit only” option allows the script to ignore additional exit signals until a new trend regime begins.
3. Pullback Module (20 SMA Interaction)
Pullback entries and exits occur when price crosses the 20 SMA during existing trend conditions.
This includes:
Pullback entries through the 20 SMA
Pullback exits back across the 20 SMA
Labels and candle colors are available for all pullback events.
4. Optional HMA Cross Module
A separate module allows traders to use two Hull Moving Averages (HMA) with customizable:
Lengths
Independent timeframes
Line colors
Cross-based entries and exits
This module has its own events, labels, and optional candle coloring.
5. Advanced Candle Coloring System
Candle coloring is layered in priority order, based on:
Main trend entries
Main exits
HMA entries
HMA exits
Pullback entries
Pullback exits
Trend-only candles (based on SMA 8 relative to EMA 200)
Users may also independently color wicks and borders.
6. Configurable Alerts (Fully Decoupled from Visuals)
Alerts are available for all major events, including:
Main Entries (8×200)
Main Exits (8×20)
Pullback Entries and Exits
HMA Entries and Exits
Bull or Bear Trend candles
Any colored candle event
Alerts can fire on bar close only or intrabar, depending on user preference.
📌 Use Cases
SuperMA helps traders visualize:
Trend direction using SMA/EMA structure
Momentum shifts through HMA crosses
Pullback zones around the 20 SMA
Early regime transitions based on the 8×200 relationship
Candle-level context through color-coded bars
The indicator works across all markets and timeframes.
⚠️ Note
This tool is for visual and analytical assistance only. It does not guarantee future performance and should be combined with additional analysis and risk management.

paigep.llc - SuperMA
SuperMA is a multi-layered moving-average and candle-coloring system that combines SMA, EMA, and optional HMA logic to help traders visualize trend shifts, pullbacks, and momentum changes in a clean, structured way.
The script includes multiple modules: trend-based moving averages, pullback signals, exit logic, and an optional HMA cross engine.
📌 Core Features
1. Full SMA + EMA Framework
The indicator plots multiple moving averages (8, 9, 13, 20, 50, 200) using both SMA and EMA calculations. Each line automatically colors bullish or bearish based on its relationship to the 200-period baseline. Users can toggle SMAs and EMAs independently for clearer chart control.
2. Main Trend Entry & Exit Logic (8×200 and 8×20)
Built-in crossover logic detects:
Main Entry: SMA 8 crossing above/below EMA 200
Main Exit: SMA 8 and SMA 20 cross (with an option to choose which SMA is treated as the “fast” leg)
A “first exit only” option allows the script to ignore additional exit signals until a new trend regime begins.
3. Pullback Module (20 SMA Interaction)
Pullback entries and exits occur when price crosses the 20 SMA during existing trend conditions.
This includes:
Pullback entries through the 20 SMA
Pullback exits back across the 20 SMA
Labels and candle colors are available for all pullback events.
4. Optional HMA Cross Module
A separate module allows traders to use two Hull Moving Averages (HMA) with customizable:
Lengths
Independent timeframes
Line colors
Cross-based entries and exits
This module has its own events, labels, and optional candle coloring.
5. Advanced Candle Coloring System
Candle coloring is layered in priority order, based on:
Main trend entries
Main exits
HMA entries
HMA exits
Pullback entries
Pullback exits
Trend-only candles (based on SMA 8 relative to EMA 200)
Users may also independently color wicks and borders.
6. Configurable Alerts (Fully Decoupled from Visuals)
Alerts are available for all major events, including:
Main Entries (8×200)
Main Exits (8×20)
Pullback Entries and Exits
HMA Entries and Exits
Bull or Bear Trend candles
Any colored candle event
Alerts can fire on bar close only or intrabar, depending on user preference.
Use Cases
SuperMA helps traders visualize:
Trend direction using SMA/EMA structure
Momentum shifts through HMA crosses
Pullback zones around the 20 SMA
Early regime transitions based on the 8×200 relationship
Candle-level context through color-coded bars
The indicator works across all markets and timeframes.
⚠️ Note
This tool is for visual and analytical assistance only. It does not guarantee future performance and should be combined with additional analysis and risk management.

EMA CrossMoving averages based trend indicator
Plots
Hull Moving average 34
Simple MA 200
Exponential MA 5
Signals on crossing and turn around points.

Multi MAThis TradingView indicator displays four customizable moving averages on your price chart: two Exponential Moving Averages (EMAs) and two Simple Moving Averages (SMAs).
The default settings show a 10-period EMA (aqua), 21-period EMA (orange), 50-period SMA (green), and 200-period SMA (red), which are commonly used timeframes for trend analysis.
Each moving average can be individually toggled on or off, and their lengths and colors are fully adjustable through the indicator settings.
The EMAs react more quickly to price changes while the SMAs provide smoother, more gradual trend indicators, making this useful for identifying support/resistance levels and trend direction.
Traders often watch for crossovers between these moving averages as potential entry or exit signals, with the 50/200 SMA cross being particularly significant as the "golden cross" or "death cross."

Mambo MA & HAMambo MA & HA is a combined trend-view indicator that overlays Heikin Ashi direction markers and up to eight customizable moving averages on any chart.
The goal is to give a clear, uncluttered visual summary of short-term and long-term trend direction using both regular chart data and Heikin Ashi structure.
This indicator displays:
Heikin Ashi (HA) directional markers on the chart timeframe
Optional Heikin Ashi markers from a second, higher timeframe
Up to eight different moving averages (SMA, EMA, SMMA/RMA, WMA, VWMA)
Adjustable colors and transparency for visual layering
Offset controls for HA markers to prevent overlap with price candles
It is designed for visual clarity without altering the underlying price candles.
Heikin Ashi Direction Markers (Chart Timeframe)
The indicator generates HA OHLC values internally and compares the HA open and close:
Green (bullish) HA candle → triangle-up marker plotted above the bar
Red (bearish) HA candle → triangle-down marker plotted above the bar
The triangles use soft pastel colors for minimal obstruction:
Up marker: light green (rgb 204, 232, 204)
Down marker: light red (rgb 255, 204, 204)
The “HA Offset (chart TF ticks)” input lets users shift the triangle vertically in price terms to avoid overlapping the real candles or MAs.
Heikin Ashi Markers from a Second Timeframe
An optional second timeframe (default: 60m) shows additional HA direction:
Green HA (higher timeframe) → tiny triangle-up below the bar
Red HA (higher timeframe) → tiny triangle-down below the bar
This allows a trader to see higher-timeframe HA structure without switching charts.
The offset for the second timeframe is independent (“HA Offset (extra TF ticks)”).
Custom Moving Averages (Up to Eight)
The indicator includes eight individually configurable MAs, each with:
On/off visibility toggle
MA type
SMA
EMA
SMMA / RMA
WMA
VWMA
Source
Length
Color (with preset 70% transparency for visual stacking)
The default MA lengths are: 10, 20, 50, 100, 150, 200, 250, 300.
All MA colors are slightly transparent by design to avoid obscuring price bars and HA markers.
Purpose of the Indicator
This tool provides a simple combined view of:
Immediate trend direction (chart-TF HA markers)
Higher-timeframe HA trend bias (extra-TF markers)
Overall moving-average structure from short to very long periods
It is particularly useful for:
Monitoring trend continuation vs. reversal
Confirming entries with multi-TF Heikin Ashi direction
Identifying pullbacks relative to layered moving averages
Viewing trend context without switching timeframes
There are no signals, alerts, or strategy components.
It is strictly a visual trend-context tool.
Key Features Summary
Two-timeframe Heikin Ashi direction
Separate offsets for HA markers
Eight fully configurable MAs
Clean color scheme with low opacity
Non-intrusive overlays
Compatible with all markets and chart types

Trade By Design – Free Edition (v0.1)A clean, high-performance session & liquidity framework designed to bring structure, clarity, and precision to your intraday trading.
This indicator is inspired by the Trade Travel Chill – Trade By Design methodology and provides a free, simplified version of the core concepts—ideal for day traders seeking to understand market structure, session behavior, and intraday liquidity dynamics.
🔍 What This Indicator Does
The Free Edition automatically maps the most important intraday levels and contextual factors that drive daily price delivery.
Key Features:
• HOW / LOW
• IHOD / ILOD / 50% Asia
• HOD / LOD
• PVSRA Candles
• Vector candles
• Perp autooverride
⚠️ Version Notice (v0.1 – Early Release)
This is an early, not all features are active yet.
This version focuses purely on the core structure, keeping everything lightweight and easy to use.
⚠️ Disclaimer
This is an unofficial free re-creation inspired by public concepts taught in the Trade By Design methodology.
It is not endorsed, affiliated with, or sponsored by TradeTravelChill.club or its owners.
If you enjoy this indicator and want the complete methodology, mentorship, and full system, please support the original creators by purchasing the official course at:
👉 tradetravelchill.club


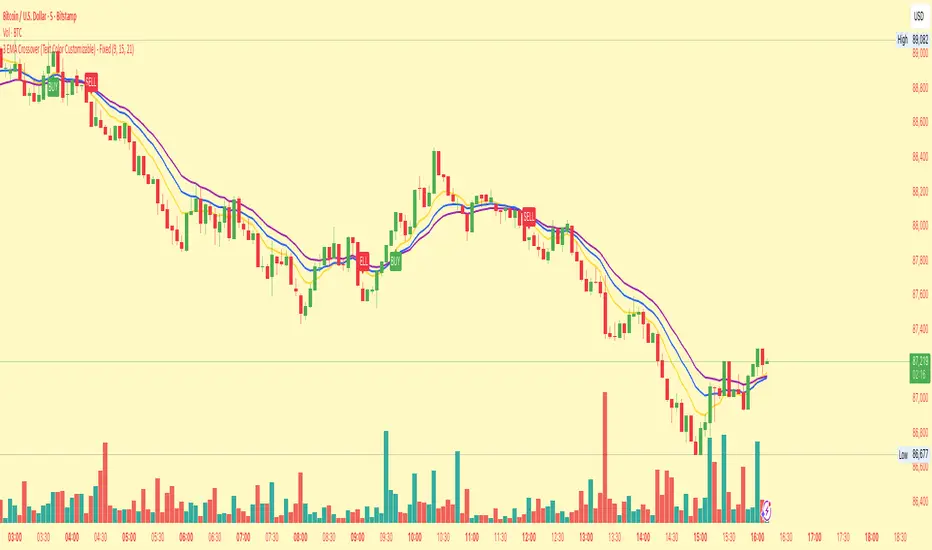
3 EMA Crossover (Text Color Customizable) - Fixed3 Ema crossover 9/15/21
it will generate buy and sell signal on crossover.
Triple 9 Bias filter Triple 9 Bias – Precision Multi-Timeframe Directional Filter
Technical Overview
The Triple 9 Bias is a precision multi-timeframe directional filter built exclusively for 5-minute (and lower) trading.
It stacks three EMA-9 trend directions (4H + 1H + 15m) as Primary confluence and uses only the 4H RSI-14 as Secondary confirmation.
Integrity Check: Zero repaint · Zero lookahead · Works identically on any chart timeframe.
The Trading Rule (Simple)
Long Trades: Only trade longs when all three EMA-9s are UP + 4H RSI > 50
Short Trades: Only trade shorts when all three EMA-9s are DOWN + 4H RSI < 50
Otherwise — stand aside.
Display Components
A. Plotted Higher-Timeframe EMAs (No Repainting)
All values are pulled from closed higher-timeframe bars.
4H EMA 9 (Red step-line)
1H EMA 9 (Purple step-line)
15m EMA 9 (Orange step-line)
B. Locked Dashboard (Bottom-Right)
Clean table split into Primary and Secondary sections for instant bias reading.
Colour Logic:
🟢 Lime = UP / BUY
🔴 Red = DOWN / SELL
Background Logic:
Full Green: Only when all three EMA-9s are UP
Full Red: Only when all three EMA-9s are DOWN
Gray: Otherwise = no trade
Indicator Breakdown
3.1. Primary Confluence – EMA 9 Slope
4H EMA 9 direction (compared 10 bars back)
1H EMA 9 direction (compared 6 bars back)
15m EMA 9 direction (compared 6 bars back)
3.2. Secondary Confluence
4H RSI-14 vs 50 level (BUY if >50, SELL if <50)
High-Probability Signal: When Primary = all three “UP” and Secondary = “BUY” → highest-probability bullish bias (and vice-versa for bearish).

Price Action - EMA ClusterAligned with Al Brooks' multi-timeframe analysis in his series, this plots three EMA20 lines on 5m charts: current (line), 15m (stepline), and 60m (stepline). Visible only on 5m timeframe for clarity. EMAs act as dynamic trend channels—price above signals bull bias, below bear. Test extremes: Pullbacks to EMA often offer second-leg entries in trends. Customize colors for better visualization of always-in direction.

Strict Weekly 50/200 WMA Signals True Weekly Only-Strict Weekly 50/200 WMA Signals True Weekly Only => also on other time frames than weekly (like daily, etc.) always indicates the indicators based on the weekly chart
-especially useful for Crypto
-gives buy and sell signals when the 200 WMA or the 50 WMA are crossed
-typically above the 50 WMA indicates a bull market
-reaching below the 200 WMA indicates a bear market and typically for investors with a longer time frame (>2-4 years) a good entry point

MTRA Pro+ ScreenerMTRA Pro+ Screener an analysis tool that provides traders with critical market structure information on up to 10 instruments simultaneously. This indicator consolidates momentum direction, trend analysis, range relationships, and volatility metrics into a single dashboard.
## Key Features
- Customizable display with adjustable positioning, colors, and sizing
**Momentum & Trend Tracking**
- Real-time momentum direction via 5-period SMA slope analysis
- Short-term trend direction using 10-period SMA slope analysis
- Color-coded visual representation for quick interpretation
**Range Relationship Analysis**
- Current bar analysis relative to previous period (Inside, Outside, 2Up, 2Dn)
- Three-period historical view of recent price action patterns
- Immediate identification of breakout and consolidation scenarios
**ATR-Based Volatility Analysis**
- Real-time ATR percentage calculations showing current range vs. average
- Visual distinction between normal (<100% ATR) and extended (>100% ATR) conditions
- Identification of potential exhaustion zones for risk management
**Intraday ATR Levels**
- Dynamic support/resistance levels based on current timeframe ATR
- Real-time upper and lower boundaries for precise entries/exits
- Customizable line styles integrated with price scale
## Practical Applications
- **Context Assessment**: Quickly gauge market conditions across multiple intraday timeframes
- **Exhaustion Detection**: Identify overextended moves when ATR exceeds 100%
- **Confluence Analysis**: Spot potential setups when timeframes align
- **Risk Management**: Some traders will use ATR levels for dynamic stops and position sizing
- **Breakout Confirmation**: Distinguish false breakouts from genuine momentum shifts
## Configuration Options
- Full dashboard positioning and color customization
- Individual timeframe toggles
- Adjustable ATR periods and sensitivity thresholds
- Multiple line styles for level visualization

HTF BIAS FILTER🧭HTF Bias Filter Indicator: 5 in 1 indicator
Technical Overview
The Bias Filter is a comprehensive multi-timeframe tool designed to confirm directional bias using five key indicators before entering a trade. It plots higher-timeframe Moving Averages directly on the chart and provides an immediate status summary via a static dashboard.
The more confluence on the dashboard, the greater the probability of the direction of the trade.
1. 📊 Display Components
A. Plotted Lines
The indicator uses the request.security function to draw Moving Averages from higher timeframes onto your current chart:
1H EMA 21 (Purple): The 21-period Exponential Moving Average calculated on the 1-Hour (60 min) chart. Plotted using a step-line style.
4H EMA 50 (Red): The 50-period Exponential Moving Average calculated on the 4-Hour (240 min) chart. Plotted using a step-line style.
B. Directional Dashboard
A fixed-position summary table is anchored to the bottom-right corner of the chart, providing a quick glance at the current status of all five filters.
2. 🎨 Colour Logic
Each of the five indicators is assigned a colour based on its current directional signal. The more indicators that show the same colour (confluence), the stronger the signal and the higher the likelihood of a high-probability trade.
🟢 Green indicators are signaling UP/BUY (Bullish momentum or trend).
🔴 Red indicators are signaling DOWN/SELL (Bearish momentum or trend).
⚫ Gray indicators are signaling Mixed or flat directions (neutral or undecided).
Note: The dashboard's main header color is determined by a strict confluence logic (All four 4H filters must align for Green/Red), while individual indicator colors follow the simple rules above.
3. 📋 Indicator Breakdown and Logic
The dashboard provides the direction of five different filters.
3.1. Higher-Timeframe (HTF) Trend Indicators
These two signals determine the immediate slope and direction of the primary Moving Averages:
4H EMA 50:
Timeframe: 4-Hour (240 min)
Logic: Compares the current EMA value to the value two bars ago on the 4H chart.
Output: UP ↑, DOWN ↓, or FLAT ⏸
1H EMA 21:
Timeframe: 1-Hour (60 min)
Logic: Compares the current EMA value to the value two bars ago on the 1H chart.
Output: UP ↑, DOWN ↓, or FLAT ⏸
3.2. 4-Hour Confluence Filters
These three indicators provide supplementary confirmation on Volume, Price Position, and Momentum, all calculated on the 4-Hour (240 min) chart:
4H OBV (Smoothed):
Timeframe: 4-Hour (240 min)
Logic: Direction is based on the current value of the 21-bar smoothed On-Balance Volume (OBV) compared to its value nine bars ago.
Output: UP ↑, DOWN ↓, or FLAT ⏸
4H ATR DIR (EMA Proxy):
Timeframe: 4-Hour (240 min)
Logic: Determines the price position by comparing the current Close price against the 4H EMA 50.
Output: BUY 🟢 (Close > EMA 50), SELL 🔴 (Close < EMA 50), or FLAT ⏸️ (Close = EMA 50).
4H RSI (14):
Timeframe: 4-Hour (240 min)
Logic: Momentum check comparing the 14-period Relative Strength Index (RSI) value against the 50 level.
Output: BUY 🟢 (RSI > 50), SELL 🔴 (RSI < 50), or FLAT ⏸️ (RSI = 50).

HybridWhales DAY TRADINGThis indicator offers a streamlined view of prevailing market trends on lower timeframes, empowering day traders to execute their strategies with greater precision
It incorporates two widely used exponential moving averages (EMAs)—the 50-period and 200-period—alongside an 800-period EMA, which effectively mirrors the 200-period EMA on the next higher timeframe. This setup provides enhanced flexibility, delivering multi-timeframe insights without the need to switch charts manually.
In addition, the indicator highlights essential intraday levels for quick reference:
Daily Open, denoted in yellow
Monday Highs, marked in red
Monday Lows, indicated in green
The indicator's core strength lies in its ability to detect market maker activity through color-coded candlesticks, based on volume analysis. Candles exhibiting significantly higher volume than the average of the prior eight candles are colored green (for bullish closes) or red (for bearish closes), signaling active market maker positioning—either entering shorts or longs.
Candles with moderately elevated volume (above average but not extreme) are shaded blue (bullish) or pink (bearish), suggesting market makers are accumulating short or long positions.
Interpretation is key: Red or pink candles (bearish) imply that market makers have initiated long positions, with price likely to revisit and fill these areas in the future. Conversely, green or blue candles (bullish) indicate market makers establishing shorts, anticipating a eventual pullback to these levels
To pinpoint the precise zones where price may return, the indicator places a white marker on each colored candle at its 50% retracement level, representing a fair value gap or imbalance.
Overall, this tool enables traders to spot market maker footprints, identify critical support and resistance zones, gauge weekly ranges, and assess potential momentum. While it fosters stronger confluence in analysis, results are not guaranteed and depend on individual trading execution.

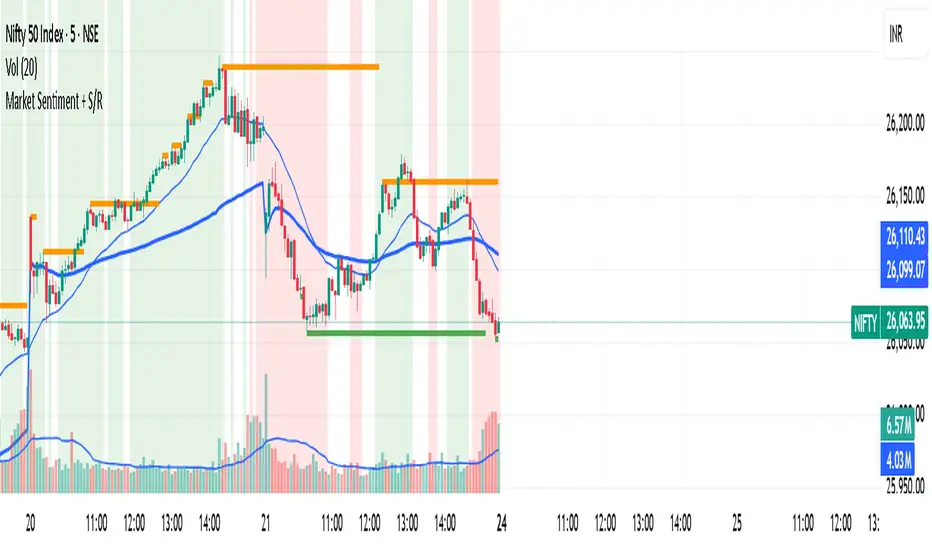
Market Sentiment + S/R KPRThis script is having VWAP and moving average cross overs. and also support and resistence.
HTF EMA Ribbon Bias by HammerGeekThis indicator displays a higher-timeframe EMA-ribbon bias directly on any lower-timeframe chart. It uses four EMAs (5, 9, 13, 21) computed on the selected higher timeframe and detects the directional “stacking” of those EMAs to determine trend bias:
Bullish: EMAs are strictly stacked 5 > 9 > 13 > 21 (fully separated, no overlap)
Bearish: EMAs are strictly stacked 5 < 9 < 13 < 21
Neutral: Any overlap, crossing, or mixed order between the four EMAs
The indicator shades the background to show the bias: green for bullish, red for bearish, yellow for neutral. A built-in toggle lets you choose whether the bias should update live from the current higher-timeframe candle (faster, but may repaint) or only after the higher-timeframe candle closes (slower, but non-repainting).
Designed for traders who want clean, instantly readable higher-timeframe context—especially when working on lower-timeframe charts such as 30m, 15m, or 5m.
All settings can be modified to suit users' desires.

MTF EMA Directional Bias -1hr and 4hr A compact, fixed-position table (bottom-right corner) that shows the current slope direction of two higher-timeframe EMAs:
4H EMA 50 → direction over the last 2 bars (UP ↑, DOWN ↓, or FLAT ⏸)
1H EMA 21 → direction over the last 2 bars (UP ↑, DOWN ↓, or FLAT ⏸)
Background color logic:
Green → both 4H and 1H EMAs are sloping upward
Red → both 4H and 1H EMAs are sloping downward
Gray → mixed or flat directions (no confluence)
Additionally draws the actual 1H EMA-21 (purple) and 4H EMA-50 (red) as step-lines on the chart.

Tripwire Pro+Tripwire – Trail-Based Trend Direction Indicator
OVERVIEW
Tripwire is a powerful, volatility-adaptive trailing indicator designed to keep traders on the right side of momentum while offering signals and alerts based on the users settings and filters.
CONCEPT & INSPIRATION
This indicator is directly inspired from the Zombie9Trail by Frosty (creator of the Zombie Pack and TickHunter for NinjaTrader).
When all filters are turned off, Tripwire replicates the core behavior of Zombie9Trail — delivering the same razor-sharp trailing logic.
Most of Frosty's testing has been done from the 1 minute time frame, while I have personally found for my style of trading the 5 minute time frame works better for me.
WHAT THIS VERSION ADDS — TradingView Enhancements
• Optional multi-layer trend filters (21, 34, 170 EMA) to separate high-probability pullbacks from actual trend changes
• Clean Buy/Sell/Pullback signal labels with alert conditions
• Real-time dashboard showing current trail value, trend state, and filter status
• Fully customizable ATR length, multiplier, source, and visual styling
• All values exported as plots — perfect for CSV download and strategy development
HOW TO USE
Filters ON (recommended for trend-following) → Take signals in the direction of the higher-timeframe trend. Great for staying in strong moves and avoiding fake outs.
Filters OFF (pure Zombie9Trail mode) → Possibly catch early reversals and ride new trends
CREDIT & RESPECT
Core trailing methodology and original genius: Frosty — creator of Zombie9Trail / Zombie Pack / TickHunter (NinjaTrader).
This TradingView adaptation was built in direct homage to his NinjaTrader work and with his encouragement. Everything beyond the base trailing logic (filters, dashboard, alerts, exportable plots, visual polish) is original.
DISCLAIMER
For educational and informational purposes only. Not financial advice. Past performance is no guarantee of future results. Test thoroughly.

9/21 EMA Trend TOP rIGHT CORNER INDICATORCrossover indicator for the 9 & 21 EMA. Buy Sell for cross up or down respectively. Daily, weekly and Monthly trend.

GBPUSD Weekly Cross LinesThis indicator tracks 20/50 EMA crossovers on GBPUSD (Weekly timeframe) and displays the crossover points across all symbols and timeframes, allowing traders to visually align current price action with key historical turning points in GBPUSD.
The script works by detecting bullish (20 EMA crossing above 50 EMA) and bearish (20 EMA crossing below 50 EMA) signals since 2010, using request.security() to source data from GBPUSD weekly candles, even if the indicator is applied to AAPL, EURJPY, BTCUSD, or any other asset.
Each crossover is marked with a vertical line that persists across all charts, offering a powerful way to:
Compare current market context with GBPUSD’s historical trend shifts
Observe intermarket correlations
Align trading timing across multiple assets
Spot macro trend transitions that ripple across global markets
