Multi-Timeframe Trend IndicatorMulti-Timeframe Trend Indicator
The “Multi-Timeframe Trend Indicator” is a versatile tool designed to help traders identify trends across multiple timeframes using Exponential Moving Averages (EMAs). This indicator is suitable for both novice and experienced traders. It allows users to customize the lengths of the short and long EMAs, providing a clear visualization of the trend direction (UP, DOWN, SIDE) for various intervals including 1 minute, 5 minutes, 15 minutes, 30 minutes, 1 hour, and 4 hours. The indicator offers extensive customization options, enabling adjustments for table position, colors, and more to suit individual trading preferences.
How the Calculation Works
The Multi-Timeframe Trend Indicator uses EMAs to calculate trends. EMAs give more weight to recent prices, making them responsive to new information. The short EMA, calculated over a shorter period, reacts quickly to price changes, while the long EMA, calculated over a longer period, smooths out fluctuations to show the overall trend.
For each timeframe, the indicator calculates both the short EMA and the long EMA. If the short EMA is above the long EMA, the trend is considered “UP”. If the short EMA is below the long EMA, the trend is “DOWN”. If the absolute difference between the short and long EMAs is within a user-defined threshold, the trend is classified as “SIDE” (sideways).
This calculation is repeated for multiple timeframes: 1 minute, 5 minutes, 15 minutes, 30 minutes, 1 hour, and 4 hours. The results are displayed in a table, providing a comprehensive view of the trend direction across different timeframes.
How the Code Works
Input Parameters: Users can input the lengths of the short and long EMAs and the threshold for identifying sideways trends. These inputs allow for a high degree of customization to match individual trading strategies.
Trend Calculation Function: The trend function calculates the trend direction based on the EMAs. It uses the math.abs function to find the absolute difference between the EMAs and determines if the trend is “UP”, “DOWN”, or “SIDE” based on the threshold.
Requesting Data for Multiple Timeframes: The script uses the request.security function to fetch price data and calculate the EMAs for different timeframes independently of the current chart timeframe. This ensures consistency in trend analysis regardless of the displayed timeframe.
Creating and Updating the Table: A table is created to display the trend directions for each timeframe. The table’s position and appearance can be customized. The trend data for each timeframe is color-coded (green for UP, red for DOWN, gray for SIDE) and displayed in the table.
Customization Options: Users can customize the colors, table position, and EMA lengths through the indicator settings, providing flexibility to adapt the indicator to their trading style.
Disclaimer
This indicator is for informational purposes only and should not be considered financial advice. It does not predict future price movements and does not guarantee accurate trend calculations, as market conditions can vary. Trading involves substantial risk and is not suitable for everyone. Always conduct your own research before making any trading decisions.
Media mobile esponenziale (EMA)

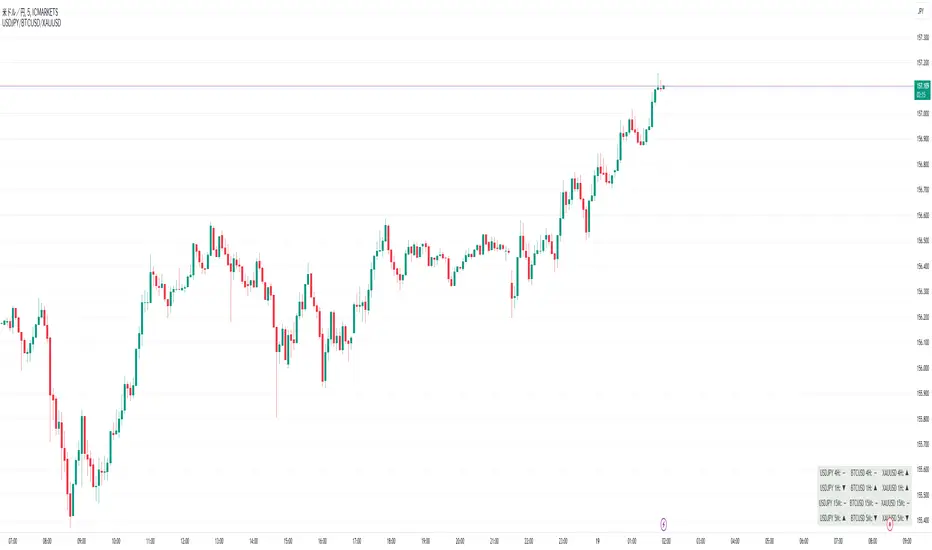
Perfect Order Alert USDJPY/BTCUSD/XAUUSDPerfect Order Alert USDJPY/BTCUSD/XAUUSD 日本語解説は下記
This indicator detects the perfect order of three moving averages and displays on the Panel in an easy-to-understand visual manner whether there is an uptrend, downtrend, or non-trend for each time leg.
This indicator detects perfect orders for the three currency pairs USDJPY/BTCUSD/XAUUSD on the 5-minute, 15-minute, 1-hour, and 4-hour time frames, and displays them on the Panel on the chart, with “▲” for up, “▼” for down, and “ー” for non-trend, so that you can quickly determine the trend. The panel is displayed on the chart.
In order to check for perfect orders without missing them, it is also possible to set up alerts that notify you of all the time frames and currency pairs as well.
Functions
Displaying 4H, 1H, 15M, 5M, up (▲), down (▼), other (-), of USDJPY/BTCUSD/XAUUSD on the panel.
*(By default, 20EMA, 75EMA, and 200EMA are hidden.)
Display position setting of the panel (You can choose from upper left, upper top, upper right, lower left, lower bottom, or lower right).
Panel color and text color change function
The moving average line can be hidden by default.
Moving average period change
Moving average color and thickness can be changed.
EMA/SMA switchable
Alert function - One alert can be set for each currency pair and time frame ▲▼, which is very useful.
Perfect Order Alert
You can use it even if you have a free account with only one alert setting.
To use the alert function, go to the Tradingview default alert settings, select “USDJPY/BTCUSD/XAUUSD” for the top item of conditions, and select “Call Alert() function” in the frame just below it!
_* Supplementary explanation: ____________
Please note that due to the limitation of the script, only 3 currency pairs and 4 time frames are displayed with 12 items (Panels for currency pairs other than USDJPY/BTCUSD/XAUUSD are also created, but they are indicators for other scripts, so if you are interested in other currency pairs, please use those. If you are interested in other currency pairs, please use them.)
Please note that we may change the functions or delete the indicator itself without prior notice.
Translated with DeepL.com (free version)
Reference image of the setting screenReference image of the setting screen
設定画面参考画像
3本の移動平均線のパーフェクトオーダーを検知し、時間足ごとに上昇トレンドか下降トレンドかノントレンドかを視覚的にわかりやすくPanelに表示するインジゲーターです。
このインジゲーターは、USDJPY/BTCUSD/XAUUSDの3通貨ペアの5分足、15分足、1時間足、4時間足のパーフェクトオーダーを検知して、チャートに表示されるPanelに、上昇は「▲」下降は「▼」ノントレンドは「ー」と、すぐに判断できる表示にしてあります。
パーフェクトオーダーを逃さずチェックできるように、それぞれの時間足や通貨ペアも全てを通知してくれるアラート設定が可能なのも特徴です。
機能紹介
・USDJPY/BTCUSD/XAUUSDの4H,1H,15M,5M,の上昇(▲),下降(▼),その他(-),をパネルに表示
※(デフォルトでは20EMA,75EMA,200EMAの3本で非表示にしてあります)
・パネルの表示位置設定(左上、上、右上、左下、下、右下、から選択できます。)
・パネルの色とテキスト色変更機能
・移動平均線表示非表示機能(デフォルトでは表示OFFにしてあります。)
・移動平均線期間変更
・移動平均線色と太さ変更
・EMA/SMA切り替え可能
・アラート機能ー1つのアラート設定で通貨ペアと時間足▲▼一つ一つを細かく教えてくれるので便利。
※パーフェクト オーダーアラート
無料アカウントで1つしかアラート設定できなくても使えます。
アラート機能はTradingviewデフォルトのアラート設定から、条件の一番上の項目を「USDJPY/BTCUSD/XAUUSD」選択、そのすぐ下の枠に「Alert()関数の呼び出し」を選択でOK!
_※ 補足説明____________
・スクリプトの制限の為、3通貨ペアと4つの時間足の12項目で表示させていますのでご了承ください
(USDJPY/BTCUSD/XAUUSD以外の通貨ペアのPanelも作成していますが別スクリプトのインジゲーターになりますので他の通貨ペアも興味がある方はそちらをお使いください)
・予告なしで機能の変更やインジゲーター自体の削除等行う事もあるかもなのでご了承ください。
Moving Average Trend Meter [UkutaLabs]█ OVERVIEW
The Moving Average Trend Meter is a powerful trading indicator that visualizes current market strength. This indicator uses a series of four EMAs (Exponential Moving Averages) to determine short, medium and long term market strength. Each of the three rows of boxes corresponds to an EMA, with the top being the fast, the middle being the medium and the bottom being the slow. Depending on whether each EMA is above or below the source EMA, its corresponding row will be colored accordingly, with the boxes appearing green if the source is above it or red if it is below.
This indicator also displays when the strength of the market is transitioning between bullish and bearish, indicating that there may be an upcoming reversal.
The purpose of this script is to simplify the trading experience of users by providing an easier way to visualize current market strength using a series of EMAs.
█ USAGE
This indicator provides an easy to understand method of visualizing the current market strength based on the positioning of four EMAs. By default, the period for these EMAs are selected based on key Fibonacci levels, and the period of each one can be customized in the indicator settings.
Depending on whether or not the source EMA is above or below each of the other three EMAs, the boxes of the corresponding rows will be colored to indicate the current strength of the market.
If all three boxes are drawn the same color, a dot of the same color will be drawn above the boxes.
█ SETTINGS
Configuration
• Source EMA: Determines the period of the source EMA.
• Fast EMA: Determines the period of the fast EMA.
• Med EMA: Determines the period of the medium EMA.
• Slow EMA: Determines the period of the slow EMA.
Colors
• Bullish Color: Determines the color of boxes when the source EMA is above the respective EMA.
• Bearish Color: Determines the color of boxes when the source EMA is below the respective EMA.
• Bullish Transition Color: Determines the color of boxes when the current bar closes above the respective EMA while the source is below it.
• Bearish Transition Color: Determines the color of boxes when the current bar closes below the respective EMA while the source is above it.

Heiken Ashi Ribbon [UkutaLabs]█ OVERVIEW
The Heiken Ashi Ribbon is a powerful trading tool that creates a strong ribbon that indicates market strength. This ribbon is created using four moving averages that use Heiken Ashi values (high, low, open and close) as its input values.
The ribbon will also be colored green, red or grey depending on whether or not its direction aligns with current market strength.
█ USAGE
The Heiken Ashi Ribbon is created using a series of four moving averages that uses values from the Heiken Ashi bars as its inputs. The user has the ability to select whether the moving averages are EMAs or SMAs, as well as the ability to control the period of the moving averages.
If the moving average calculated using the Heiken Ashi Open is below the moving average calculated using the Heiken Ashi Close, the ribbon will be colored green, indicating a bullish trend. If the moving average calculated using the Heiken Ashi Open is above the moving average calculated using the Heiken Ashi Open, the ribbon will be colored red, indicating a bearish trend.
This indicator also uses a series of hidden EMAs to determine market strength. If these EMAs do not align with the direction of the Heiken Ashi Ribbon, the Ribbon will instead be colored grey, indicating uncertainty in the market, as well as a possible reversal.
█ SETTINGS
Configuration
• Moving Average Type: Determines whether or not the Heiken Ashi Moving Averages will be drawn as EMAs or SMAs.
• Moving Average Period: Determines the period of the Heiken Ashi Moving Averages.
Moving Average
• Moving Average Input: Determines the input values for the hidden EMAs.

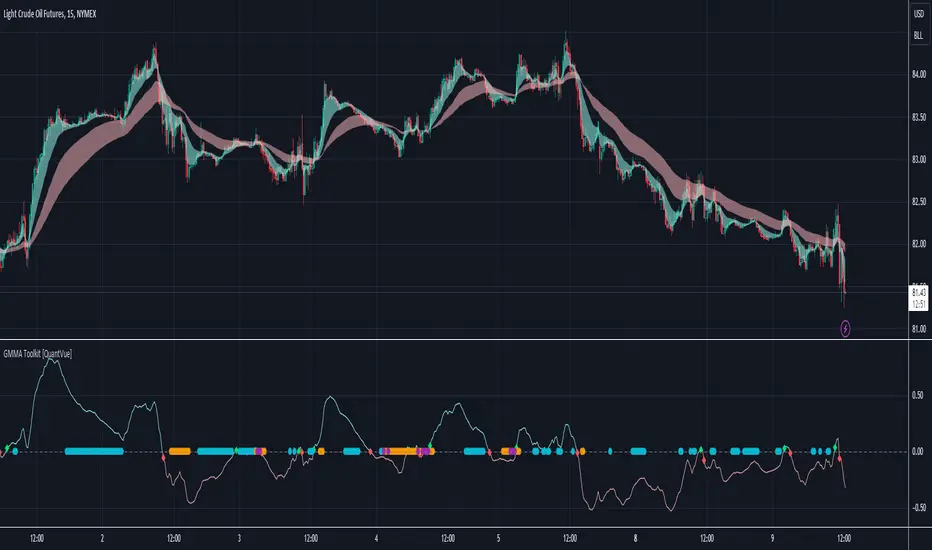
GMMA Toolkit [QuantVue]The GMMA Toolkit is designed to leverage the principles of the Guppy Multiple Moving Average (GMMA). This indicator is equipped with multiple features to help traders identify trends, reversals, and periods of market compression.
The Guppy Multiple Moving Average (GMMA) is a technical analysis tool developed by Australian trader and author Daryl Guppy in the late 1990s.
It utilizes two sets of Exponential Moving Averages (EMAs) to capture both short-term and long-term market trends. The short-term EMAs represent the activity of traders, while the long-term EMAs reflect the behavior of investors.
By analyzing the interaction between these two groups of EMAs, traders can identify the strength and direction of trends, as well as potential reversals.
Due to the nature of GMMA, charts can become cluttered with numerous lines, making analysis challenging.
However, this indicator simplifies visualization by using clouds to represent the short-term and long-term EMA groups, determined by filling the area between the maximum and minimum EMAs in each group.
The GMMA Toolkit goes a step further and includes an oscillator that measures the difference between the average short-term and long-term EMAs, providing a clear visual representation of trend strength and direction.
The farther the oscillator is from the 0 level, the stronger the trend. It is plotted on a separate panel with values above zero indicating bullish conditions and values below zero indicating bearish conditions.
The inclusion of the oscillator in the GMMA Toolkit allows traders to identify earlier buy and sell signals based on the GMMA oscillator crossing the zero line compared to traditional crossover methods.
Lastly, the GMMA Toolkit features compression dots that indicate periods of market consolidation.
By measuring the spread between the maximum and minimum EMAs within both short-term and long-term groups, the indicator identifies when these spreads are significantly narrower than average by comparing the current spread to the average spread over a lookback period.
This visual cue helps traders anticipate potential breakout or breakdown scenarios, enhancing their ability to react to imminent trend changes.
By simplifying the visualization of the Guppy Multiple Moving Averages with clouds, providing earlier buy and sell signals through the oscillator, and highlighting periods of market consolidation with compression dots, this toolkit offers traders insightful tools for navigating market trends and potential reversals.
Give this indicator a BOOST and COMMENT your thoughts below!
We hope you enjoy.
Cheers!
Smoothed Heiken Ashi Candles with Delayed SignalsThis is a trend-following approach that uses a modified version of Heiken Ashi candles with additional smoothing. Here are the key components and features:
1. Heiken Ashi Modification: The strategy starts by calculating Heiken Ashi candles, which are known for better trend visualization. However, it modifies the traditional Heiken Ashi by using Exponential Moving Averages (EMAs) of the open, high, low, and close prices.
2. Double Smoothing: The strategy applies two layers of smoothing. First, it uses EMAs to calculate the Heiken Ashi values. Then, it applies another EMA to the Heiken Ashi open and close prices. This double smoothing aims to reduce noise and provide clearer trend signals.
3. Long-Only Approach: As the name suggests, this strategy only takes long positions. It doesn't short the market during downtrends but instead exits existing long positions when the sell signal is triggered.
4. Entry and Exit Conditions:
- Entry (Buy): When the smoothed Heiken Ashi candle color changes from red to green (indicating a potential start of an uptrend).
- Exit (Sell): When the smoothed Heiken Ashi candle color changes from green to red (indicating a potential end of an uptrend).
5. Position Sizing: The strategy uses a percentage of equity for position sizing, defaulting to 100% of available equity per trade. This should be tailored to each persons unique approach. Responsible trading would use less than 5% for each trade. The starting capital used is a responsible and conservative $1000, reflecting the average trader.
This strategy aims to provide a smooth, trend-following approach that may be particularly useful in markets with clear, sustained trends. However, it may lag in choppy or ranging markets due to its heavy smoothing. As with any strategy, it's important to thoroughly back test and forward test before using it with real capital, and to consider using it in conjunction with other analysis tools and risk management techniques.
Other smoothed Heiken Ashi indicators do not provide buy and sell signals, and only show the change in color to dictate a change in trend. By adding buy and sell signals after the close of the changing candle, alerts can be programmed, which helps this be a more hands off protocol to experiment with. Other smoothed Heiken Ashi indicators do not allow for alarms to be set.
This is a unique HODL strategy which helps identify a change in trend, without the noise of day to day volatility. By switching to a line chart, it removes the candles altogether to avoid even more noise. The goal is to HODL a coin while the color is bullish in an uptrend, but once the indicator gives a sell signal, to sell the holdings back to a stable coin and let the chart ride down. Once the chart gives the next buy signal, use that same capital to buy back into the asset. In essence this removes potential losses, and helps buy back in cheaper, gaining more quantitity fo the asset, and therefore reducing your average initial buy in price.
Most HODL strategies ride the price up, miss selling at the top, then riding the price back down in anticipation that it will go back up to sell. This strategy will not hit the absolute tops, but it will greatly reduce potential losses.

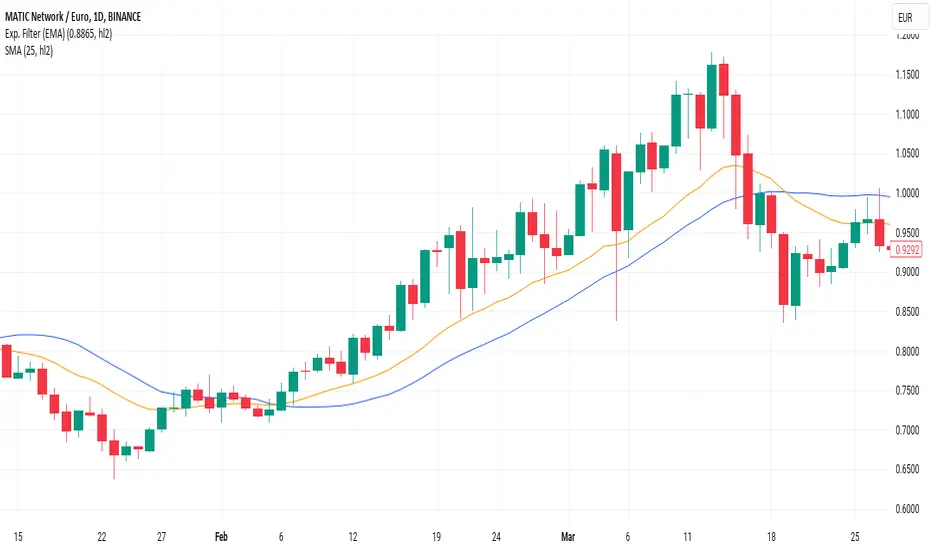
Exponential Smoothing FilterThe digital exponential filter, in finance known as Exponential Moving Average (EMA) , can be used as a technical indicator for chart analysis to visualize uptrends and downtrends in the market. Unlike the classic simple moving average, the EMA requires only two values for its calculation: the last calculated exponential average price and the current price. This is a simple and fast calculation - even for wide smoothing windows. For further details and the math please refer to the "exponential smoothing" article on Wikipedia.
Here are some additional key points about the exponential moving average:
The EMA can react more quickly to price changes because it can give more weight to current prices - depending on your parameter settings.
Short-term, disruptive price fluctuations are smoothed out well, making prevailing trends more visible.
Despite good smoothing properties, it delays the input values slightly, so it can follow sudden trend changes well.
The EMA is well suited to dynamic markets and trading strategies.
The filter is a good basis for further processing such as gradient analysis.
How to use
When you add the script to your charts, you'll immediately see a thin orange line across your time series, smoothing out price fluctuations.
There are only two parameters to set
smoothing factor between 0.0000 = no smoothing and 0.9999 = strong smoothing
input source : open, high, low, close hl2, etc.
Chart output
In the example chart above, you can see that the orange line follows the highs and lows better than the blue line , which is a simple moving average (SMA).
Additionally, the orange line has a shorter lag, or reacts faster when the trend of the original price data suddenly changes. These characteristics are critical for buying and selling decisions: quickly reacting and tracking highs and lows while providing a smooth line that filters out distracting noise.
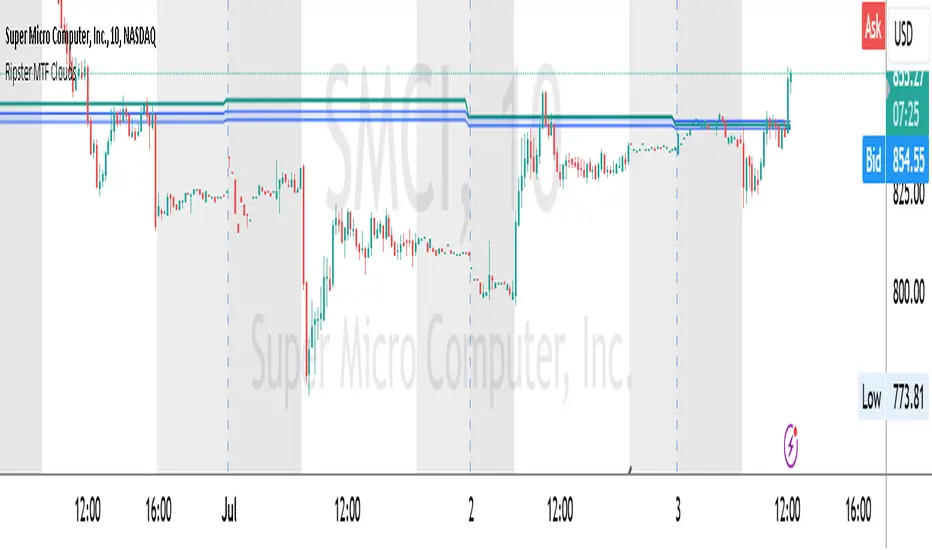
Ripster MTF CloudsDescription:
MTF EMA Cloud By Ripster
EMA Cloud System is a Trading System Invented by Ripster where areas are shaded between two desired EMAs. The concept implies the EMA cloud area serves as support or resistance for Intraday & Swing Trading. This can be utilized effectively on 10 Min for day trading and 1Hr/Daily for Swings. Ripster himself utilizes various combinations of the 5-12, 34-50, 8-9, 20-21 EMA clouds but the possibilities are endless to find what works best for you.
“Ideally, 5-12 or 5-13 EMA cloud acts as a fluid trendline for day trades. 8-9 EMA Clouds can be used as pullback Levels –(optional). Additionally, a high level price over or under 34-50 EMA clouds confirms either bullish or bearish bias on the price action for any timeframe” – Ripster
This indicator is an extension of the Ripster EMA Clouds. It allows you to visualize Exponential Moving Average (EMA) clouds from any time frame on your current chart, regardless of the chart's own time frame. This functionality is especially useful for traders who want to monitor higher time frame trends and support/resistance levels while trading on lower time frames.
What does this code do?
The Ripster MTF Clouds indicator displays two sets of EMA clouds. Each set consists of a short EMA and a long EMA. By default, the indicator uses Daily 20/21 and 50/55 EMAs, but you can customize these settings to fit your trading strategy. The EMAs are plotted on your chart along with their corresponding clouds, colored for easy differentiation:
EMA 1 (default 50/55): Plotted in blue.
EMA 2 (default 20/21): Plotted in teal.
The indicator uses the security function to fetch EMA values from higher time frames and plots them on your current chart, allowing you to see how these higher time frame EMAs interact with your current time frame's price action.
How to use this indicator:
Adjust Resolution:
Set the "Resolution" input to the time frame from which you want to fetch EMA values. For example, set it to "1H" if you want to see 1-hour EMAs on your current chart.
Customize EMAs:
Modify the "EMA 1 Short Length" and "EMA 1 Long Length" inputs to change the default 50/55 EMAs.
Adjust the "EMA 2 Short Length" and "EMA 2 Long Length" inputs to change the default 20/21 EMAs.
Monitor Clouds:
The indicator fills the area between the short and long EMAs, creating a cloud that helps visualize the trend. A blue cloud indicates the area between the EMA 1 pair, while a teal cloud indicates the area between the EMA 2 pair.
Use Multiple Instances:
You can add multiple instances of this indicator to your chart to monitor multiple higher time frames simultaneously. For instance, one instance can show daily clouds while another shows hourly clouds.
Integration with Trading Strategy:
Use this indicator to identify higher time frame trends and support/resistance levels, which can help improve your trading decisions on lower time frames.
For example, you can go long when the stock is above the 50-55 EMA clouds and 20-21 EMA clouds with daily resolution on a 10-minute chart and short when it is below it.
Similarly, you can short a stock under the 1-hour 34/50 EMA clouds while still trading on a 10-minute chart.
Keltner Channel+EMA with Buy/Sell SignalsIndicator Name: Double Keltner Channel with EMA (Buy/Sell Signals)
Description:
This indicator is designed to help traders identify potential trend reversals and generate buy/sell signals in volatile markets. It combines two Keltner Channels with different sensitivities (multipliers of 2.6 and 3.8) to visualize dynamic support and resistance levels. The addition of a 20-period EMA helps confirm trend direction and filter out potential false signals.
How the Indicator Works:
• Keltner Channels: These bands dynamically adjust to changing market volatility, offering a visual representation of potential price ranges. The 2.6 multiplier Keltner Channel (KC) is more sensitive to price changes, potentially highlighting short-term reversals, while the 3.8 multiplier KC focuses on broader trend shifts.
• 20-period EMA: This widely used trend indicator helps smooth out price fluctuations and identify the underlying direction of the market.
• Buy Signals: Generated when a candle's low touches or crosses below either Keltner Channel's lower band, and within the next 6 candles, that same candle closes above the 20 EMA. This combination suggests a potential rejection of lower prices (support) and a possible resumption of the uptrend.
• Sell Signals: Mirror the buy signal logic but are triggered when the candle's high touches or crosses above either Keltner Channel's upper band and then closes below the 20 EMA within the next 6 candles. This indicates a potential rejection of higher prices (resistance) and a possible shift to a downtrend.
How to Use the Indicator:
1. Identify the Trend: Use the 20 EMA to determine the overall trend direction. Look for buy signals primarily in uptrends and sell signals in downtrends.
2. Confirm with RSI : While not included in this indicator, consider using a separate Relative Strength Index (RSI) with a length of 10, SMA type, MA length of 14, and standard deviation of 2. Look for oversold conditions (RSI below 20) to confirm buy signals and overbought conditions (RSI above 80) to confirm sell signals.
3.Apply Risk Management: Always use appropriate risk management techniques, such as stop-loss orders, to protect your capital.
Key Points:
• This indicator is most effective in trending markets.
• It is not a standalone trading system and should be used in conjunction with other analysis tools and confirmation.
• The Keltner Channel multiplier values can be adjusted to suit your trading style and risk tolerance.
Important Disclaimer:
This indicator is a modification of the original Keltner Channel code and is intended for educational and informational purposes only.
It does not constitute financial advice. Always conduct your own research and consult with a qualified financial advisor before making any investment decisions.

2 MA Cross Cvg Dvg Slope Overview
This indicator combines the Moving Average Convergence Divergence (MACD) and two Moving Averages (MAs) to assess market momentum and trend direction. It aims to provide insights into the strength and direction of price movements by analyzing the MACD line, MAs slopes, and MA crossovers. Instead of eyeballing the exact MA crossovers and MAs slope steepness on the chart and MACD line changes on separate panes, this indicator pixelate the overloaded information or multiple indicators interpretation into a KISS "boolean" decision making.
Key Components
MACD Line
This line represents the difference between the fast MA and slow MA. It reflects short-term price momentum relative to the long-term trend.
Moving Averages (MAs)
Two types of MAs are utilized in this indicator:
Fast MA (short-term): Often a 9-period MA or similar, which reacts quickly to price changes.
Slow MA (long-term): Typically a 21-period MA or similar, which smooths out price fluctuations and identifies the longer-term trend.
Indicator Logic
MA Crossover: The crossover of the fast MA above the slow MA suggests a bullish trend, while a crossover below indicates a bearish trend.
MA Slope Analysis: The indicator also considers the slopes of both the fast and slow MAs to determine the direction:
Both MA Positive Slope: Indicates upward momentum or bullish trend.
Both MA Negative Slope: Indicates downward momentum or bearish trend.
One MA Positive Slope, the other Negative Slope: Indicates indecision.
MACD Line: MACD Line consecutively increase means increasing positive momentum, vice versa.
Interpretation
Uptrend: When fast MA cross over slow MA. Indicator show "+" symbol at top zone with value 0.5.
Additional Uptrend Confirmation: When both MAs have positive slope. Indicator show only green bar.
Uptrend Upward Momentum: MACD Line increase when fast MA above slow MA. Indicator show "." symbol value 0.75.
Uptrend Downward Momentum: MACD Line decrease when fast MA above slow MA. Indicator show "." symbol value 0.25.
Indecision: When one of the MA has positive slope, but another MA has negative slope. Indicator showing both red and green bar.
Downtrend: When fast MA cross under slow MA. Indicator show "+" symbol at bottom zone with value 0.5.
Additional Downtrend Confirmation: When both MAs have negative slope. Indicator show only red bar.
Downtrend Upward Momentum: MACD Line increase when fast MA below slow MA. Indicator show "." symbol value -0.25.
Uptrend Downward Momentum: MACD Line decrease when fast MA below slow MA. Indicator show "." symbol value -0.75.
Combination of above multiple interpretation can further derive different signal for Trend Starts, Trend Continuous, and Trend Reversals.
Usage
This indicator is valuable for traders seeking to:
Identify entry and exit points based on single or multiple combination of MAs and MACD Line signals.
Confirm trend direction using MAs cross over or cross under spotted easily with the "+" symbol above 0 or below 0.
Double confirm the trend based on two MAs align slope direction.
Understand momentum shifts and potential trend reversals with an easy 4 different dots at -0.75, -0.25, 0.25, and 0.75.
Conclusion
By combining MACD Line analysis with Moving Average slopes and crossovers, this indicator offers a comprehensive approach to assessing market momentum and trend direction. It provides clear signals for traders to make informed decisions on when to enter or exit positions, enhancing overall trading strategy effectiveness without the need of referring to multiple chart or zoom in and out of the price chart to identify the crossover and slope direction.

Scalping System by Machine# Custom Trading System Indicator
This Pine Script indicator is designed to identify potential trading setups based on a specific set of rules. It's intended for use on lower timeframes (M1-M5) in the forex market, particularly during the New York-London overlap period.
## Key Features
1. **EMA Condition**: Uses a 20-period Exponential Moving Average (EMA) to determine trend direction.
2. **Candle Analysis**: Identifies strong bars and candle color changes.
3. **Volume Confirmation**: Checks for increasing volume.
4. **Volatility Filter**: Utilizes the Average True Range (ATR) to gauge market volatility.
5. **Time-based Filter**: Highlights the New York-London overlap period.
6. **Visual Aids**: Plots potential entry points, stop losses, and take profit levels.
## Trading Rules
1. **Buy Signal**:
- Price is above the 20 EMA
- Candle color changes from red to green
- Current candle is a strong bar (closing within 75% of its range)
- Volume is higher than the previous bar
- ATR(14) is above 4 pips OR it's during the NY-London overlap
2. **Sell Signal**:
- Price is below the 20 EMA
- Candle color changes from green to red
- Current candle is a strong bar (closing within 75% of its range)
- Volume is higher than the previous bar
- ATR(14) is above 4 pips OR it's during the NY-London overlap
3. **Stop Loss**: Placed near the low of the setup candle for buys, or near the high for sells.
4. **Take Profit**: Aimed at 1R (one times the range of the setup candle).
## Visual Elements
- **20 EMA**: Plotted as a blue line on the chart.
- **Buy Signals**: Green triangles below the candles.
- **Sell Signals**: Red triangles above the candles.
- **Stop Loss Levels**: Small red dots at the calculated stop loss prices.
- **Take Profit Levels**: Small green dots at the calculated take profit prices.
- **Information Table**: Displays current values for ATR, strong bar condition and volume condition.
## Usage Notes
1. This indicator is designed for manual trading, not automated execution.
2. It works best when combined with analysis of major trend lines, support, and resistance levels.
3. Exercise caution with very large setup candles.
4. Consider additional filters or money management rules for enhanced performance.
5. For higher timeframe bias validation, consider incorporating a 100-period break of structure (BOS) analysis.
## Customization
The indicator includes several input parameters that can be adjusted:
- EMA Length
- ATR Length and Threshold
- Volume Multiplier
- Strong Bar Percentage
Users can also toggle the visibility of stop loss and take profit markers.
Remember, while this indicator can identify potential setups, it should be used in conjunction with other forms of analysis and risk management strategies. Always consider the overall market context and your personal risk tolerance when making trading decisions.

HTF Dynamic EMA Smoothing Indicator [CHE] with Kernel SelectionThe Dynamic EMA Smoothing Indicator with Kernel Selection is a powerful Pine Script indicator for TradingView designed to smooth moving averages and identify market trends more clearly. Here is a detailed description of its functionalities and settings:
Main Functions:
1. Time Period Display:
- Option to show or hide an info box displaying the current time period.
- Customizable info box: Users can adjust the size, position, and colors of the info box to suit their preferences.
2. Timeframe Type Selection:
- Auto Timeframe: Automatically calculates the best timeframe based on the current resolution.
- Multiplier: Allows using an alternate timeframe as a multiple of the current resolution.
- Manual Resolution: Users can manually set a specific timeframe.
3. Colors:
- Custom colors for various graphical elements, including EMA lines and signals.
4. Basic Settings:
- EMA and Signal Periods: Defines the periods for the exponential moving averages (EMA) and signal lines.
- Smoothing Length and Kernel Type: Allows selecting the smoothing length and the type of kernel used for weighting the EMAs.
- ATR Multiplier: Defines the multiplier for the ATR (Average True Range) to identify relevant price ranges.
5. EMA Calculations:
- The indicator calculates a weighted EMA using several methods like Linear, Exponential, Epanechnikov, Triangular, and Cosine kernels.
- Smoothing is achieved by adding and removing values in a float array that stores the EMA values.
6. Plotting EMA and Signal Lines:
- The indicator plots the smoothed EMA and signal lines on the chart. The line colors change according to the trend direction (green for uptrend, red for downtrend).
7. Trading Signals:
- Long Signals: An upward arrow is displayed when the smoothed EMA indicates an uptrend.
- Short Signals: A downward arrow is displayed when the smoothed EMA indicates a downtrend.
- Alert Conditions: Alerts are triggered when long or short signals are detected.
8. ATR Bands:
- The indicator shows upper and lower ATR bands to identify potential support and resistance zones.
9. Time Period Display on Chart:
- A table is used to display the selected time period on the chart when the corresponding option is enabled.
This indicator offers extensive customization and allows traders to conduct complex market analyses using smoothed EMAs and custom timeframes. The integration of various kernels for smoothing makes it a versatile tool adaptable to different trading strategies.

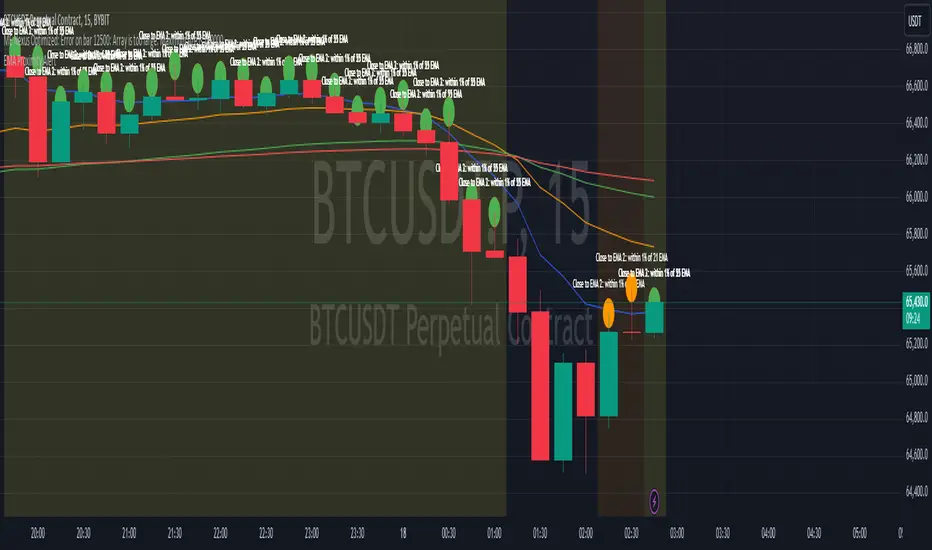
EMA Proximity AlertThe EMA Proximity Alert Indicator is designed to help traders identify when the price of an asset is close to a set of user-defined Exponential Moving Averages (EMAs). This indicator is particularly useful for those who use multiple EMAs as part of their trading strategy and want to receive alerts when the price approaches these key levels.
Features
Customizable EMAs:
The indicator supports four customizable EMAs with default periods of 9, 21, 55, and 100. Users can adjust the lengths of these EMAs according to their preferences.
Proximity Alerts:
Users can set a proximity percentage for each EMA individually. The indicator will generate an alert when the closing price is within the specified percentage of the EMA.
Visual Representation:
The EMAs are plotted on the chart with distinct colors:
EMA 1 (default 9) - Blue
EMA 2 (default 21) - Orange
EMA 3 (default 55) - Green
EMA 4 (default 100) - Red
Background Highlight:
The background of the chart will be highlighted in a semi-transparent color when the price is close to any of the monitored EMAs, making it easy to identify these areas at a glance.
Alert Conditions:
The indicator includes alert conditions that can be used to trigger notifications in TradingView. When the price is close to a monitored EMA, an alert is triggered with a message indicating which EMA is close.
Tooltip Symbols:
When the price is within the specified proximity to a monitored EMA, a small circular symbol is plotted above the bar. Hovering over this symbol displays a tooltip with information about the proximity, including the EMA length and the percentage.
Pivot Points with MID LevelsThis indicator shows the Standard Pivot Points level based on daily values that can act as support and resistance. It is used by a variety of traders around the world. You can select which time frame Pivot Point Levels you'd like. Daily, weekly etc... Perfect for swing trading or day trading.
Pivot Points- Shows 3 levels of resistance, the Pivot Point and 3 levels of support
(R3, R2, R1, PIVOT POINT, S1, S2, S3
MID Levels- The MID levels are 50% retracement from the pivot point level above it and below
Example- R3, MID, R2, MID, R1, MID, PIVOT POINT, MID, S1, MID, S2, MID, S3
With this indicator you will also have the option to show the Previous days High and Low that are also important levels. On gap up/down days it is always interesting to see if price will close the gap, hence the important level to note.
PDH= Previous Days High
PDL= Previous Days Low
I have added a feature that you can now select specific color to each level and the line style for each level to help understand which levels are being show by personal needs.
Happy Trading

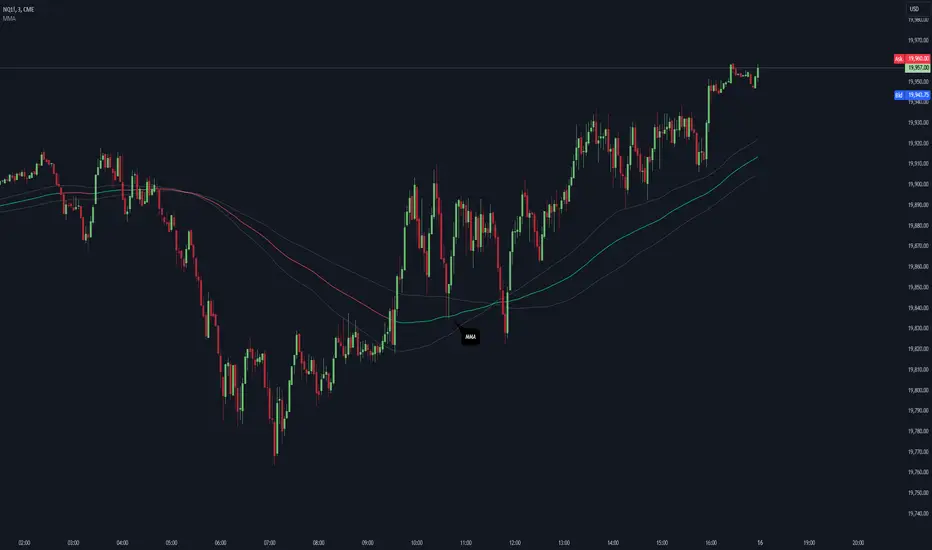
Median Moving Average @shrilssThe "Median Moving Average" (MMA) It allows users to select from two moving average lengths—short and long—and plots the median moving average, which is the midpoint between these two averages. Colored green for upward trends and red for downward trends, enhancing visual analysis.
Additionally, users can choose from a range of moving average types including Simple (SMA), Exponential (EMA), Weighted (WMA), Double Exponential (DEMA), Triple Exponential (TEMA), Hull (HMA), and Volume Weighted (VWMA).
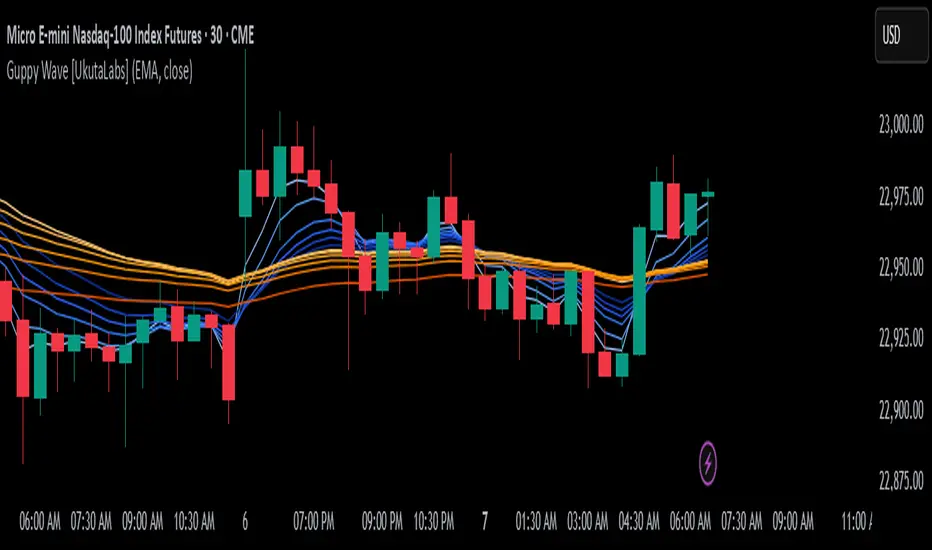
Guppy Wave [UkutaLabs]█ OVERVIEW
The Guppy Wave Indicator is a collection of Moving Averages that provide insight on current market strength. This is done by plotting a series of 12 Moving Averages and analysing where each one is positioned relative to the others.
In doing this, this script is able to identify short-term moves and give an idea of the current strength and direction of the market.
The aim of this script is to simplify the trading experience of users by automatically displaying a series of useful Moving Averages to provide insight into short-term market strength.
█ USAGE
The Guppy Wave is generated using a series of 12 total Moving Averages composed of 6 Small-Period Moving Averages and 6 Large Period Moving Averages. By measuring the position of each moving average relative to the others, this script provides unique insight into the current strength of the market.
Rather than simply plotting 12 Moving Averages, a color gradient is instead drawn between the Moving Averages to make it easier to visualise the distribution of the Guppy Wave. The color of this gradient changes depending on whether the Small-Period Averages are above or below the Large-Period Averages, allowing traders to see current short-term market strength at a glance.
When the gradient fans out, this indicates a rapid short-term move. When the gradient is thin, this indicates that there is no dominant power in the market.
█ SETTINGS
• Moving Average Type: Determines the type of Moving Average that get plotted (EMA, SMA, WMA, VWMA, HMA, RMA)
• Moving Average Source: Determines the source price used to calculate Moving Averages (open, high, low, close, hl2, hlc3, ohlc4, hlcc4)
• Bearish Color: Determines the color of the gradient when Small-Period MAs are above Large-Period MAs.
• Bullish Color: Determines the color of the gradient when Small-Period MAs are below Large-Period MAs.
Fibonacci Moving Averages [UkutaLabs]█ OVERVIEW
The Fibonacci Moving Averages are a toolkit which allows the user to configure different types of Moving Averages based on key Fibonacci numbers.
Moving Averages are used to visualise short-term and long-term support and resistance which can be used as a signal where price might continue or retrace. Moving Averages serve as a simple yet powerful tool that can help traders in their decision-making and help foster a sense of where the price might be moving next.
The aim of this script is to simplify the trading experience of users by automatically displaying a series of useful Moving Averages, allowing the user to easily configure multiple at once depending on their trading style.
█ USAGE
This script will automatically plot 5 Moving Averages, each with a period of a key Fibonacci Level (5, 8, 13, 21 and 34).
Both the Source and Type of the Moving Averages can be configured by the user (see all options below under SETTINGS), making this a versatile trading tool that can provide value in a wide variety of trading styles.
█ SETTINGS
Configuration
• MA Source: Determines the source of the Moving Averages (open, high, low, close, hl2, hlc3, ohlc4, hlcc4)
• MA Source: Determines the type of the Moving Averages (SMA, EMA, VWMA, WMA, HMA, RMA)
Colors
• 5: Determines the color of the 5 period Moving Average
• 8: Determines the color of the 8 period Moving Average
• 13: Determines the color of the 13 period Moving Average
• 21: Determines the color of the 21 period Moving Average
• 34: Determines the color of the 34 period Moving Average

Supertrend + BB + Consecutive Candles + QQE + EMA [Pineify]Overview
This indicator, developed by Pineify, is a comprehensive tool designed to assist traders in making informed decisions by combining multiple technical analysis methods. It integrates Supertrend, Bollinger Bands (BB), Consecutive Candles, Quantitative Qualitative Estimation (QQE), and Exponential Moving Averages (EMA) into a single, cohesive script. This multi-faceted approach allows traders to analyze market trends, volatility, and potential buy/sell signals with greater accuracy.
Key Features
1. Supertrend: Utilizes the Supertrend indicator to identify the prevailing market trend. It provides clear buy and sell signals based on the direction of the trend.
2. Bollinger Bands (BB): Measures market volatility and identifies overbought or oversold conditions. The script calculates the middle, upper, and lower bands, along with the Bollinger Band Width (BBW) and Bollinger Band %B (BBR).
3. Consecutive Candles: Detects sequences of consecutive bullish or bearish candles, providing signals when a specified number of consecutive candles are detected.
4. Quantitative Qualitative Estimation (QQE): Combines the Relative Strength Index (RSI) with a smoothing factor to generate buy and sell signals based on the QQE methodology.
5. Exponential Moving Averages (EMA): Includes both fast and slow EMAs to identify potential crossovers, which are used as buy and sell signals.
How It Works
- Supertrend: The Supertrend indicator is calculated using a factor and ATR length. It plots the trend direction and generates buy/sell signals when the trend changes.
- Bollinger Bands: The BB indicator calculates the middle band as a Simple Moving Average (SMA) of the closing prices. The upper and lower bands are derived by adding and subtracting a multiple of the standard deviation from the middle band.
- Consecutive Candles: This feature counts the number of consecutive candles that close higher or lower than the previous candle. When the count reaches a specified threshold, it generates a buy or sell signal.
- QQE: The QQE indicator smooths the RSI values and calculates the QQE Fast and QQE Slow lines. Buy and sell signals are generated based on the crossover of these lines.
- EMA: The script calculates fast and slow EMAs and generates buy/sell signals based on their crossovers.
How to Use
1. Inputs: Customize the indicator settings through the input parameters:
- Supertrend Factor and ATR Length
- BB Length
- Consecutive Candles Counting
- QQE RSI Length
- Fast and Slow EMA Lengths
- Enable/Disable Alerts for various signals
2. Alerts: Set up alerts for Supertrend, Consecutive Candles, and EMA crossovers. Alerts can be enabled or disabled based on user preference.
3. Visualization: The indicator plots the Supertrend, Bollinger Bands, and EMA lines on the chart. It also marks buy and sell signals with arrows and labels for easy identification.
Concepts Underlying Calculations
- Supertrend: Based on the Average True Range (ATR) to determine the trend direction and potential reversal points.
- Bollinger Bands: Utilizes standard deviation to measure market volatility and identify overbought/oversold conditions.
- Consecutive Candles: A method to detect momentum by counting consecutive bullish or bearish candles.
- QQE: Enhances the traditional RSI by smoothing it and using a dynamic threshold to generate signals.
- EMA: A widely used moving average that gives more weight to recent prices, making it responsive to market changes.
This indicator is a powerful tool for traders looking to combine multiple technical analysis methods into a single, easy-to-use script. By integrating these diverse techniques, it provides a comprehensive view of market conditions and potential trading opportunities.

Quaterly Earnings,Sectors/Industry,Moving AveragesDescription:
The EPS & Revenue indicator is designed to provide detailed financial insights into a company's performance by displaying key financial metrics such as Earnings Per Share (EPS), Total Revenue, Free Float, Operating Income, and Return on Equity (ROE). The indicator also calculates and visualizes the percentage changes in these metrics over different quarters, offering a comprehensive view of the company's financial health.
Features:
Table Display:
A customizable table that can be positioned in various locations on the chart (e.g., top left, top center, bottom right, etc.).
Color-coded cells to indicate positive and negative changes in financial metrics.
Dynamic text size and color for better readability.
Financial Metrics:
EPS (Earnings Per Share): Displays the EPS values for the current and previous quarters.
Total Revenue: Shows revenue values in crores (Cr) for multiple quarters.
Free Float: Represents the number of freely floating shares.
Operating Income (OP): Indicates the operating income for the company.
Return on Equity (ROE): Displays the ROE values for multiple quarters.
Calculations:
EPS Year-over-Year (YoY) Change: Calculates the YoY percentage change in EPS.
Quarter-over-Quarter (QoQ) Change: Computes the percentage change in EPS and sales for different quarters.
Sales in Crores: Displays sales values in crores (Cr) and calculates the QoQ changes.
Operating Profit Margin (OPM): Calculates the operating profit margin as a percentage of sales.
52-Week High/Low: Shows the highest and lowest prices over the past 52 weeks.
Average Daily Range (ADR): Computes the average daily range percentage.
Turnover: Displays the average turnover period and current turnover values.
Relative Volume (Rvol): Indicates the relative trading volume compared to the average.
Color Coding:
Uses different colors to highlight significant changes in metrics (e.g., dark green for strong positive changes, light green for moderate positive changes, red for negative changes).
Adjustable transparency based on the magnitude of the change.
Customization:
User inputs for table position, color settings, and calculation periods for turnover and relative volume.
Text labels for various columns and rows in the table to enhance clarity.
How to Use:
Add the EPS & Revenue indicator to your TradingView chart.
Customize the table position and color settings as per your preference.
Analyze the displayed financial metrics and percentage changes to gain insights into the company's performance.
Use the color-coded cells to quickly identify significant changes and trends in EPS, revenue, operating income, and other key metrics.
Example Output:
The table will display current and past EPS values, percentage changes in EPS and sales, operating profit margins, ROE values, turnover, relative volume, and the percentage up from 52-week low and down from 52-week high.
The data will be color-coded to indicate positive and negative changes, making it easier to interpret the company's financial performance at a glance.
This indicator is ideal for investors and traders who want to keep a close eye on a company's financial health and make informed decisions based on detailed financial data.

Multi-Frame Market Sentiment DashboardOverview
This Pine Script™ code generates a "Market Sentiment Dashboard" on TradingView, providing a visual summary of market sentiment across multiple timeframes. This tool aids traders in making informed decisions by displaying real-time sentiment analysis based on Exponential Moving Averages (EMA).
Key Features
Panel Positioning:
Custom Placement: Traders can position the dashboard at the top, middle, or bottom of the chart and align it to the left, center, or right, ensuring optimal integration with other chart elements.
Customizable Colors:
Sentiment Colors: Users can define colors for bullish, bearish, and neutral market conditions, enhancing the dashboard's readability.
Text Color: Customizable text color ensures clarity against various background colors.
Label Size:
Scalable Labels: Adjustable label sizes (from very small to very large) ensure readability across different screen sizes and resolutions.
Market Sentiment Calculation:
EMA-Based Sentiment: The dashboard calculates sentiment using a 9-period EMA. If the EMA is higher than two bars ago, the sentiment is bullish; if lower, it's bearish; otherwise, it's neutral.
Multiple Timeframes: Sentiment is calculated for several timeframes: 1 minute, 3 minutes, 5 minutes, 15 minutes, 30 minutes, 1 hour, 4 hours, and 1 day. This broad analysis provides a comprehensive view of market conditions.
Dynamic Table:
Structured Display: The dashboard uses a table to organize and display sentiment data clearly.
Real-Time Updates: The table updates in real-time, providing traders with up-to-date market information.
How It Works
EMA Calculation: The script requests EMA(9) values for each specified timeframe and compares the current EMA with the EMA from two bars ago to determine market sentiment.
Color Coding: Depending on the sentiment (Bullish, Bearish, or Neutral), the corresponding cell in the table is color-coded using predefined colors.
Table Display: The table displays the timeframe and corresponding sentiment, allowing traders to quickly assess market trends.
Benefits to Traders
Quick Assessment: Traders can quickly evaluate market sentiment across multiple timeframes without switching charts or manually calculating indicators.
Enhanced Visualization: The color-coded sentiment display makes it easy to identify trends at a glance.
Multi-Timeframe Analysis: Provides a broad view of short-term and long-term market trends, helping traders confirm trends and avoid false signals.
This dashboard enhances the overall trading experience by providing a comprehensive, customizable, and easy-to-read summary of market sentiment.
Usage Instructions
Add the Script to Your Chart: Apply the "Market Sentiment Dashboard" indicator to your TradingView chart.
Customize Settings: Adjust the panel position, colors, and label sizes to fit your preferences.
Interpret Sentiment: Use the color-coded table to quickly understand the market sentiment across different timeframes and make informed trading decisions.

Session MasterSession Master Indicator
Overview
The "Session Master" indicator is a unique tool designed to enhance trading decisions by providing visual cues and relevant information during the critical last 15 minutes of a trading session. It also integrates advanced trend analysis using the Average Directional Index (ADX) and Directional Movement Index (DI) to offer insights into market trends and potential entry/exit points.
Originality and Functionality
This script combines session timing, visual alerts, and trend analysis in a cohesive manner to give traders a comprehensive view of market behavior as the trading day concludes. Here’s a breakdown of its key features:
Last 15 Minutes Highlight : The script identifies the last 15 minutes of the trading session and highlights this period with a semi-transparent blue background, helping traders focus on end-of-day price movements.
Previous Session High and Low : The script dynamically plots the high and low of the previous trading session. These levels are crucial for identifying support and resistance and are highlighted with dashed lines and labeled for easy identification during the last 15 minutes of the current session.
Directional Movement and Trend Analysis : Using a combination of ADX and DI, the script calculates and plots trend strength and direction. A 21-period Exponential Moving Average (EMA) is plotted with color coding (green for bullish and red for bearish) based on the DI difference, offering clear visual cues about the market trend.
Technical Explanation
Last 15 Minutes Highlight:
The script checks the current time and compares it to the session’s last 15 minutes.
If within this period, the background color is changed to a semi-transparent blue to alert the trader.
Previous Session High and Low:
The script retrieves the high and low of the previous daily session.
During the last 15 minutes of the session, these levels are plotted as dashed lines and labeled appropriately.
ADX and DI Calculation:
The script calculates the True Range, Directional Movement (both positive and negative), and smoothes these values over a specified length (28 periods by default).
It then computes the Directional Indicators (DI+ and DI-) and the ADX to gauge trend strength.
The 21-period EMA is plotted with dynamic color changes based on the DI difference to indicate trend direction.
How to Use
Highlight Key Moments: Use the blue background highlight to concentrate on market movements in the critical last 15 minutes of the trading session.
Identify Key Levels: Pay attention to the plotted high and low of the previous session as they often act as significant support and resistance levels.
Assess Trend Strength: Use the ADX and DI values to understand the strength and direction of the market trend, aiding in making informed trading decisions.
EMA for Entry/Exit: Use the color-coded 21-period EMA for potential entry and exit signals based on the trend direction indicated by the DI.
Conclusion
The "Session Master" indicator is a powerful tool designed to help traders make informed decisions during the crucial end-of-session period. By combining session timing, previous session levels, and advanced trend analysis, it provides a comprehensive overview that is both informative and actionable. This script is particularly useful for intraday traders looking to optimize their strategies around session close times.

Exponential Moving Average with ADR bandIndicator: Exponential Moving Average with ADR Band
This TradingView script calculates and displays an Exponential Moving Average (EMA) along with an Average Daily Range (ADR) band around it. The indicator helps traders identify potential dynamic support and resistance levels adjusted for market volatility. Especially significant moves that originate from the ZONE and reach outside should be taken seriously.
Key Features:
EMA Calculation: The script computes the Exponential Moving Average (EMA) of the closing prices over a user-defined period.
ADR Band: It calculates the Average Daily Range (ADR) using a Simple Moving Average (SMA) of the daily high-low range over the same period.
Adjustable Parameters:
Length: The period for both the EMA and the ADR calculation, which can be set by the user (default is 20).
Multiple: A multiplier for the ADR to adjust the width of the bands around the EMA (default is 1).
Plotting: The EMA is plotted as an orange line. The upper and lower ADR bands are plotted around the EMA, and the area between these bands is filled with a translucent orange color to highlight the channel.
How It Works:
EMA Calculation: The script computes the EMA of the closing prices using the specified length.
ADR Calculation: The daily range (high-low) is averaged over the same length to get the ADR.
Band Creation: The upper band is created by adding the ADR (multiplied by the user-defined multiple) to the EMA. The lower band is created by subtracting the ADR (multiplied by the user-defined multiple) from the EMA.
Visualization: The EMA and ADR bands are plotted, and the area between the bands is filled to create a clear visual representation of the ADR channel.
Usage:
This indicator can be used to gauge market volatility and potential support/resistance zones.
The ADR band provides a dynamic range that adjusts with market conditions, helping traders identify potential breakout and reversal points.
To customize the indicator, adjust the 'Length' and 'ADR multiple' parameters to suit your trading style and the specific characteristics of the asset you are analyzing.

Long/Short EMA Premium [NL]1. EMA Calculation :
- The script calculates three Exponential Moving Averages (EMAs): EMA 1, EMA 2, and EMA 50.
- The lengths of EMA 1 and EMA 2 are customizable by the user inputs `ema1Length` and `ema2Length`, respectively.
- EMA 50 is fixed with a length of 50.
2. EMA Crossover Detection :
- The script detects crossovers between EMA 1 and EMA 2 using the `ta.crossover()` and `ta.crossunder()` functions, storing the crossover events in the `cross` variable.
3. Crossover Symbol :
- A triangle-up shape is plotted below the bars when there is a crossover between EMA 1 and EMA 2. This symbol visually indicates the crossover points.
4. Trade Signals :
- Long and short signals are generated based on the crossover events and the relationship between the closing price and EMA 1.
- For a long signal, EMA 1 must cross above EMA 2, and both the current and previous closing prices must be above EMA 1.
- For a short signal, EMA 1 must cross below EMA 2, and both the current and previous closing prices must be below EMA 1.
5. Stop Conditions :
- Stop conditions are used to exit long or short trades.
- If in a long trade, the script checks if the low of the previous candle crossed below EMA 1 and the high of the current candle is below EMA 1. If true, it triggers the "Stop Long" condition.
- If in a short trade, the script checks if the high of the previous candle crossed above EMA 1 and the low of the current candle is above EMA 1. If true, it triggers the "Stop Short" condition.
6. Plotting :
- The script plots EMA 1, EMA 2, and EMA 50 on the chart to visualize their movements.
7. Alerts :
- The script generates alerts for EMA crossovers, long and short signals, as well as stop long and stop short conditions, allowing traders to receive notifications when these events occur.
Overall, the script provides a comprehensive EMA crossover strategy with customizable parameters and clear trade signals and exit conditions.
