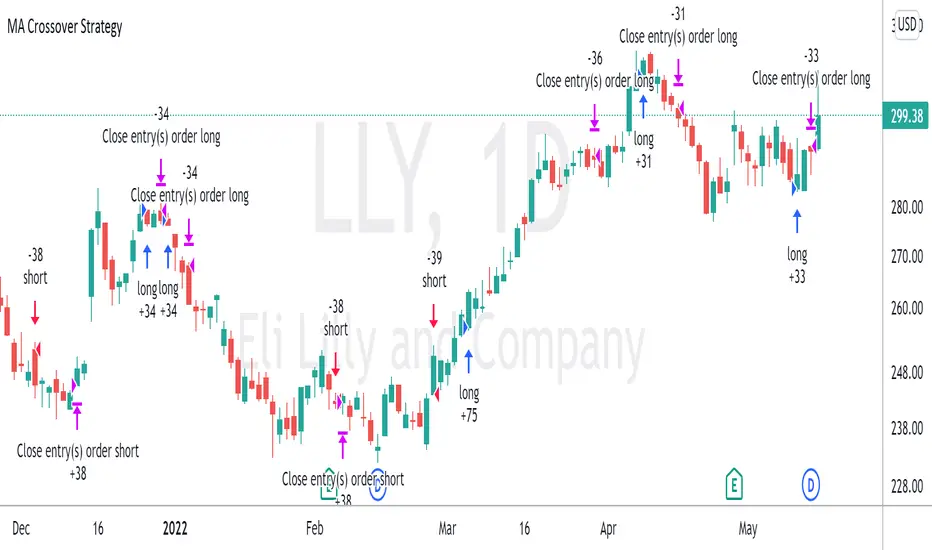
Moving Average Crossover StrategyThe Moving Average Crossover indicator uses 3 moving averages (2 simple moving averages and 1 exponential moving average ) to signal long and short opportunities based on moving average crossovers. This strategy serves as a backtest to that indicator. By taking entry and exit positions based on moving average crossovers, we are able to project profit with this script. You are given the option to select which moving average crossings trigger entry and exit signals. Fast refers to an EMA which should be your shortest MA. Slow refers to the first SMA which will serve as a signal line. Trend refers to a long SMA which will help determine if you should take long positions or short. You can also filter by extra conditions such as minimum volume or RSI. For example, you may have the script trigger a buy signal if the 5ema crosses the 20 sma while RSI reads 60 and sell if it crosses again.
This strategy starts with $100,000 and uses 10% of the account per trade.
Media mobile esponenziale (EMA)
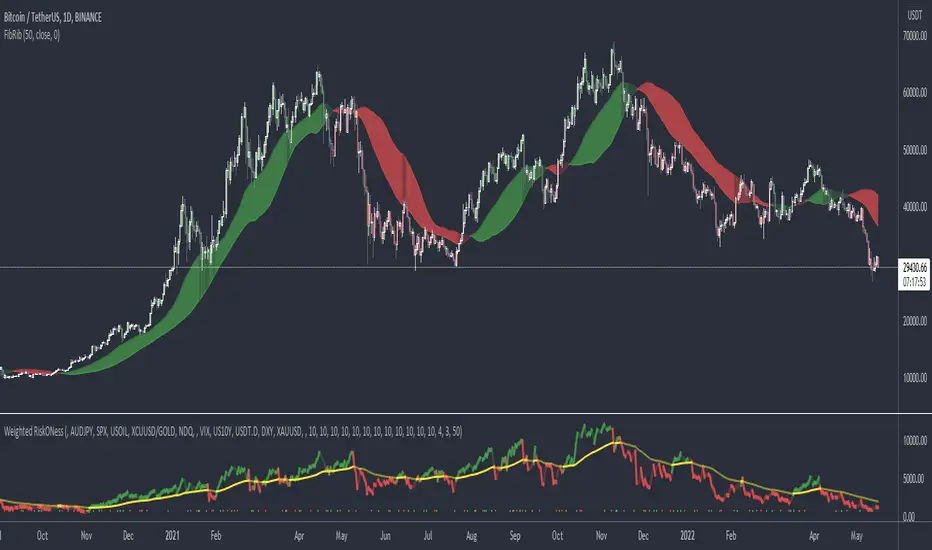
Fibonacci RibbonThe Fibonacci Ribbon (FibRib) creates two Fibonacci moving averages: essentially a Fibonacci WMA and a Fibonacci EMA.
The ribbon colors based on which is higher and where PA is relative to the ribbon.
Optional colored candles shades candles the same color as the ribbon.
OpenCipher AOpenCipher A is an open-source and free to use Overlay.
Features:
EMA Ribbons (Lengths: 5, 11, 15, 18, 21, 25, 29, 33)
Symbols ("Be careful" and "attention required" signals)
EMA Ribbons
The EMA RIbbons are a set of exponential moving averages. Blue and white ribbons = uptrend, gray ribbons = downtrend. The ribbons can act as support in uptrends and as resistance in downtrends.
Lengths and source of the ribbons are customizable.
Symbols
Green Dots: The green dot is a bullish symbol that appears whenever the EMA 11 crosses over EMA 33.
Red Cross: The red cross is a bearish symbol that appears whenever the EMA 5 crosses under EMA 11.
Blue Triangle: The blue triangle marks a possible trend reversal that appears whenever the EMA 5 crosses over EMA 25 while EMA 29 is below EMA 33.
Red Diamond: The red diamond is a bearish symbol that marks a potential local top whenever a bearish wavecross occurs (fast wave crosses under slow wave).
Yellow X: The yellow X is a warning signal that appears whenever a bearish wavecross occurs while the slow wave of the wavetrend is below -40 and the moneyflow is in the red (below zero).
Blood Diamond: The blood diamond is a bearish symbol that highlights whenever the red diamond and the red cross appear on the same candle.
Usage
Treat the symbols as signs that your attention might be required and don't trade based on them.

MACD Scalper AnalysisThis is a scalper analysis movement designed around MACD and 200 EMA
The rules are simple:
For long we check if the close of the candle is above the ema200 and we have a crossover between macd and signal
Once this happens we analyse the next candle, if its close higher than open , we can consider it a win and if its close lower than open we consider a lose.
For short we check if the close of the candle is below the ema200 and we have a crossunder between macd and signal
Once this happens we analyse the next candle, if its close higher than open , we can consider it a loss and if its close lower than open we consider a win.
Once we have all of this we analyse the average percentage movement and establish if the specific asset or timeframe is worthy for us.
At the same time it can give a good idea if we can go with a divergence strategy, like for example we have a short entry, but we will actually go long and viceversa.
If you have any questions let me know !


Bitcoin trend RVI and Emastrategy with two emas and rvi.
Only long positions when fast ema above slow ema when rvi gives entry.
Only short positions when slow ema above fast ema when rvi gives entry.

Dillon's Double VWAP StrategyThis is based on Dillon's double VWAP strategy.
I enters when the ADX is low (aka not a trending market) and it's not close to the VWAP reset. Check it out.

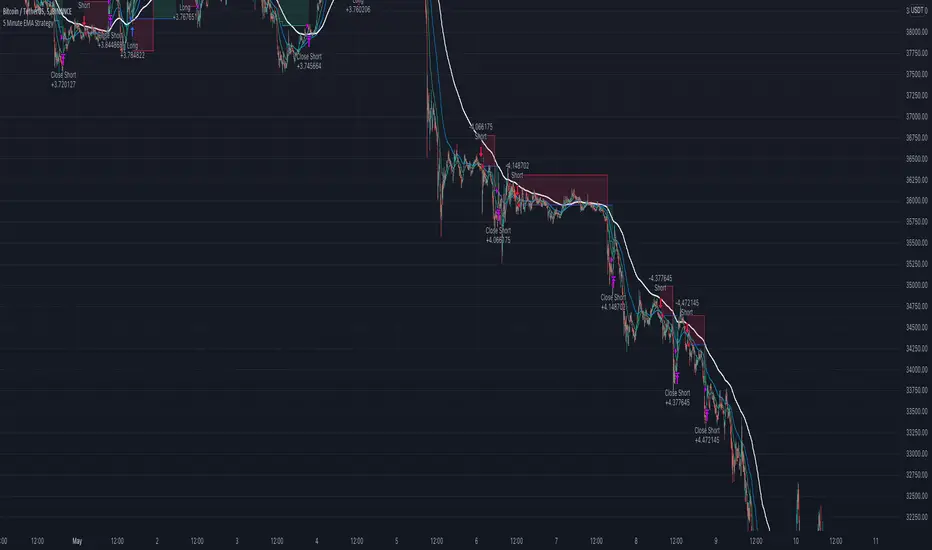
5 Minute EMA Cross StrategyThis simple Fast/Slow EMA cross strategy is designed to be used with Alertatron to place limit orders and use a trailing stop/take profit.
Features:
Indicators when the fast EMA crosses the slow EMA
Trailing Stop/Take Profit
Bar look back for placing limit order
Macro EMA filter to only trade with the macro trend
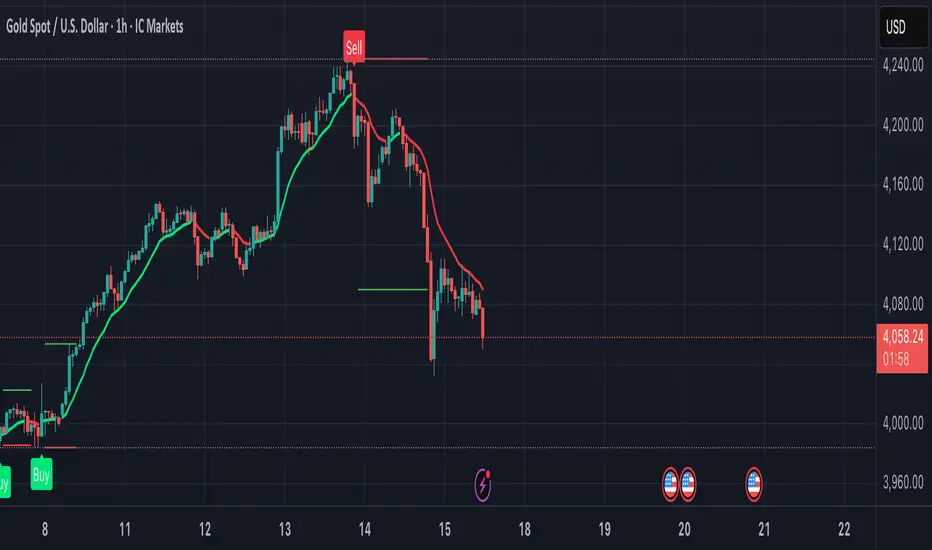
Big Snapper Alerts R3.0 + Chaiking Volatility condition + TP RSI//@version=5
//
// Bannos
// #NotTradingAdvice #DYOR
// Disclaimer.
// I AM NOT A FINANCIAL ADVISOR.
// THESE IDEAS ARE NOT ADVICE AND ARE FOR EDUCATION PURPOSES ONLY.
// ALWAYS DO YOUR OWN RESEARCH
//
// Author: Adaptation from JustUncleL Big Snapper by Bannos
// Date: May-2022
// Version: R1.0
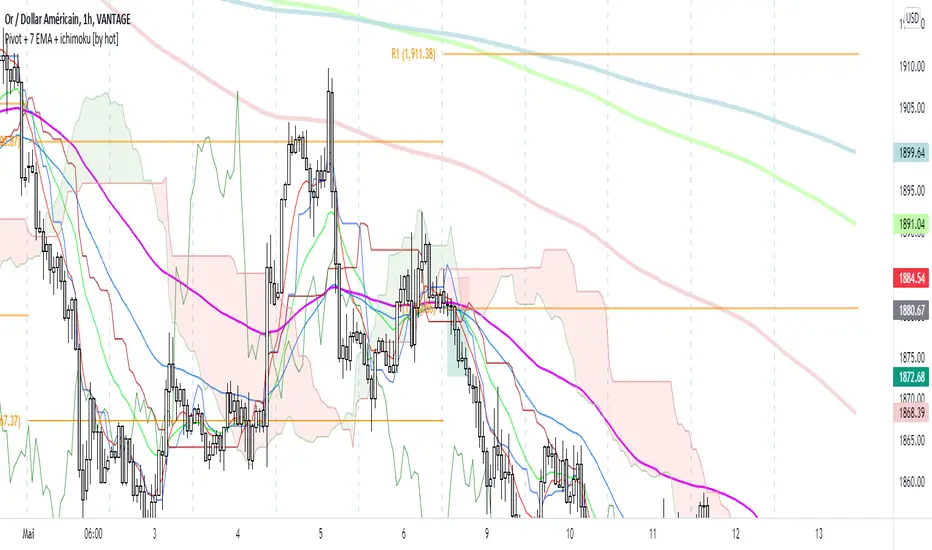
//Description of this addon - Script using several new conditions to give Long/short and SL levels which was not proposed in the Big Snapper strategy "Big Snapper Alerts R3.0"
//"
//This strategy is based on the use of the Big Snapper outputs from the JustUncleL script and the addition of several conditions to define filtered conditions selecting signal synchrones with a trend and a rise of the volatility.
//Also the strategy proposes to define proportional stop losses and dynamic Take profit using an RSI strategy.
// After delivering the temporary ong/short signal and ploting a green or purple signal, several conditions are defined to consider a Signal is Long or short.
//Let s take the long signal as example(this is the same process with the opposite values for a short).
//step 1 - Long Definition:
// Snapper long signal stored in the buffer variable Longbuffer to say that in a close future, we could have all conditions for a long
// Now we need some conditions to combine with it:
//the second one is to be over the Ma_medium(55)
//and because this is not selective enough, the third one is a Volatility indicator "Chaikin Volatility" indicator giving an indication about the volatility of the price compared to the 10 last values
// -> Using the volatility indicator gives the possibility to increase the potential rise if the volatility is higher compared to the last periods.
//With these 3 signals, we get a robust indication about a potential long signal which is then stored in the variable "Longe"
//Now we have a long signal and can give a long signal with its Stop Loss
// The Long Signal is automatically given as the 3 conditions above are satisfied.
// The Stop loss is a function of the last Candle sizes giving a stop below the 70% of the overall candle which can be assimilated to a Fibonacci level. Below this level it makes sense to stop the trade as the chance to recover the complete Candle is more than 60%
//Now we are in an open Long and can use all the mentioned Stop loss condition but still need a Take Profit condition
//The take profit condition is based on a RSI strategy consisting in taking profit as soon as the RSI come back from the overbought area (which is here defined as a rsi over 70) and reaching the 63.5 level to trigger the Take Profit
//This TP condition is only active when Long is active and when an entry value as been defined.
//Entry and SL level appreas as soon as a Long or short arrow signal does appears. The Take profit will be conidtioned to the RSI.
//The final step in the cycle is a reinitialization of all the values giving the possibility to detect and treat any long new signal coming from the Big Snapper signal.

Waddah Attar Explosion V3 [NHK] -Bollinger - MACDWaddah Attar Explosion Version3 indicator to work in Forex and Crypto, This indicator oscillates above and below zero and the Bollinger band is plotted over the MACD Histogram to take quick decisions, Colors are changed for enhanced look. dead zone is plotted in a background area and option is provided to hide dead zone. One can easily detect sideways market movement using Bollinger band and volume. when volume is in between Bollinger band no trades are to be taken as volume is low and market moving in sideways
credits to: @shayankm and @LazyBear
Read the main description below...
- - - - - - - - - - - - - - - - - - - - - - - - - - - - - - - - - - - - - - -
This is a port of a famous MT4 indicator. This indicator uses MACD /BB to track trend direction and strength. Author suggests using this indicator on 30mins.
Explanation from the indicator developer:
"Various components of the indicator are:
Dead Zone Line: Works as a filter for weak signals. Do not trade when the up or down histogram is in between Dead Zone.
Histograms:
- Pink histogram shows the current down trend.
- Blue histogram shows the current up trend.
- Sienna line / Bollinger Band shows the explosion in price up or down.
Signal for ENTER_BUY: All the following conditions must be met.
- Blue histogram is raising.
- Blue histogram above Explosion line.
- Explosion line raising.
- Both Blue histogram and Explosion line above DeadZone line.
Signal for EXIT_BUY: Exit when Blue histogram crosses below Explosion line / Bollinger Band.
Signal for ENTER_SELL: All the following conditions must be met.
- Pink histogram is raising.
- Pink histogram above Explosion line.
- Explosion line raising.
- Both Pink histogram and Explosion line above DeadZone line.
Signal for EXIT_SELL: Exit when Pink histogram crosses below Explosion line.
All of the parameters are configurable via options page. You may have to tune it for your instrument.

Solution Zigma - Fibonacci Impulse'Solution Zigma' is strategy for any securities because this strategy use EMA of Fibonacci Level and Plot Like candle easy for analysis trend impulse. This strategy used DMI(ADX) for filter sideway but not greatest indicator, Please use this strategy with Risk Management.
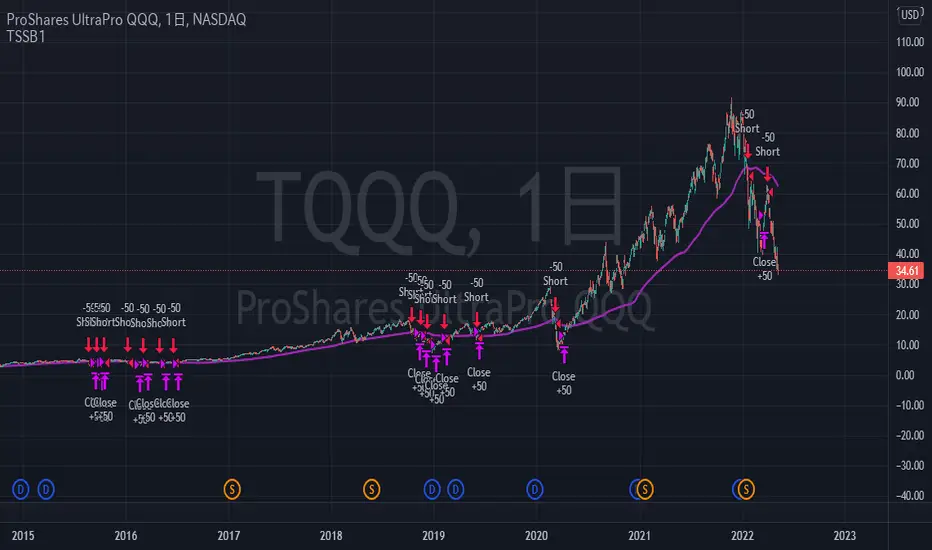
TriautoETF(TQQQ) Short Strategy B1○ Objective.
This is a strategy for the TQQQ NASDAQ:TQQQ short strategy in the TriAuto ETF .
It is used as a hedging short rather than for profit-making purposes.
Entry and close points are indicated.
○ Strategy
The strategy is to hold a short position when the price falls below the moving average line, which is a market-conscious line that is rarely broken.
The close (settlement) is determined by using the moving average.
The moving average is based on the market-conscious QQQ NASDAQ:QQQ .
This script is used on the daily chart of the TQQQ.
It works as a hedge for long positions because open interest is held even at the major bottoms of the China and Corona shocks.
The system is set up to quickly cut its losses even if the moving average is "tricked" into falling below the moving average.
Vegas+200+Big Vol by RSU1. Vegas channel
The Vegas channel indicator is very effective as a short, medium and long-term trend observation indicator, and it has obvious support and resistance functions.
2. EMA200+MA200
Usually ema200 or ma200 is used as a watershed for fund institutions to evaluate the long-short trend of a stock trend.
3. Big volume box
Big volume is often used as a signal of a market trend turning,if it is greater than 4 times standard deviation it is marked as a Big volume in yellow box. There will be support and resistance at this price range.

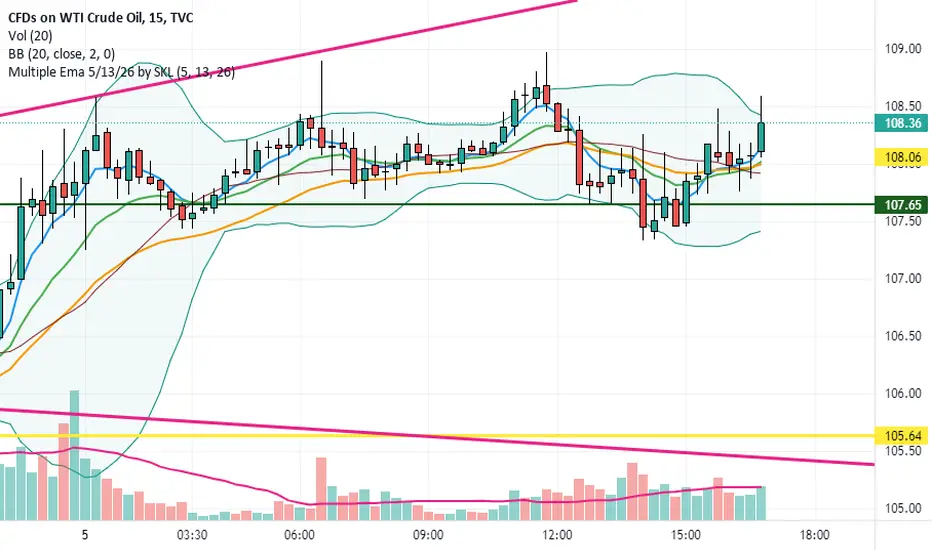
Scalping The Bull - Two EMA StrategyName: Scalping The Bull - Two EMA "Gianno-Nano" Strategy from the Meeting
Category: Trend Follower
Operating mode: Spot or Future, only long or swing trading
Trades duration: Multiday
Timeframe: 4H
Suggested usage: Mid-term trading, when the market is in trend and it is showing high volatility.
Entry: When fast EMA crosses over slow EMA.
Exit: When fast EMA crosses under slow EMA then Exit Long or Entry Short (for reversal strategy).
Usage:
⁃ It can be useful to use alerts or web-hooks to automate this strategy.
⁃ This is a raw system that can be improved in different ways (e.g. Stop-loss, take-profit, position sizing) or studying more the behaviour of the coin.
Configuration:
- N/A
Backtesting
⁃ Exchange: BINANCE
⁃ Pair: NEOUSDT
⁃ Timeframe: 4H
⁃ Fee 0.075%
⁃ Slippage 0
- Start : 2017-12-03
How you or we can improve? Source code is open so share your ideas!
