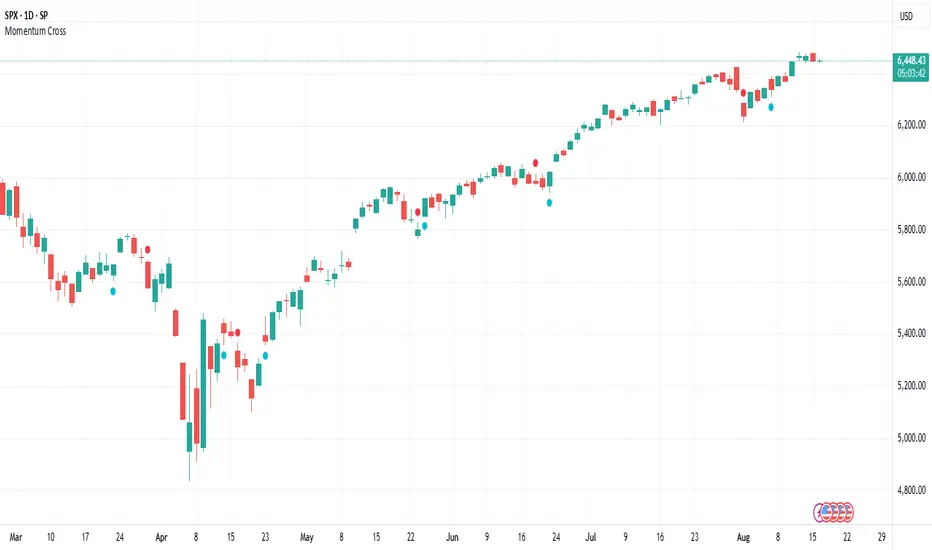
MFE & MAE ToolThis is a simple implementation of the MFE/MAE Tool for TradingView.
It's a quite powerful tool and pretty useful in systematic trading, but I don't see many trader using it these days.
It's created for EMA cross, but you can easily change it to use your own signals.
What is MAE/MFE Tool
MAE stands for Maximum Adverse Excursion - Worst P&L during the trade
MFE stands for Maximum Favorable Excursion - Best P&L during the trade
The idea is pretty simple. We take only signals without any position management or exits and measure the best/worst P&L for the next X bars after the signal was.
The primary use case for it is to understand how good your signals are .
If you'll add complicated money management tools, exits, and SL/PT to your strategy, it brings quite a lot of noise. After that, it's pretty tricky to understand if your signals bring much information about future price movements. In other words, bad money management can ruin good signals, and you might discard the entire strategy without knowing that. So this is why I think it's important to check the quality of your signals separately.
Another simple way to use it is to estimate where to put SL/PT
In this example, we're computing MAE/MFE in percent. We're plotting it both on the chart and computing some statistics based on it. This is why it's pretty easy to get a quick understanding of what is your SL/PT should be.
MAE/MFE tool consists of a:
Chart - it displays a point for every signal. Long/Short trades can have different colors. On hover you'll see details for this signal.
Table with stats - we're computing basic metrics for these Signals like average/min/median/max MAE/MFE, number of trades, and how many trades hit selected SL and PT. Stats are also separated by the side so you can see performance separately for longs and shorts.
The indicator is highly customizable, you can configure:
Bars you want to use to compute MAE/MFE
Side selection
SL and R:R
Styling of the chart
Position and style of the table
Parameters for the EMA
EMA cross and its parameter were selected randomly, so don't estimate to see a great performance here.
MFE/MAE tool is a pretty powerful concept. At some point, I'll create an entire article in my blog with more examples and descriptions.
Thanks to @MUQWISHI for helping code it.
Disclaimer
Please remember that past performance may not indicate future results.
Due to various factors, including changing market conditions, the strategy may no longer perform as well as in historical backtesting.
This post and the script don’t provide any financial advice.
Emacrossover
Dynamically Adjusting EMA Crossing
The Exponential Moving Average is the most commonly used indicator in every market. but no one can predict which pair of exponential moving average crossing will work best together. Every instrument require different EMAs crossing. It can be 2 EMA crossings or 3 EMA crossings.
Dynamically Adjusting EMA crossing tries to solve this issue. Algorithm finds the optimal EMA crossing setting for every instrument across all timeframes based on the EMA lengths provided in the settings. It evaluates the most profitable crossing combination for each instrument. The logic backtests the different combinations of EMA crossing based on the EMA lengths provided in the indicator's settings.
There are 3 EMA options in the settings Fact, Slow and Long. Indicator's Settings have the option to choose 2 EMA crossings or 3 EMA crossings.
Default Settings
Fast : 5 to 10
Slow : 13 to 19
Long : 20 to 60
Please do keep in mind that the performance of the indicator reduces as we increase the default settings range.
Please contact me for access
sohail Anjum EMA buy sellBased on Sohail anjum
Ema crossing teaching
Crossover alerts, only in trend 200 Ema (yellow line) make sure If the price is above the 200 EMA, you can prefer a long position and ignore short positions.
If the price is below the 200 EMA, you are allowed to open only short positions and avoid long positions.
Do not use this indicator alone, Use other recommended indicators by ShohailAnjum Rsi, Macd , chart pattren, etc
This indicator good win rate in 15m TF recommended 1H, 4H
Volume Price and FundamentalsVolume Price and Fundamentals indicators contains 4 exponential moving averages based upon Fibonnaci numbers as period (8, 21, 55 & 144) with crossovers and crossunders.
It also contain a table for volume and 50 Day Avg. Volume, Relative volume, Change in Volume, Volume Value, Up-Down Closing Basis days in last 50 days, Volume ratio (U/D Ratio) on last 50-day Up / Down days and along with fundamental analysis table with various Fundamental Analysis parameters and QoQ & YoY comparison basis for better investment decision making.
VWAP+SMA+EMAThis is the only indicator combing the results of VWAP + 2 SMAs + 2 EMAs.
This is a free indicator. Enjoy using it.
Kunal Jain
X48 - Strategy | MA Type Cross + TPSL | Future&Spot | V.2Thank You For Open Source Code, This Strategy Ref. By 1.Simple Strategy Like MA Crossover For Long/Short or Spot Trade, 2. CDC Action Zone V.2 for BarPaint
This Strategy Mixing With MA Crossover Strategy and BarPaint By CDC Action Zone and TP/SL by Varbara
### How To Use Strategy : Setting EMA/SMA Crossover EMA/SMA, Any Value If You Want
For Long Position : Cross Up
For Short Position : Cross Down
Can Use With Spot Trade : Cross Up = Buy, Cross Down = Sell
TP/SL When Your OrderSize Change From any % Of Your TP/SL Value
### In Strategy Setting
Intitial Capital = Ex. 200
Order Size = Should Be Money Management Not Use 100% of Capital Ex. 10% of Capital (200$) = Order Size 20$
StopLoss and Take Profit = If You Run Trend TF 4H+ or 1D+ You Can Change TP% = 1,000% for nonlimit and Stop Loss 5 - 20% from your order size
Ex. Stoploss 15% = OrderSize / 100 x %SL = 20$/100 x 15% = 3$ Loss from order size 20$ (if you not set stop loss.)
Base Currency = (Your Currency) # Ex. USD
Commission = (Your Trading Fee) # Ex. Future Fee Can Check At Binance Fee Rate > www.binance.com > Choose Your Fee Type, Ex. USD M Future (Regular User) = 0.02 (Maker), 0.04 (Taker)
Commission Symbol Type = % # (Ref. By Binance Fee Rate)
### Notice ####
Default Setting It's Realistic From Normal Life Ex. Capital 200$ / Ordersize 20$ (10%)/ Commission 0.1% (Buy+Sell) / Slippage = 2 / TP = 1000% (nonlimit) / SL = 15%/OrderSize
Low Risk But High Return, Good Luck
### Bot Auto Trade by X4815162342 ###
if you wanna try my bot auto trade X48-3in1-bot : Contact My Line ID : x4815x
Full Command Alert For This Strategy If You Wanna See It's
'{"ex":"'+markettype+'","side": "'+longcommand+'", "amount": "@{{strategy.order.contracts}}", "symbol": "{{ticker}}", "passphrase": "'+passphrase+'","leverage":"'+str.tostring(leveragex)+'"}'
'{"ex":"'+markettype+'","side": "'+shortcommand+'", "amount": "@{{strategy.order.contracts}}", "symbol": "{{ticker}}", "passphrase": "'+passphrase+'","leverage":"'+str.tostring(leveragex)+'"}'
But Easy Than Full Command Just Use Thisssssss !! Strategy Be Manage Auto Long and Short or TPSL Position
You Don't Do Anything Just Use This Message to Alerts Message
{{strategy.order.alert_message}}
### If you don't use bot but just looking for strategy test ####
Just Pass Bot Setting Function It's Nothing Effect For Strategy !!!!!!
Let's Enjoy With Your Strategy BackTest 😁
Remember Beware Max drawdown%. I'm Recommend Lower Than 10% It's Very Good.
ALMA/EMA/SRSI Strategy + IndicatorBack with another great high hit rate strategy!!
Disclaimer* This strategy was sampled using source code written by @ClassicScott , as referred to in the script, there is a clear line where the source code was scripted by myself.
This Strategy consists of three key factors, the ALMA, EMA crossover, and a Stochastic Rsi
ALMA: The Alma is the step line shown, turning green and red at select times. This average value gives general oversight of the macro movement of price action. and this particular one was coded by Mr.ClassicScott.
EMA crossover: At the input screen you are given an option of the fast and slow ema's. The default is solely for the hit rate and correlation to the Alma of this strategy. The arrows you see depicted on the chart are the crossover events happening.
Stochastic Rsi: The Stochastic Rsi is a stochastic value, using data sampled from the rsi. The use of this indicator in my strategy is to prevent entries when too overbought and oversold, as well as closures and vice versa, to prevent holding bags either way.
Fixed % TP: In the input screen you are given a take profit and stop loss percentage, for good R/R the hit rate will take a notch down, but with no R/R it will be near perfect.
How to use this:
Add it to your chart to get the strategy inputs. (The strategy is really only useful on a 15min TF. However the indicator within it can be used on anything at anytime!)
Watch the yellow and aqua moving averages, these are your ema's and crossover's will trigger signals based on your integer inputs.
Find Correlation between other leading indicators, as well as crossover's down/up and a red/green alma.
DO NOT use the arrows as buy/sell signals. These are simply to show ema's are crossing under or over. Momentum indicator's paired with this can be useful to determine if it could be a buy signal or sell signal.
Cheat Code's Notes:
Almost at 1000 boosts!!! I appreciate the support from everyone and I will keep trying my best to deliver quality strategies for the people.
-Cheat Code
BYBIT:BTCUSDT
EMA ON MA SETSOORY FOR MY EINGLISH
ITS NOT MY NATIVE AND IM NOT GOING TO GOOGLE TRANSLATE THIS
this is a beuaitful indicator that plot EMA that gat is calc from another ma and length for your choise so you will get an = 'ema on ma '
it can plot you more beautiful results and more smoothing results
i added golden/death cross for all ma
enjoy !
היי חברים זה בעצם אינדיקטור של ממוצע נע על ממוצע נע לנוחיכותכם
הפלט הראשי הוא EMA
הוא לוקח את החישוב שלו ממוצע אחר והאורך שתגדירו
נותן תוצאה יותר חלקה של ממוצעים נעים
הוספתי חתיוכים בין ההמוצעים
תהנו.
Rajiv Patel Strategy with ATR RSI CCI MACD EMA IchimokuRajiv Patel Strategy with alerts helps to identify entry and exit levels based on following Indicators.
1. ATR Trailing Stoploss
2. RSI
3. CCI
4. MACD
5. EMA
6. SMA
7. Ichimoku
This Strategy is fully customizable as per your trading style. Below are some examples of how once can use the Strategy.
Options Based on Each Indicator Individually.
1. ATR Trailing Stoploss – When price is above ATR Trailing Stoploss line its in buy zone and when below its in sell zone. The setting of ATR Trailing Stoploss are customizable like ATR Periods and ATR Multiplier. Suggest increasing ATR Multiplier with lower timeframe. Aggressive buyers can decrease ATR Period in higher timeframe as per trade plan.
2. RSI – RSI above EMA Length is buy zone and below is sell zone. Conservative buyers can increase the RSI & EMA Length period while aggressive and reduce. Higher the timeframe gives better results.
3. CCI – Similar to RSI the buy zone is when CCI crosses above EMA Length. Again CCI & EMA Length can be customised as per trade plan. Higher timeframe is advised.
4. MACD – MACD parameters default settings are based on trying to get early entry. One can change to 26, 13 and 9 in lower timeframe. When MACD crosses above Signal line its buy zone and when below its sell zone.
5. EMA – 5 EMA lines and 2 SMA lines can be plotted. The settings of both EMA lines and SMA lines can be adjusted based on timeframe and trade plan.
6. EMA – EMA line 1 and 2 can be used as buy when EMA1 crosses above EMA2 and sell when below. The length of EMA1 & 2 is adjustable. Suggest modifying based on timeframe and trade plan.
7. SMA – SMA1 can also be used as solo indicator. If price is below SMA1 then its no buy area and if above, then in buy area. SMA2 can be used to identify if trend is upward or downward based on user settings.
8. Ichimoku – It predicts price movements bit like moving averages. Offers a unique perspective of support and resistance levels.
Conversion Line (Tenkan Sen)
- Measures Short Term Trend
- Signals an area of minor support and resistance
Base Line (Kijun Sen)
- Measures Medium term trend
- Used as Trailing Stop Level
Lagging Span (Chikou Span)
- Used for confirmation of signals
- Can also serve as Support and Resistance Level
Kumo Cloud
- Formed of two lines: Senkou Span A (Green Line) and Senkou Span B (Red Line)
- Dynamic Support and Resistance
HOW TO READ ICHIMOKU INDICATOR
Conversion Line (Tenkan Sen)
- If Price is above the Conversion Line = Short term upward movement
- If Price is below the Conversion Line = Short term downward movement
- Increasing Conversion Line = Short term uptrend
- Decreasing Conversion Line = Short term downtrend
Base Line (Kijun Sen)
- If Price is above the baseline = Medium term uptrend
- If the Market price is below the baseline = Medium term downtrend
- Increasing Base Line = Medium term uptrend
- Decreasing Base Line = Medium term downtrend
Lagging Span
- The Evolution of the current price action in relation to previous price action
- If the Lagging span is above the current price = Bullish Bias
- If the Lagging span is below the current price = Bearish Bias
- Lagging span near the current price = Trading range
Kumo Cloud
- Dynamic Support and Resistance based upon price action.
- The longer the price stays below/above the Kumo cloud, stronger the trend
- When the cloud is wide, the expected support or resistance is strong
- When the cloud is thin, the expected support or resistance is weak
- Never trade when price is inside Kumo Cloud
HOW TO TRADE WITH ICHIMOKU CLOUD
1. Baseline and conversion Line crossover (Lagging Span as a Filter)
crossover (conversion line, baseline) = Buy
crossunder (conversion line, baseline) = Sell
FILTER
Crossover (conversion line, baseline) and lagging span is Bullish (i.e above the price) = Buy
Crossunder (conversion line, baseline) and lagging span is Bearish (i.e below the price) = Sell
2. Baseline - Conversion line crossover (Kumo cloud Filter)
Crossover (conversion line, baseline) above the Kumo Cloud = Strong Buy
Crossover (conversion line, baseline) below the Kumo cloud = Weak Buy
Crossunder (conversion line, baseline) below the Kumo Cloud = Strong Sell
Crossunder (conversion line, baseline) above the Kumo Cloud = Weak Sell
3. Kumo Cloud Breakout
When the price enters the Kumo Cloud, and breaks its Upper wall upward = Bullish Signal
When the price enters the Kumo Cloud, and breaks its Lower wall downward = Bearish Signal
4. Kumo Cloud Crossover
When Span A crosses the Span B from below to the upside and prices are positioned above the Kumo Cloud = Strong Buy Signal
When Span A crosses the Span B from upside to the bottom and the prices are positioned below the Kumo Cloud = Strong Sell
When Span A crosses Span B from bottom to the upside and prices are positioned below the Kumo Cloud = Weak Buy Signal
When Span A crosses Span B from the upside to the bottom and the prices are positioned above the Kumo Cloud = Weak Sell Signal
Options Based on Combining Multiple Indicators.
One can select and combine multiple conditions based on above understanding of individual indicator to create a strong Long Entry, Short Entry, Long Exit and Short Exit. This Strategy also provides Alert signal for all entry and exit based on the combinations of conditions selected.
Since this is a strategy one can use STRATEGY TESTER to understand how the strategy has performed over the selected time span. This however does not guarantee similar results in present or future trades.
Please enter commission or total charges charged by your broker in “Properties” Tab of the strategy. Modify all parameters of “Properties” Tab as needed. Note, this can affect the performance results of the strategy.
Need to be very careful in selecting conditions as it becomes very complex with many options available.
Note:
Triangles at the top and bottom indicates the zone. Can be turned on / off using condition “Show Conditions Visually”.
1. Red triangle at top pointing down with ‘S’ indicates in Long Exit zone.
2. Red triangle at top pointing down with ‘EnS’ indicates in Enter Short zone.
3. Green triangle at bottom pointing up with ‘B’ indicates in Long Entry zone.
4. Green triangle at bottom pointing up with ‘ExS’ indicates in Exit Short zone.
5. When the is no triangle either at top or bottom means there is no zone.
Send me your suggestions, will try to incorporate the same in next revision.
Diversified Investment EMA Cross Strategy SimulatorThis simulating indicator proves that even if you use a simple strategy, you can reduce your risk by diversifying your investments.
The strategy itself is simple.(only long)
Buy when 50 days EMA crosses over 200 days EMA.
Sell when 50 days EMA crosses under 200 days EMA.
Or, stop loss when the asset falls by 2% (eg).
Using this simple strategy on an asset is just a test of your luck.
However, this capital change graph shows that risk can be reduced by diversifying investment into eight assets rather than one asset.
Options
Total Assets Capital Change represents the sum of capital changes for 8 assets. The gray line is the initial capital.
Each Asset Capital Change represents all eight asset capital changes. In this case, the gray line is displayed as the initial capital divided by 8.
The rest of the options show a graph of capital change for each asset, showing when buys and sells occurred.
And set the start date, initial capital, stop loss %, and commission.
And select the 8 assets you want to invest in and you are ready to go. To effectively reduce risk, uncoupled assets would be better if possible.
The table in the lower right shows the selected asset and color.
Please enjoy the simulation.
5-8-13 EMAs Strategy (Andrew's Trading Channel)============
ENGLISH
============
- Description:
This strategy was designed by "Andrew's Trading Channel" (credits to him for the base strategy).
A lot of improvements have been added to the strategy, more conditions, trailing stop, custom stop loss and take profit, everything explained below.
- CONDITIONS FOR ENTERING A LONG:
EMA 5 crossovers EMA 8.
- EXIT LONG:
EMA 8 crossovers EMA 8 and closing price goes below EMA 13.
- CONDITIONS FOR ENTERING SHORT:
EMA 8 crossovers EMA 5.
- EXIT SHORT:
EMA 5 crossovers EMA 8 and closing price goes above EMA 13.
- Visual:
All EMAs are visible (5, 8 and 13 periods) with different and customizable colors/width.
Position start price, take profit, stop loss and trailing stop (if present) are shown automatically.
Background color shows green when LONG conditions are met (and of course, position is opened on the next candle), same for SHORT but red.
- Usage and recommendations:
As this is a coded strategy, you don't even have to check for indicators, just open and close trades as the strategy shows.
There're various customizable settings like optional take profit/stop loss, trailing stop (both based on ATR or any of the EMAs), open only LONGs/SHORTs or both, date range...
Take profit and stop loss ATR default values have been tested for scalping on 5 min charts, however feel free to check strategy results and increase the winning rate/profit for your favorite asset.
- Customization:
As usual I like to make as many aspects of my indicators/strategies customizable, indicators, colors etc., feel free to ask if you feel that something that should be configurable is missing or if you have any ideas to optimize the strategy.
============
ESPAÑOL
============
- Descripción:
Esta estrategia fue diseñada por "Andrew's Trading Channel" (créditos a él por la estrategia base).
Se han añadido muchas mejoras a la estrategia, más condiciones, trailing stop, stop loss y take profit personalizados, todo explicado a continuación.
- CONDICIONES PARA ENTRAR EN LONG:
Cruce de EMA 5 con EMA 8 ascendente.
- SALIR DE LONG:
Cruce de EMA 8 con EMA 5 ascendente y el precio de cierre se sitúa por debajo de la EMA 13.
- CONDICIONES PARA ENTRAR EN SHORT:
Cruce de EMA 8 con EMA 5 ascendente.
- SALIR DE SHORT:
Cruce de EMA 5 con EMA 8 ascendente y el precio de cierre se sitúa por encima de la EMA 13.
- Visual:
Todas las EMAs son visibles (5, 8 y 13 períodos) con colores/anchos y personalizables.
El precio de inicio de la posición, el take profit, el stop loss y el trailing stop (si están presentes) se muestran automáticamente.
El color de fondo es verde cuando se cumplen las condiciones de LONG (y por supuesto, la posición se abre en la siguiente vela), lo mismo para SHORT pero en rojo.
- Uso y recomendaciones:
Como esta es una estrategia programada, ni siquiera tienes que comprobar los indicadores, sólo abrir y cerrar las operaciones como te muestra la estrategia.
Hay varios ajustes personalizables como el take profit/stop loss opcional, el trailing stop (ambos basados en el ATR o en cualquiera de las EMAs), abrir sólo LONGs/SHORTs o ambos, rango de fechas...
Los valores por defecto del take profit y el stop loss ATR han sido probados para scalping en gráficos de 5 minutos, sin embargo, siéntase libre de comprobar los resultados de la estrategia y aumentar la tasa de ganancia / beneficio para su activo favorito.
- Personalización:
Como siempre me gusta hacer personalizables todos los aspectos de mis indicadores/estrategias, indicadores, colores, etc., siéntase libre de preguntar si cree que falta algo que debería ser configurable o si tiene alguna idea para optimizar la estrategia.
Joel on Crypto - MACD ScalpingJoel on Crypto - MACD Scalping
This is a Scalping indicator primarily intended for the 5 minute time frame.
It is based on the Crypto Scalping YouTuber Joel on Crypto's popular 5 minute scalping strategy and this is the indicator he personally use when Scalping.
This is a Multi-timeframe indicator where if you use it on the 5 minute time frame, the MACD Histogram bars will be based on the 1 minute timeframe.
The purpose of this indicator is not to trade it like a bot. The purpose is to grab the traders attention a time where there COULD be a scalping opportunity.
Use this indicator at your own risk.
MACD-VWhat is it?
The MACD-V indicator is the normal version of the MACD (Moving Average Convergence Divergence) indicator but normalized for volatility. It is normalized for volatility in order to compare momentum values across time and across tickers which the normal MACD indicator fails to do.
Formula
The formula for the MACD-V is as follows
MACD Line = [ / ATR(26)] * 100
Signal Line = EMA(9,MACD)
Histogram = MACD Line - Signal Line
How to Use
The MACD-V indicator is used to analyze normalized trends. If the MACD line is above 150, it is considered overbought. If the MACD line is below -150, it is considered oversold. Crossovers of the MACD line and the signal line are considered to be points of trend changes as well.
Features
Customizable Overbought/Oversold boundaries
Customizable colors
Credits
All credit for the idea behind this indicator goes to Alex Spiroglou CMT. His academic paper on the indicator can be found here .
In addition to Alex's idea for the paper, one TradingView user, Mik3Christ3ns3n has created a partial version of it which can be found here .
OpenCipher AOpenCipher A is an open-source and free to use Overlay.
Features:
EMA Ribbons (Lengths: 5, 11, 15, 18, 21, 25, 29, 33)
Symbols ("Be careful" and "attention required" signals)
EMA Ribbons
The EMA RIbbons are a set of exponential moving averages. Blue and white ribbons = uptrend, gray ribbons = downtrend. The ribbons can act as support in uptrends and as resistance in downtrends.
Lengths and source of the ribbons are customizable.
Symbols
Green Dots: The green dot is a bullish symbol that appears whenever the EMA 11 crosses over EMA 33.
Red Cross: The red cross is a bearish symbol that appears whenever the EMA 5 crosses under EMA 11.
Blue Triangle: The blue triangle marks a possible trend reversal that appears whenever the EMA 5 crosses over EMA 25 while EMA 29 is below EMA 33.
Red Diamond: The red diamond is a bearish symbol that marks a potential local top whenever a bearish wavecross occurs (fast wave crosses under slow wave).
Yellow X: The yellow X is a warning signal that appears whenever a bearish wavecross occurs while the slow wave of the wavetrend is below -40 and the moneyflow is in the red (below zero).
Blood Diamond: The blood diamond is a bearish symbol that highlights whenever the red diamond and the red cross appear on the same candle.
Usage
Treat the symbols as signs that your attention might be required and don't trade based on them.
Divergence + EMAS' + VolumeHi,
This strategy takes in consideration multiple factors: includes RSI divergence, plus cross of EMAs and volume
STRATEGY:
you can change the EMAs input best use for daily charts
BUY: ALERT:
WHEN RSI divergence ABOVE 0 AND EMA 5 CROSS-OVER EMA 12
AND THE CANDLE NEED TO CLOSE ABOVE BOTH MOVING AVERAGE
And THE VOLUME BAR NEED TO BE HIGHER THAN THE PREVIOUS ONE
Then a buy signal will appear
SELL ALERT:
WHEN RSI divergence BELOW 0 AND MA 5 CROSS-UNDER EMA 12
AND THE CANDLE NEED TO CLOSE below BOTH MOVING AVERAGE
THE VOLUME BAR NEED TO BE HIGHER THAN THE PREVIOUS ONE
Then a sell signal will appear
Ema 200 FILTER. :::
When this box is activated, all trades under the EMA 200 will not appear on the chart,, when deactivated, trades will appear. On the chart.
that way u prevent wrong trades. obviously u will need to use support and resistance to find re entry point or the lowest point when under the 200 EMA.
No strategy is perfect but this one get close to it.
VOLUME: the volume box is turn off , only to display or not display in the chart, but is considered on the math within the strategy so by turning off you are only turning off the visual part
any questions feel free to ask, thanks!
Triple SWMA + EMA Crossover Color Candle+ ADX Color Candle V2! IMPORTANT !
To better see the color of the bars I suggest you deactivate the Borders option in the chart settings / Symbol, LIKE THIS:
════════════════════════════════════════════════════════════════════════════════════════════════════════════════════
The indicator is the same as the previous version, with the only difference that now the indicator is composed of an addition of secondary candles colored according to the EMA cross, while the main candles based on the ADX, the SWMA are inserted into secondary candles
════════════════════════════════════════════════════════════════════════════════════════════════════════════════════
1) SWMA
There are 3 SWMA , with the possibility of modifying the Source and the length of each one, also each SWMA can be removed or can all of them be removed with the ON / OFF option in Inputs-STYLE. (ALL SWMA?)
════════════════════════════════════════════════════════════════════════════════════════════════════════════════════
2) EMA Fast and Slow, Cross
There are two EMAs, fast and slow, both with the possibility of changing the source and length, in the chart settings it is possible to change the color of EMA Long and EMA Short:
EMA Long = Ema Fast > Ema Slow
EMA Short = Ema Slow > Ema Fast
Ema cross has a style choice option, the possible choices are:
NONE = nothing
ALL = all choices
LINE = ema200 colored based on Ema Long-Short
BAR COLOR = color candles based on Ema Long-Short
PLOTSHAPE = signals based on Ema Long-Short
LINE + BAR COLOR = line + bar color
BAR COLOR + PLOTSHAPE = bar color + plotshape
════════════════════════════════════════════════════════════════════════════════════════════════════════════════════
3) ADX Candle
The candles are colored according to 4 inputs:
Color 1 ( Silver ) = ADX < 20
Color 2 (Black) = ADX cross-ADX Index (adx+adx 14 period back) / 2
Color 3 (Lime) = ADX > 0 and DI delta (DI plus - DI minus) > 0
Color 4 (Red) = ADX > 0 and DI delta (DI plus - DI minus) < 0
all colors are editable and if you don't want to have ADX Candle on the chart, just remove the ON / OFF option in Inputs-STYLE. (BAR COLOR ADX )
Triple SWMA + EMA Crossover Color Candle+ ADX Color CandleIMPORTANT
The indicator allows you to view the Color Bars only if it is in the foreground, to do this just put the indicator before the description of the symbol, LIKE THIS:
════════════════════════════════════════════════════════════════════════════════════════════════════════════════════════════════
This indicator is composed of:
1) Tiple SWMA
There are 3 SWMA, with the possibility of modifying the Source and the length of each one, also each SWMA can be removed or can all of them be removed with the ON / OFF option in Inputs-STYLE. (ALL SWMA?)
════════════════════════════════════════════════════════════════════════════════════════════════════════════════════════════════
2) EMA Fast and Slow, Cross
There are two EMAs, fast and slow, both with the possibility of changing the source and length, in the chart settings it is possible to change the color of EMA Long and EMA Short
EMA Long = Ema Fast > Ema Slow
EMA Short = Ema Slow > Ema Fast
Ema cross has a style choice option, the possible choices are:
ALL = all choices
LINE = ema200 colored based on Ema Long-Short
BAR COLOR = color candles based on Ema Long-Short
PLOTSHAPE = signals based on Ema Long-Short
LINE + BAR COLOR = line + bar color
BAR COLOR + PLOTSHAPE = bar color + plotshape
if you don't want to have EMA Fast and Slow, Cross on the chart, just remove the ON / OFF option in Inputs-STYLE. (EMA style)
════════════════════════════════════════════════════════════════════════════════════════════════════════════════════════════════
3) ADX Candle
The candles are colored according to 4 inputs:
Color 1 (Silver) = ADX < 20
Color 2 (Black) = ADX cross-ADX Index (adx+adx 14 period back) / 2
Color 3 (Lime) = ADX > 0 and DI delta (DI plus - DI minus) > 0
Colo 4 (Red) = ADX > 0 and DI delta (DI plus - DI minus) < 0
all colors are editable and if you don't want to have ADX Candle on the chart, just remove the ON / OFF option in Inputs-STYLE. (BAR COLOR ADX)
Fukuiz Octa-EMA + IchimokuThis indicator base on EMA of 8 different period and Ichimoku Cloud.
#A brief introduction to Ichimoku #
The Ichimoku Cloud is a collection of technical indicators that show support and resistance levels, as well as momentum and trend direction. It does this by taking multiple averages and plotting them on a chart. It also uses these figures to compute a “cloud” that attempts to forecast where the price may find support or resistance in the future.
#A brief introduction to EMA#
An exponential moving average (EMA) is a type of moving average (MA) that places a greater weight and significance on the most recent data points. The exponential moving average is also referred to as the exponentially weighted moving average. An exponentially weighted moving average reacts more significantly to recent price changes than a simple moving average (SMA), which applies an equal weight to all observations in the period.
I combine this together to help you reduce the false signals in Ichimoku.
#How to use#
EMA (Color) = Bullish trend
EMA (Gray) = Bearish trend
#Buy condition#
Buy = All Ema(color) above the cloud.
#Sell condition#
SELL= All Ema turn to gray color.
KAMIKAMI EMA RIBBONGood evening plebians, This IS Cryptofilio, Your dark knight in the Crypto lightness.... Introducing yet another nebulous indicator... It's the KAMI, KAMI (GODS in Japanese) EMA ribbon.....
This indicator uses 3 primary lengths of EMA labeled as Short, Medium, and Long. They change colors in relation to each other and in relation to the current price of the security.
This indicator is more sophisticated than a simple MA cross strategy as you can use a wider variety of signals for entering earlier and exiting earlier, thus getting into a trade early in the run-up and getting out before the run-down. The EMA is identifiable by the color, lighter green and red representing lower lookbacks. When the OHLC4 crosses the ema it changes color. Thus if all colors are red, then the security is trading below all EMA's - a strong sell or short signal.
GREEN inside of RED indicates an uptrend within a larger downtrend... and of course, the inverse is also true.
The triangles which indicate a cross, are color-coded according to their significance by transparency - the less transparent the more important or significant the cross.
In addition, there are bull and bear bounce indicators (the arrows) that predict a bounce up or down from the security meeting a point along the EMA line and reacting.
VARIATIONS: To use this for scalping I suggest 5,8,13
MA with options5 Types of Moving Averages have been combined into the script. The user has the liberty to select the length of the MA and the MA type (SMA, EMA, WMA, VWMA, RMA) of his/her choice.
Dynamic Fibonacci Pivot Points & EMA CrossoversI have created this script for those who face difficulties drawing Fibonacci levels as this script is Dynamic so it automatically calculates the ranges based on current High and Lows. I have also added Standard Fibonacci Pivot Points so that we can easily see the confluences between Dynamic and Standard pivot points. Apart from this I have also added EMA Crossovers so that we can easily identify trend changes. You can modify this script as per your own.
Vin's Playzone Strategy How it works
Playzone is a very simple system, utilizing just two exponential moving
averages. The 'Zones' in which different 'actions' should be taken is
highlighted with different colors on the chart. Calculations for the zones
are based on the relative position of price to the two EMA lines and the
relationship between the two EMAs
How to use
The basic method for using Playzone is to follow the green/red color.
Buy when bar closes in green.
Sell when bar closes in red.
Using it this way is safe but slow and is expected to have around 35-40%
accuracy, while yielding around 2-3 profit factors. The system works best
on larger time frames.
The more advanced method uses the zones to switch between different
trading system and biases, or in conjunction with other indicators.
example 1:
Buy when Yellow-Green and Bullish Divergence between price and RSI is visible,
if not Buy on Green and vise-versa
example 2:
Set up a long-biased grid and trade long only when actionzone is in green
change the bias to short when actionzone turns to te bearish side(red)
(Look at colors on a larger time frame)
"We let the market tell us what to do, Not to outguess what the market gonna do."