RATIO TPI ETHBTC | JeffreyTimmermansETHBTC Ratio Trend Probability Indicator
Medium-Term Trend Assessment | Dominant Major Detector: The ETHBTC Ratio TPI is a medium-term trend-following indicator designed to measure the relative strength between Ethereum and Bitcoin — the two most dominant assets in crypto. By analyzing the ETHBTC ratio, this tool provides insights into which of the two is currently leading the market trend.
Unlike absolute price indicators, this tool tracks relative dominance. When Ethereum outperforms Bitcoin, the ratio trends upward, signaling ETH dominance. When Bitcoin outperforms Ethereum, the ratio trends downward, signaling BTC dominance.
Key Features
Dominant Major Identification:
The core purpose of this TPI is to determine which asset — Ethereum or Bitcoin — is the dominant major in the current crypto cycle.
ETH Dominant: ETHBTC is trending up
BTC Dominant: ETHBTC is trending down
Neutral: No clear directional edge
8 Trend-Following Inputs:
The indicator aggregates 8 hand-picked, medium-term trend-following metrics into a single score that simplifies the ETHBTC trend assessment.
Score-Based Regime Classification:
Score > 0.1 → ETH is in relative uptrend → Dominant Major: ETH
Score < -0.1 → BTC is in relative uptrend → Dominant Major: BTC
Between -0.1 and 0.1 → Neutral trend → No clear dominance
Dynamic Visuals:
Background color adapts to the dominant asset
Score, trend state per input, and composite result are shown in a clean dashboard
Use Cases:
Rotation Strategy Insight: Understand whether capital is flowing into Ethereum or Bitcoin to adjust your portfolio positioning accordingly.
Dominance-Based Macro Timing: Use the dominance shift as a leading signal for broader altcoin cycles.
Multi-Timeframe Confirmation: Combine with LTPI (Long-Term) and STPI (Short-Term) to build directional conviction.
Conclusion
The ETHBTC Ratio TPI is a highly focused tool that simplifies the complex relationship between Ethereum and Bitcoin into one clear output: who is currently leading the crypto market. With 8 inputs driving a composite trend score and a dynamic dominance label, this indicator is essential for anyone looking to time ETH vs BTC rotations with precision.
ETHBTC

Currency ComparatorIndicator Description
This script helps you compare the price changes of various cryptocurrencies against each other.
While TradingView provides some pairs like ETH/BTC or BNB/BTC, it lacks support for comparing lower-market-cap coins against BTC or other currencies. That’s where this script comes in, allowing you to easily view ratios like DOGS/BTC, LSD/BTC, and more.
You can also analyze the relationship between two high-market-cap assets, such as ETH/SOL, which is often not available directly on TradingView.
Additionally, this indicator enables you to view the changes of two cryptocurrencies alongside a base currency. For example, you can observe how Bitcoin's rise impacts LSD and whether it strengthens or weakens relative to BTC.
Features
Maximized View: You can open the indicator in a maximized chart view and use it like any other chart for your technical analysis.
Customizable Comparisons: Compare any two assets with ease by configuring the indicator inputs.
Important Notes
1.Preserving Drawings:
Drawings and tools applied to the indicator chart are not tied to the indicator’s settings. This means changing the inputs won’t affect them. To avoid losing your work:
Open the chart of the base asset (e.g., LSD/USDT) where you want to analyze a specific pair (e.g., LSD/BTC).
Use the indicator there. This way, whenever you want to revisit your analysis, you only need to open the base chart (e.g., LSD/USDT) and update the indicator inputs to the desired pair (e.g., LSD/BTC).
2.Deleting the Indicator:
Removing the indicator from the chart will also delete all your drawings. If you need to keep them, do not delete the indicator.
3.Precision Settings:
By default, the indicator displays up to 12 decimal places (precision). For pairs where such precision isn’t required, you can adjust it in the settings under the "Style" section to your preferred value. If you need higher precision again, simply reset it to the default value.

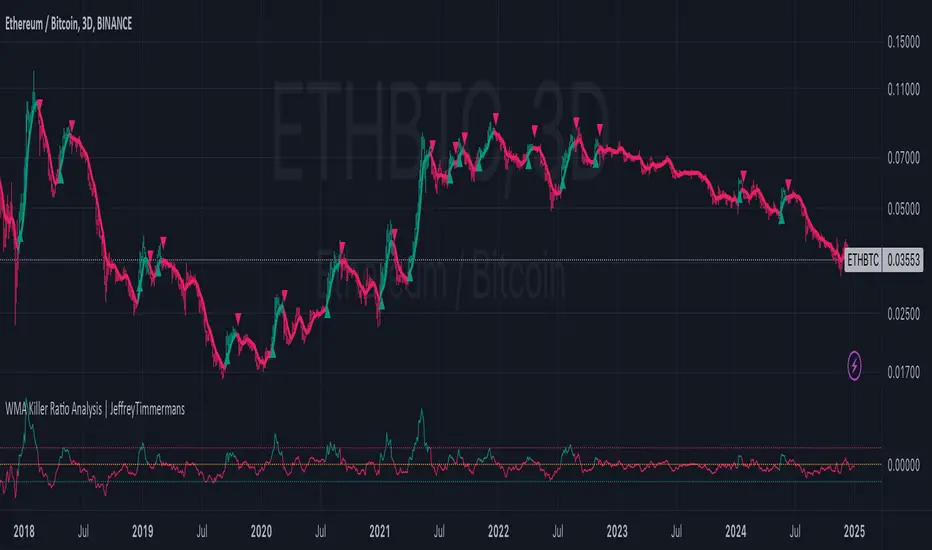
WMA Killer Ratio Analysis | JeffreyTimmermansWMA Killer Ratio Analysis
The WMA Killer Ratio Analysis is a highly responsive trend-following indicator designed to deliver quick and actionable insights on the ETHBTC ratio. By utilizing advanced smoothing methods and normalized thresholds, this tool efficiently identifies market trends. Let’s dive into the details:
Core Mechanics
1. Smoothing with Standard Deviations
The WMA Killer Ratio Analysis begins by smoothing source price data using standard deviations, which measure the typical variance in price movements. This creates dynamic deviation levels:
Upper Deviation: Marks the high boundary, indicating potential overbought conditions.
Lower Deviation: Marks the low boundary, signaling potential oversold conditions.
These levels are integrated with the Weighted Moving Average (WMA), filtering out market noise and honing in on significant price shifts.
2. Weighted WMA Bands
The WMA is further refined with dynamic weighting:
Upper Weight: Expands the WMA, creating an Upper Band to capture extreme price highs.
Lower Weight: Compresses the WMA, forming a Lower Band to reflect price lows.
This adaptive dual-weighting system highlights potential areas for trend reversals or continuations with precision.
3. Normalized WMA (NWMA) Analysis
The Normalized WMA adds a deeper layer of trend evaluation: It calculates the percentage change between the source price and its smoothed average. Positive NWMA values suggest overbought conditions, while negative NWMA values point to oversold conditions.
Traders can customize long (buy) and short (sell) thresholds to align signal sensitivity with their strategy and market conditions.
Signal Logic
Buy (Long) Signals: Triggered when the price remains above the lower deviation level and the NWMA crosses above the long threshold. Indicates a bullish trend and potential upward momentum.
Sell (Short) Signals: Triggered when the price dips below the upper deviation level and the NWMA falls beneath the short threshold. Suggests bearish momentum and a potential downward trend.
Note: The WMA Killer Ratio Analysis is most effective when paired with other forms of analysis, such as volume, higher time-frame trends, or fundamental data.
Visual Enhancements
The WMA Killer Ratio Analysis emphasizes usability with clear and dynamic plotting features:
1. Color-Coded Trend Indicators: The indicator changes color dynamically to represent trend direction. Users can customize colors to suit specific trading pairs (e.g., ETHBTC, SOLBTC).
2. Threshold Markers: Dashed horizontal lines represent long and short thresholds, giving traders a visual reference for signal levels.
3. Deviation Bands with Fill Areas: Upper and Lower Bands are plotted around the WMA. Shaded regions highlight deviation zones, making trend boundaries easier to spot.
4. Signal Arrows and Bar Coloring: Arrows or triangles appear on the chart to mark potential buy (upward) or sell (downward) points. Candlesticks are color-coded based on the prevailing trend, allowing traders to interpret the market direction at a glance.
Customization Options
Adjustable Thresholds: Tailor the sensitivity of long and short signals to your strategy.
Dynamic Weighting: Modify upper and lower band weights to adapt the WMA to varying market conditions.
Source Selection: Choose the preferred input for price data smoothing, such as closing price or an average (hl2).
The WMA Killer Ratio Analysis combines rigorous mathematical analysis with intuitive visual features, providing traders with a reliable way to identify trends and make data-driven decisions. While it excels at detecting key market shifts, its effectiveness increases when integrated into a broader trading strategy.
-Jeffrey
Altcoin Total Average Divergence (YavuzAkbay)The "Average Price and Divergence" indicator is a strong tool built exclusively for cryptocurrency traders who understand the significance of comparing altcoins to Bitcoin (BTC). While traditional research frequently focusses on the value of cryptocurrencies against fiat currencies such as the US dollar, this indicator switches the focus to the value of altcoins against Bitcoin itself, allowing you to detect potential market opportunities and divergences.
The indicator allows you to compare the price of an altcoin to Bitcoin (e.g., ETHBTC, SOLBTC), which is critical for determining how well an altcoin performs against the main cryptocurrency. This is especially important for investors who expect Bitcoin's price will continue to rise logarithmically and want to ensure that their altcoin holdings retain or expand in market capitalisation compared to Bitcoin.
The indicator computes the average price of the chosen cryptocurrency relative to Bitcoin over the viewable portion of the chart. This average acts as a benchmark, indicating the normal value around which the altcoin's price moves.
The primary objective of this indicator is to calculate and plot the divergence, which is the difference between the altcoin's current price relative to Bitcoin and its average value. This divergence can reveal probable overbought or oversold conditions, allowing traders to make better decisions about entry and exit points.
The divergence is represented as a histogram, with bars representing the magnitude of the difference between the current and average prices. Positive values indicate that the altcoin is trading above its average value in comparison to Bitcoin, whereas negative values indicate that it is trading below its average.
The indicator automatically adjusts to the chart's visible range, ensuring that the average price and divergence are always calculated using the most relevant data. This makes the indicator extremely sensitive to changes in the chart view and market conditions.
How to Use:
A significant positive divergence may imply that the cryptocurrency is overbought in comparison to Bitcoin and is headed for a correction. A significant negative divergence, on the other hand, may indicate that the cryptocurrency has been oversold and is cheap in comparison to Bitcoin.
Tracking how an altcoin's price deviates from its average relative to Bitcoin can provide insights about the market's opinion towards that altcoin. Persistent positive divergence may suggest high market confidence, whilst constant negative divergence may imply a lack of interest or eroding fundamentals.
Use divergence data to better time your trades, either by entering when a cryptocurrency is discounted in comparison to its average (negative divergence) or departing when it is overpriced (positive divergence). This allows you to capture value as the price returns to its mean.
Ideal For:
Cryptocurrency Traders who want to understand how altcoins are performing relative to Bitcoin rather than just against fiat currencies.
Long-term Investors looking to ensure their altcoin investments are maintaining or growing their value relative to Bitcoin.
Market Analysts interested in identifying potential reversals or continuations in altcoin prices based on divergence from their average value relative to Bitcoin.

ICHIMOKU Crypto Swing StrategyThis is a crypto swing strategy designed for timeframes bigger than 1h.
The main components are
ICHOMOKU
KDJ
Average High
Average Low
Rules for entry
For long: we have the ichimoku crosses between tenkan and baselines, we have a rising kdj line and at the same time we have a increase in the average high
For short: we have the ichimoku crosses between tenkan and baselines, we have a falling kdj line and at the same time we have an increase in the average low
Rules for exit
We exit when we have inverse conditions than the initial ones used for entry.
Caution
This strategy does not use a risk management, so be careful with it !
If you have any questions let me know !

Amrullah Deep Liquidity for ETHBTCAmrullah Deep Liquidity (ADL)
Amrullah Deep Liquidity (ADL) is a high profit factor strategy based on models designed by Muhd Amrullah.
Choosing your trading pair that you are planning to backtest
Check that you have been given access to Amrullah Deep Liquidity (ADL). Select ETHBTC with the default 2H time frame. Once done, open Indicators > Invite-Only Scripts > Amrullah Deep Liquidity %.
Choosing your initial capital that you want to begin backtesting
Go to Settings > Properties > Initial Capital and type in the amount of capital you're starting with. For the ETHBTC trading pair, the initial capital is denominated in BTC.
Adjusting your equity at risk until the trades match your risk profile and comfort level
Go to Inputs > Equity Risk and adjust the value you are comfortable with. To analyse performance, you also want to choose the Start Year, Start Month and Start Date. Select lower equity risk for trades that you intend to take without the use of leverage. You can select an equity risk from 0.001 to 0.05 or all the way to 1.
Finding the time frame with the highest profit factor
Profit factor is defined as the gross profit a strategy makes across a defined period of time divided by its gross loss. You may choose to scroll through other time frames to find better models. You can select a different time frame from 1 min to 1H or all the way to 1M. Once you find the model you desire, you are encouraged to check that the model has a backtested profit factor of >3.5. You can then begin looking through the Performance Summary to find other detailed statistics.
Analysing the equity curve from the Amrullah Deep Liquidity (ADL) strategy
A green equity curve indicates that the trades are accumulating profits. A red equity curve indicates that the trades are accumulating losses. A healthy equity curve is one that is green and grows steadily to the right and upward direction.
Analysing the display arrows on the chart
Amrullah Deep Liquidity (ADL) tells you when to take a trade and how much to put in a trade. ADL can do this as the model identifies inventory risk in traders and market makers in the chosen market. On your Tradingview chart, ADL will display an arrow that tells you when to enter a trade. You can also see the amount to trade beside the arrow.
Opting for a trial
Yes you may opt for a trial which has limited availability.
The author's background and experience
My career in software and deep learning development spans across more than 5 years. At work, I lead a team to solve core computer vision tasks for large companies. I continually read all kinds of computer science books and papers, and follows progress on tools used in financial markets.

Keltner Channel Alerts [QuantNomad]This is a script with alerts for standard Keltner Channer Strategy you can find in TradingView.
Use "Once Per Bar" option when creating alerts.

Crypto Ingenius Breakout w AlertsThis is a breakout strategy designed for crypto currency markets with alerts for buy and sell entries as well as buy and sell exits. It is designed primarily to work on 1 hour and 4 hour charts. Message me for a free 7-day trial and for pricing
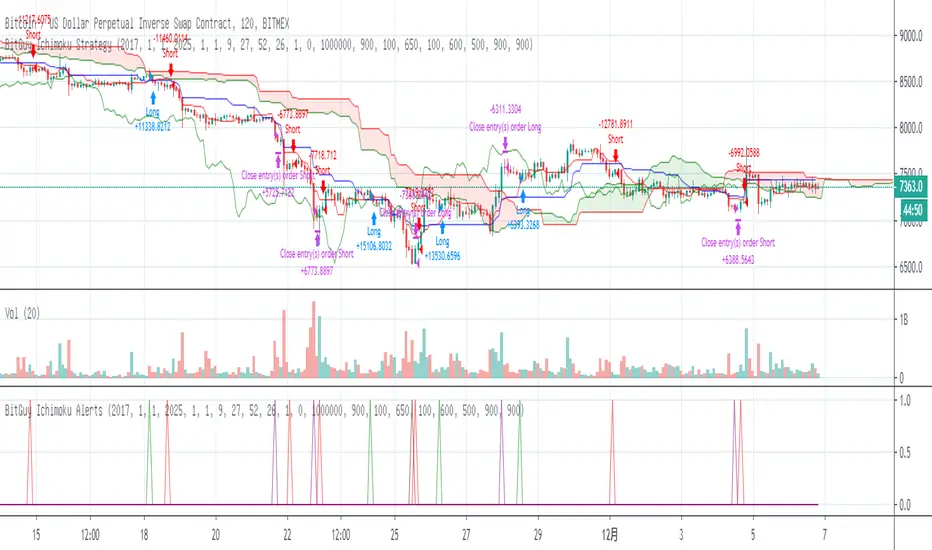
BITMEX Bybit binance HUOBI OKCOIN BTC Ichimoku TREND AlertsBITMEX Bybit binance HUOBI OKCOIN BTC Ichimoku TREND Alerts
This is a very effective trend strategy.
Strategy principle
HOW TO USE
set long position when a green arrow appears in the chart.
set short position when a red arrow appears in the chart.
For the long position and the short direction, you can set the stop profit & stop loss or trailing profit stop & trailing stop loss respectively.
When a purple arrow appears to close a position, an aggressive trader can go in the opposite direction when it is purple.
Strategy applicability
The default setting is for bitmex perpetual swap contract XBTUSD , bybit BTCUSD perpetual futures contract ,binance btcusdt Spot,Bitfinex BTCUSD Spot,bitflyer BTCJPY Spot,bithumb BTCKRW Spot,bitso BTCMXN Spot, bitstamp BTCUSD Spot,bittrex BTCUSDT Spot,Coinbase BTCUSD spot, deribit BTCPERP perpetual futures contract,gemini BTCUSD Spot,Hitbit BTCUSDT Spot,huobi BTCUSDT Spot KRAKEN XBTUSD spot,OKCOIN OKEX BTCUSD3M BTCUSD BTCUSD2W,Poloniex BTCUSDT Spot etc btc symbol with 30 minutes timeframe.
This indicator has broad applicability and can be applied to multiple different symbols.
This indicator also applies to the ETHUSD symbol etc, just adjust the default configuration.
Using the alert of the indicator, it can work well on the trading robot like Gunbot,autoview, without repaint false signals.
这是非常有效的趋势策略。
如何使用
在图表中出现绿色箭头就做多。
在图表中出现红色箭头就做空。
对于多头头寸和空头方向,您可以分别设置止损和止损或尾随利润止损和尾随止损;当出现紫色箭头时平仓,激进的交易者,可以在紫色时就做反方向。
策略适用性
默认设置是针对bitmex交易所 XBTUSD永久掉期合约,BYBIT交易所 BTCUSD永续期货合约,binance币安交易所 btcusdt现货,Bitfinex交易所 BTCUSD现货,bitflyer交易所 BTCJPY现货,bithumb交易所 BTCKRW现货,bitso交易所 BTCMXN现货,bitstamp交易所 BTCUSD现货,bittrex交易所 BTCUSDT现货,Coinbase交易所 BTCUSD现货,deribit交易所 BTCPERP永续期货合约,gemini双子星交易所 BTCUSD现货,Hitbit交易所 BTCUSDT现货,huobi火币交易所 BTCUSDT现货,KRAKEN交易所 XBTUSD现货,OKCOIN OKEX交易所 BTCUSD3M OK BTC季度合约 BTCUSD BTCUSD2W OK BTC次周合约,Poloniex BTCUSDT现货等2小时区间的btc交易。
Bitmex XBTUSD 2H 比特币期货 2 hours Bitcoin Futures
这个指标具有广泛的适用性,可以适用多个不同交易品种。
该指标还适用于ETHUSD,ETHBTC,ADABTC,TRXBTC,XRPBTC交易品种等,只需调整默认配置即可。
Bitmex ETHUSD 2H 以太币合约
binance ADABTC 2H
Binance ETHBTC 90 minutes 分钟
Binance TRXBTC89 minutes 分钟
Binance XRPBTC 90 minutes 分钟
使用该指标的警报设置,它可以在自动交易机器人上很好地工作,而无重绘错误的信号。
Pro CryptoSolver Indicator w Alerts [Jwammo12]This is a pro indicator for Crypto trading. It includes entry and exit alerts for both long and short trades.
The strategy version can be viewed here: CrytoSolver Strategy
Message me for a free 7-day trial and for pricing for lifetime access.
Pro CryptoSolver Strategy [Jwammo12]This is a pro strategy for trading crypto pairs. It trades both long and short and includes an adjustable stop loss.
Lowering the activity parameter increases the number of trades and is not bounded by zero.
Message me for a free 7-day trial and pricing for lifetime access.

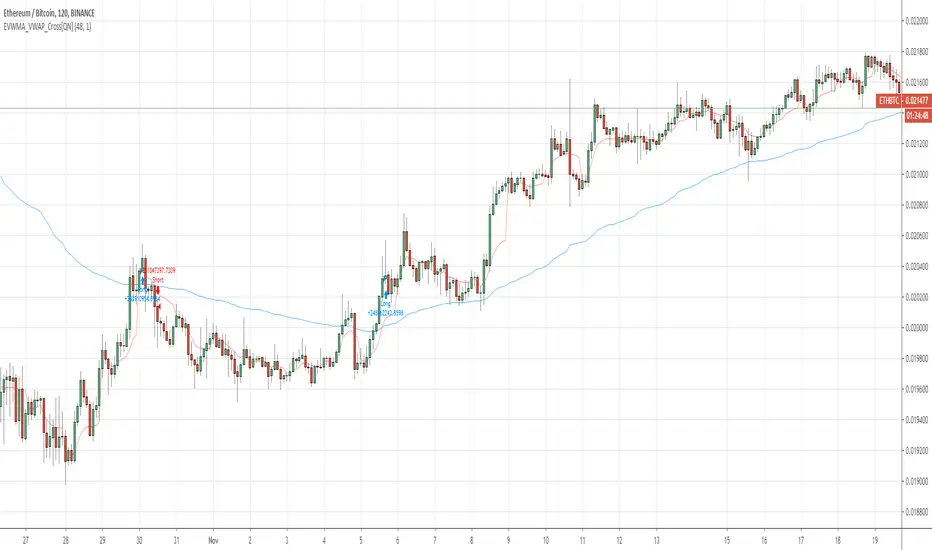
EVWMA VWAP Cross Strategy [QuantNomad]Continue to experiement with VWAP and EVWMA.
It seems that just simple crosses between VWAP and EVWMA can be pretty good signals. VWAP is a bit choppy so you can use VWAP smoothing input to smoth it a bit.
Here are few other strategies based on EVWMA:
EVWMA VWAP MACD Strategy
QuantNomad - EVWMA MACD Strategy
Buy & Sell - ETHBTC:BINANCE 4H Trading BotWith this indicator you can create Buy and Sell alerts to automate your trading.
Optimised for BINANCE:ETHBTC in a 4H timeframe.
> > > READ HOW IT WORKS < < <
The goal of trading ETH against BTC is to increase your amount of BTC. ETH is in the top 5 Coins of all time and its bull rallies are really fast and volatile so it's very important not to miss them!
Built upon my generic indicator Cyatophilum Altcoins Trader , this Strategy creates buy and sell signals to can be used for manual or automated trading.
The year 2019 started with the end of a bull run, and the script was able to catch 29% of profits. Then in Februrary, we saw another rally, but this one dropped fast and the script caught 4% of profits. Until then, two opportunities of trade triggered but ended up as a loss, as the bear market continued. In total, it made 33% of profit and 9.5% of loss . The fact that a bear market has be going on for +3 months is a good thing for what will happen next.
I think we all remember how 2018 was for ETH. It had the most insane rally of all time, another one in April-May then 6 months of bear market. Oh! by the way, did I say the script has an integrated trailing stop loss starting at 4%? Those are the green dots below the price.
I used TradingView's Strategy Tester with historical data starting from 2017-08. Results are calculted using 100% equity from a 10 000$ capital and a 0.05% commission fee on each trade.
See the results below.
> > > READ HOW TO USE < < <
> Get access to the Cyatophilum Indicators <
Ethereum Automated Strategy - Bitfinex - 3HHello guys !
Here is a ready to use BITFINEX:ETHBTC Automated Strategy with Long and Short Alerts !
You can see the backtest below using 100% equity of 10 000$, 0.1% commission, long and short trades with no leverage.
Indicator used
Leave a comment to get your trial !
or
Get the indicator today !

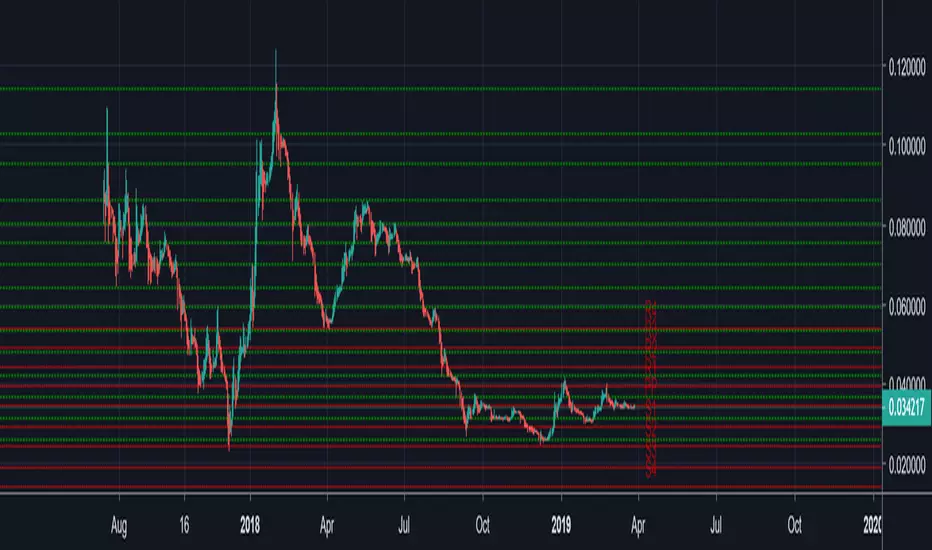
Auto FIB v1Auto FIB indicator defects automatically high and low for the coins and created Fib lines.
I would greatly appreciate if you could leave feedback on this indicator.
if you like this indicator, I would greatly appreciate if you can donate for the hard work.
BTC - 138yXLNU2CJBuTJ9tBYkKBcv1wC17VN2RV
ETH -0x435a32d7F1383626F271eE9f999d18b83453BF80
LTC - LcsfSCsRDqPWxH7vC5wMGJXh8x3bfKvvZj
ETC - 0x3f6cAfdc0544a34DdC0E0fd4908C68Ec6a803708
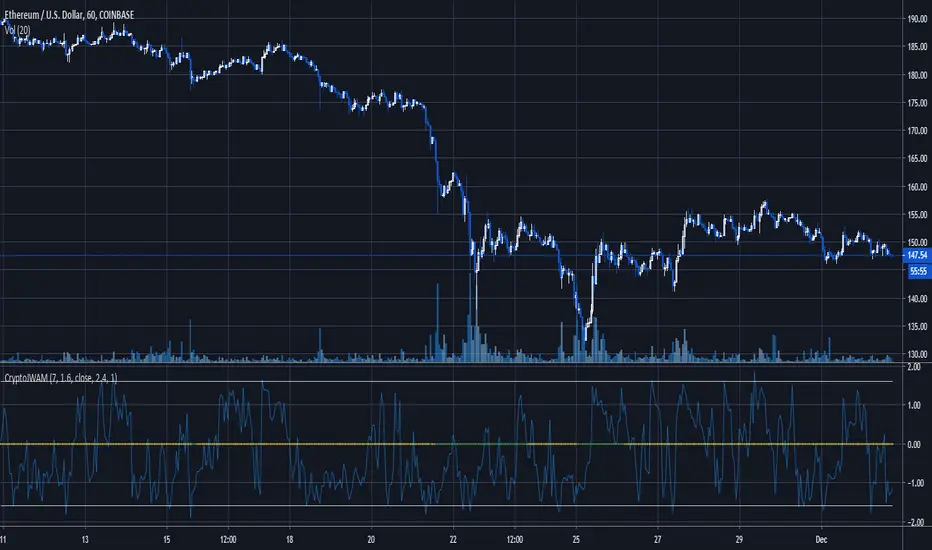
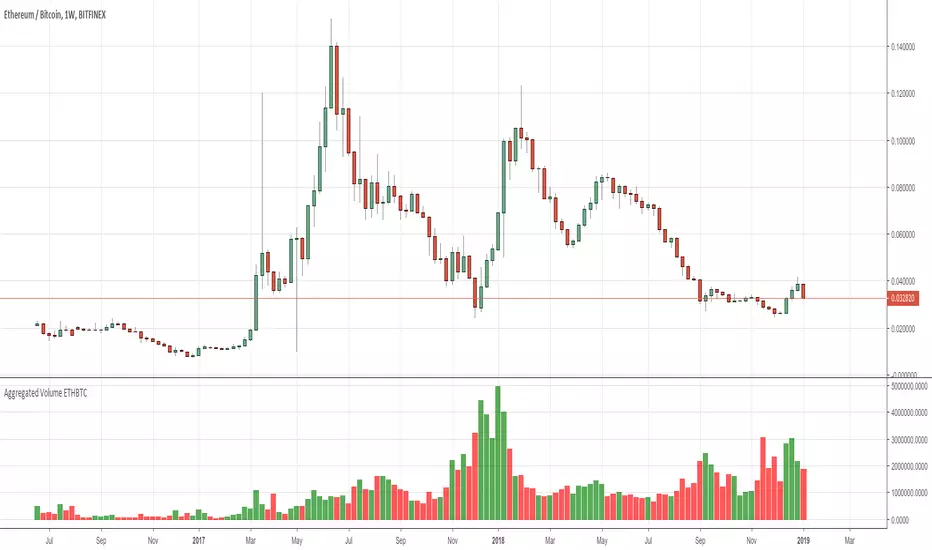
ETH HawkEye Aggregated Volume IndicatorThis is combined Aggregated ETH Exchange Volume by Neobutane with HawkEye volume clone indicator by LazyBear.
Indicator includes aggregated raw ETH volume from 7 user selectable fiat and tether exchanges on USD, USDT, BTC, EUR, GBP, JPY pairs + Exponential MA + hawkeye bar coloring where: green is bullish volume , red - bearish and white - volume neutral to the market:
Bitfinex
Coinbase
Bitstamp
Kraken
Binance
Poloniex
Bittrex
*There is a TV bug that doesn't display a whole volume history if some pair was added later than date intended to be analysed by operator eg, if you want to watch older data you should exclude all secondary pairs that were added later and switch off "newer" exchanges like Binance.

Aggregated Volume ETHBTCAggregates the ETH/BTC volume from multiple exchanges into a single indicator.
# Exchanges and Pairs
Included are only exchanges supported by TradingView:
* Binance
* Bitstamp
* Bittrex
* Coinbase
* Gemini
* Bitfinex
* Kraken
* Poloniex
* HitBTC
Excluded low volume exchanges (not in CMC Top):
* CEX.IO
Many other top exchanges are not included, because they are not supported by TradingView.
# Inputs
By default the spot exchanges are selected. You can select also the other margin trading and derivatives exchanges.
# Contribute
Feel free to share any ideas and issues you have.
# Open Source
The code is open source @ github.com and uses the commonpine library github.com
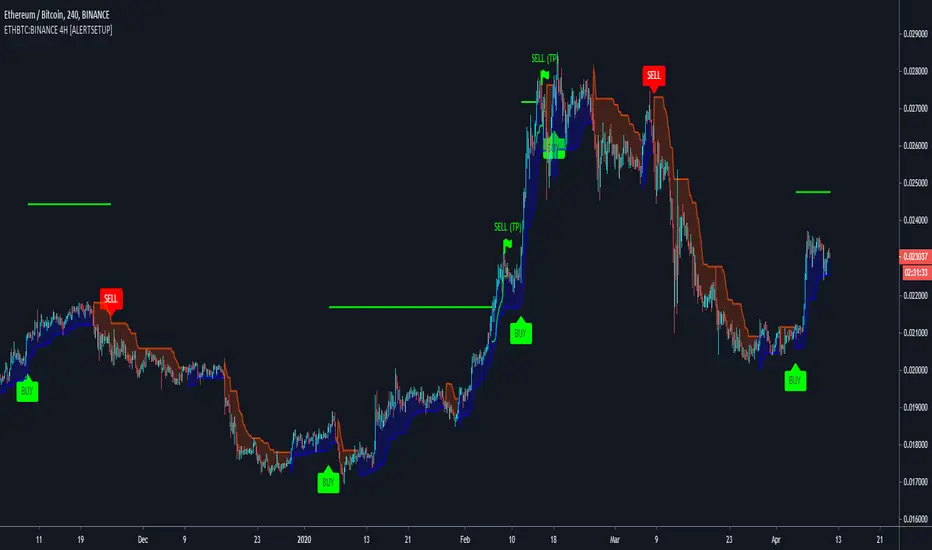
Cyatophilum Crypto Trader 1H [ALERTSETUP]A strategy specificaly engineered for trading altcoins.
Crypto pairs configurations already available: ADA/BTC, BNB/BTC, EOS/BTC, ETH/BTC, ICX/BTC, NEO/BTC, TRX/BTC, XLM/BTC, XMR/BTC, XRP/BTC.
This version allows to create automated alerts for buy and sell signals that can be used for manual or bot trading.
Note: You can use the backtest version for finding the best configuration for your pair if it isn't in the list. I will also be there to help you.
How it Works
The strategy is based upon two Exponential Moving Averages, it captures trend reversals, fakeouts, has a stop loss option and more (see the presentation page for input parameters description).
It should be used in 1 Hour timeframe and on any pair of cryptocurrency.
Backtest
The Net Profit (Gross profit - Gross loss) is calculated with a commission of 0.05% on each order.
Each trade is made with 100 % of equity
Get the indicator today!
Purchase on my website : blockchainfiesta.com

Cyatophilum Crypto Trader 1H [BACKTEST]A strategy specificaly engineered for trading altcoins.
Crypto pairs configurations already available: ADA/BTC, BNB/BTC, EOS/BTC, ETH/BTC, ICX/BTC, NEO/BTC, TRX/BTC, XLM/BTC, XMR/BTC, XRP/BTC.
Note: You can use this backtest version for finding the best configuration for your pair if it isn't in the list. I will also be there to help you.
How it Works
The strategy is based upon two Exponential Moving Averages, it captures trend reversals, fakeouts, has a stop loss option and more (see the presentation page for input parameters description).
It should be used in 1 Hour timeframe and on any pair of cryptocurrency.
Backtest
The Net Profit (Gross profit - Gross loss) is calculated with a commission of 0.05% on each order.
Each trade is made with 100 % of equity
Get the indicator today!
Purchase on my website : blockchainfiesta.com

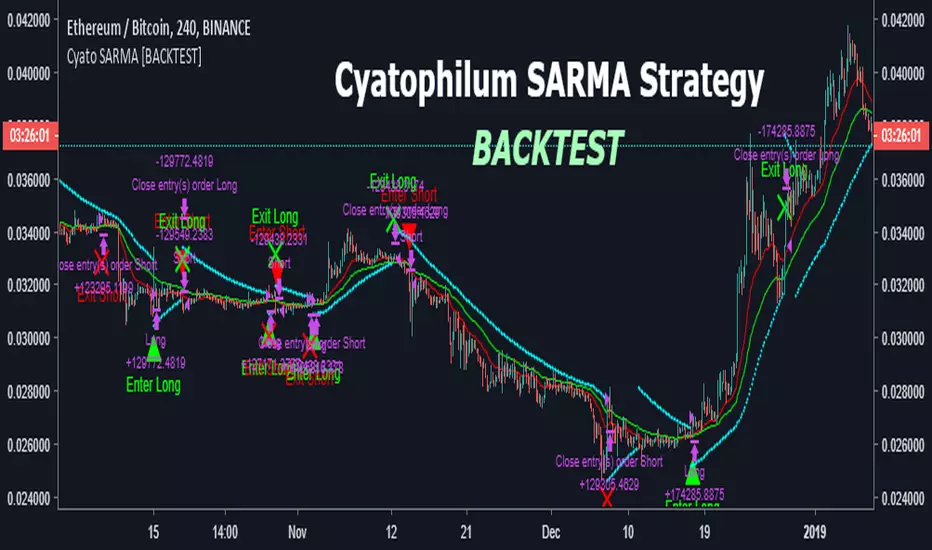
Cyatophilum SAR-MA Strategy [BACKTEST]An Automated Strategy based on Parabolic SAR and EMAs. Works on any timeframe and market.
Backtest is done using the largest period TradingView has to offer for 1H. Net profit is calculated using the Strategy Tester, with only long entries at Green triangles and exits at red triangles. Profit can be greater if you short Sell signals (red triangles). Commission used is 0.05%.
This strategy is going to be on my website later because it was commissioned by a customer and I had to publish it quickly. You can get access if you purchase the Cyatophilum Indicators. blockchainfiesta.com
I will publish an Alert Setup version soon.
Explosive PotentialThis script looks at times where MACD is within a specified range (very close to 0 values) and price action is very constrained (under 2%). Historically price has made a strong move after these conditions.
I typically run this on an 8H timeframe.
Review on BTCUSD and other cryptos.

My Custom indicator & Strategy for trading BTC in 5min UTHello,
If your goal is to make some BTC, this script might be for you.
I tested it on the ETH/BTC Binance chart.
About the indicator :
In short, it will help you for several things :
Avoid losing BTC when the trend goes bearish.
Earn BTC during any bullish trend.
Earn BTC when the market is in trading range by bouncing off trend lines, while anticipating a new potential trend.
I based my algorithm on several technical tools such as volume, RSI, pivot, for a total of 6 boolean conditions mixed together with AND and OR gates, resulting in those entry points (shapes)
About the Strategy :
I only used long entries and exits. No shorting.
The commission rate is set to 0.05% (binance)
The backtesting results in only 40€ of net profit for a 1000€ inital capital, it may seem litle BUT during the testing period (18 days, 40 trades) the coin (ETH) dropped in BTC value ( -25% ). You make 4% while a simple Holder would lose -25%, which is 29% difference.
Since I worked hard on this script, I'll grant access to only those willing to make a small donation, that'd really help me reach my goal of making a living with trading. I will also give you any info you want and give you everything need to set up alerts. Thank you very much.

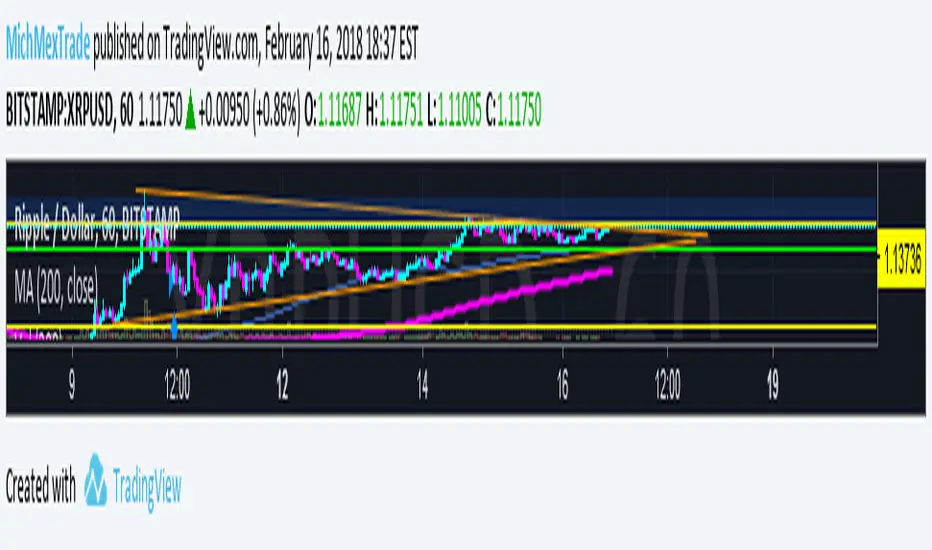
MA Cross CriptoEXLSimple Buy and Sell indicator for Cryuptos
Works way better:
XRPUSD - H1
BTCUSD - H4
ETHUSD - H4
With enough patience this indicator can make you good money!