Perfect Order Swing Signals✅ Pullback = Setup
✅ Perfect order = Filter
✅ Candle closing back through 20 EMA = Trigger
- Add other confirmations to your analysis before you enter a trade, dont go based just off the long & short signals.
- Now go make some bread $$
EURJPY

5-Minute YEN Pivot Bars 1.0The 5-Minute YEN Pivot Bars indicator is designed to identify and highlight low-range pivot bars on 5-minute charts, specifically tailored for Yen-based pairs (e.g., GBPJPY, USDJPY). By focusing on precise pip thresholds, this tool helps traders detect potential pivot points within specific trading sessions, while avoiding inside bars and other noise often seen in low-volatility conditions. This can be particularly useful for trend traders and those looking to refine their entry points based on intraday reversals.
Key Features:
- Customized Pip Thresholds for Yen Pairs:
The indicator is pre-configured for Yen pairs, where 1 pip is typically represented by 0.01. It applies these thresholds:
- Limited Range: 4 pips or less between open and close prices.
- High/Low Directionality: At least 3 pips from the close/open to the bar's high or low.
- Open/Close Proximity: 4 pips or less between open and close.
- Inside Bar Tolerance: A tolerance of 3 pips for inside bars, helping reduce false signals from bars contained within the previous bar's range.
- Session-Specific Alerts:
- The indicator allows you to enable alerts for the European Session (6:00-12:00), American Session (12:00-17:00), and London Close (17:00-20:00). You can adjust these times based on your own trading hours or timezone preferences via a time-shift setting.
- Receive real-time alerts when a valid bullish or bearish pivot bar is identified within the chosen sessions, allowing you to respond to potential trade opportunities immediately.
- Time Shift Customization:
- Adjust the "Time Shift" parameter to account for different time zones, ensuring accurate session alignment regardless of your local time.
How It Works:
1. Pivot Bar Identification:
The indicator scans for bars where the difference between the open and close is within the "Limited Range" threshold, and both open and close prices are close to either the high or the low of the bar.
2. Directional Filtering:
It requires the bar to show strong directional bias by enforcing an additional distance between the open/close levels and the opposite end of the bar (high/low). Only bars with this directional structure are considered for highlighting.
3. Exclusion of Inside Bars:
Bars that are completely contained within the range of the previous bar are excluded (inside bars), as are consecutive inside bars. This filtering is essential to avoid marking bars that typically indicate consolidation rather than potential pivot points.
4. Session Alerts:
When a valid pivot bar appears within the selected sessions, an alert is triggered, notifying the trader of a potential trading signal. Bullish and bearish signals are differentiated based on whether the close is near the high or low.
How to Use:
- Trend Reversals: Use this indicator to spot potential trend reversals or pullbacks on a 5-minute chart, especially within key trading sessions.
- Entry and Exit Points: Highlighted bars can serve as potential entry points for traders looking to capitalize on short-term directional changes or continuation patterns.
- Combine with Other Indicators: Consider pairing this tool with momentum indicators or trendlines to confirm the signals, providing a comprehensive analysis framework.
Default Parameters:
- Limited Range: 4 Pips
- High/Low Directionality: 3 Pips
- Open/Close Proximity: 4 Pips
- Inside Bar Tolerance: 3 Pips
- Session Alerts: Enabled for European, American, and London Close sessions
- Time Shift: Default 6 (adjustable to align with different time zones)
This indicator is specifically optimized for Yen pairs on 5-minute charts due to its pip calculation.

Mb Live Buy and Sell SignalsHello traders,
Today I am going to share with you an indicator I wrote by mixing other indicators to give me buy and sell signals. This indicators work on all FOREX pairs and Bitcoin , but it is less accurate on cryptocurrencies in general. The best result I have got is in 5 min chart with the default setting.
I have used RSI and its Moving Average to see if the market is getting saturated. If you have experience trading even for a bit, you realize trading with only RSI doesn't give you much, Hence I used Bollinger Band to find the market volatility, where its low and where it is high. Then I mixed these two to make a new indicator as you can see. For sake of this indicator, I made it as simple as possible with giving you less numbers to play with. The only thing you can play with are the RSI overbought, oversold and the middle line which I suggest let it be for Forex pairs. Also, you can play with timeframes if you would like to add a third indicator for yourself such as DC basis line which I use frequently with my other indicators . Unlike many buy and sell signals, This indicator does not work with trend and it is more based on market Volatility and strength of buyers and sellers (Oscillator) to give us PRZ . I did not want to share my script publicly as I spend lot of time mixing these indicators in different timeframes and different numbers but I hope you understand the basics behind the indicator and how it gives buy and sell signals.
For sake of time, I only did 100 back tests on EUR/JPY and here is the results.
ibb.co
The first trade was started on Oct 18th 2022 and last trade on Jan 6th 2023. That means in 83 days (including Sat and Sun) $1000 with risk to reward 2.5 became %5175. You have to consider it was only 100 back test and at least 300 back test is required for accurate result. There is a money management trick, which you exit %10 of the position at R/R 1 and bring the stop loss to the entry point, the second TP is R/R 2.5 which you exit the rest of the position. As you can see in the excel picture, instead of $5175 we have around $5625.
And now How I used this strategy to put my stop Loss. You can use Zig Zag as well if that makes it easier for you. I use price actions ,the last pivot or the nearest Support or resistance to put my stop loss a bit below (for buy signals) and above ( for sell signals). Here is an example:
you have to understand, you will trade with you money and you have to be critical and pessimistic. In backtests, if a trade hits your stop loss and then goes according the signals, Don't count it as a winning trade and put the emotions away. Here is an example:
If there is any question please write down in comment sections or contact me through social medias links.

Williams%R EMA CROSSESWilliams %R , also known as the Williams Percent Range, is a type of momentum indicator that moves between 0 and -100 and measures overbought and oversold levels. The Williams %R may be used to find entry and exit points in the market.
In this study, exponential moving averages are used in order to smooth out the false signals produced by Williams %R and to see more accurate signals.
In addition, it is aimed to see the divergences by using the moving averages of The Williams %R.
When the short exponential moving averages of Williams %R is above the longs, it may be a signal to think an uptrend will begin, and the long exponential moving averages of Williams %R is above the shorts, it may be a signal to think a downtrend will begin.
At the same time, a second check can be made for price movement with weighted moving averages.

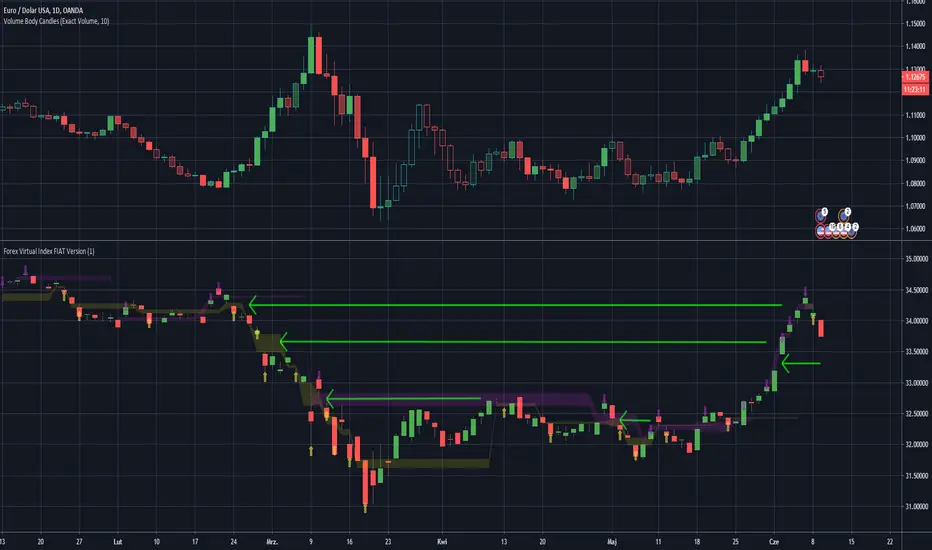
Forex Virtual Index FIAT VersionThis is virtually created FX Fiat pairs index based on OANDAs data.
Pairs are: EUR/USD , AUD/USD , GBP/USD , NZD/USD , AUD/JPY , EUR/JPY , GBP/JPY , USD/JPY , USD/CAD , USD/PLN
Be awared that some pairs like USD/CAD , have reversed correlation to the index.
You may look at the gaps as on standard S/R levels.
ps. Take look inside the scirpt's settings.
ps2. This script is invite-only for the members of our trading group (info in signature, group is free of charge).
USD/JPY/GBP/EUR merged from BTCxFIATBTC market 24h 365D (data from BitFinex BTCxFIAT)
BitUSDJPY = BTCJPY / BTCUSD
BitEURJPY = BTCJPY / BTCEUR
BitGBPJPY = BTCJPY / BTCGBP
BitEURUSD = BTCUSD / BTCEUR
BitGBPUSD = BTCUSD / BTCGBP
BitEURGBP = BTCGBP/ BTCEUR
It may complement the holiday time of forex
this indicator need to apply on BTC chart(virtual currency cahrt)

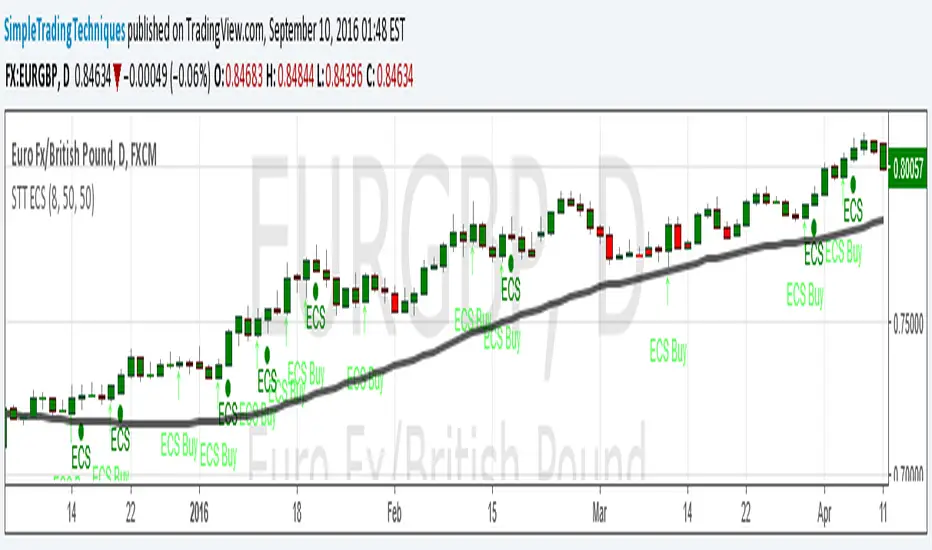
ENGULFING CANDLESTICK STRATEGY(i) Arrow represent trade setup
(ii) Circle represent triggering of the trade
--------------------------------------------------------------------
1. Where to place stop loss?
2. Where to exit the trade?
3. How to protect gains in your trade?
4. How to apply money management rule?
5. How to trade gap opening?
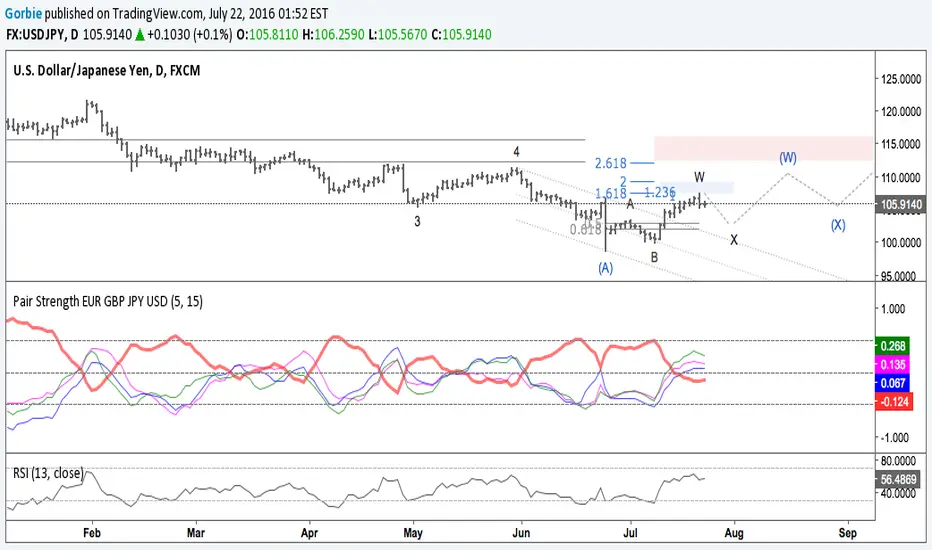
JPY GBP ROCsRate of change of most volatile JPY and GBP pairs. All pairs ending in JPY are red except GBPJPY (colored yellow --currently most volatile 7/2016). GBPNZD is blue, the other GBP pairs are green, lime and teal. GBPJPY and GBPNZD are my favorite day trading / swing trading pairs. This script allows me to see the action of the most volatile and liquid pairs on one screen. JPY pairs (ex-GBPJPY) are all red so that I see the flow of JPY not so much each pair and its name. Global movement of JPY is what I am after. Same for the coloring of GBP pairs as green expect GBPNZD as blue. ***** EURGBP is plotted as an opposite (with a negative in front of its sma. EURGBP is extremely correlated to GBPNZD, I decided to plot it also.