Kalman Filter Trend BreakersThe Kalman filter is a recursive algorithm developed in 1960 by Rudolf E. Kálmán, a Hungarian-American engineer and mathematician, that provides optimal estimates of a system's state by combining noisy measurements with a predictive model. It is widely used in control systems, signal processing, and finance for tracking and forecasting.
In trading, KF might be a good replacement for a moving average, as it reacts to price changes in a different way. Not only it follows price direction, but can also track the velocity of price change. This specific behaviour of KF is used in this indicator to track changes in trends.
Trend is characterized by price moving directionally, however, any trend comes to pause or complete stop and reversal, as the price changes more slowly (a trend fades into a sideways movement for a while) or the price movement changes direction, thus making a reversal.
This indicator detects the points where such changes occur (trend breaker points), and produces signals, which serve as points of current trend pausing or reversing. By applying different settings for KF calculation, you can produce less or more signals that indicate change in trend character, and either detect only significant trends changes, or less and shorter trends changes as well.
The signals do not differentiate the exact type of a trend change (it can be a brief trend pause followed by a continuation, as well as a complete reversal). However, once you are in a trend, the significant velocity change indicates a change in trend structure. In this sense, trend breaker signals should not be followed blindly, and can be used only as trend (and subsequently, position) exit confirmations, but not the entry contrarian confirmations.
For better visual representation, you can use chart signals attached to bars, and additionally paint a vertical gradient at each signal which shows significant trend deceleration.
Kalman filter calculations used in this indicator are partially based on an open-source code from @loxx which was published in 2022 as Kalman filter overlay .
Exitsignal

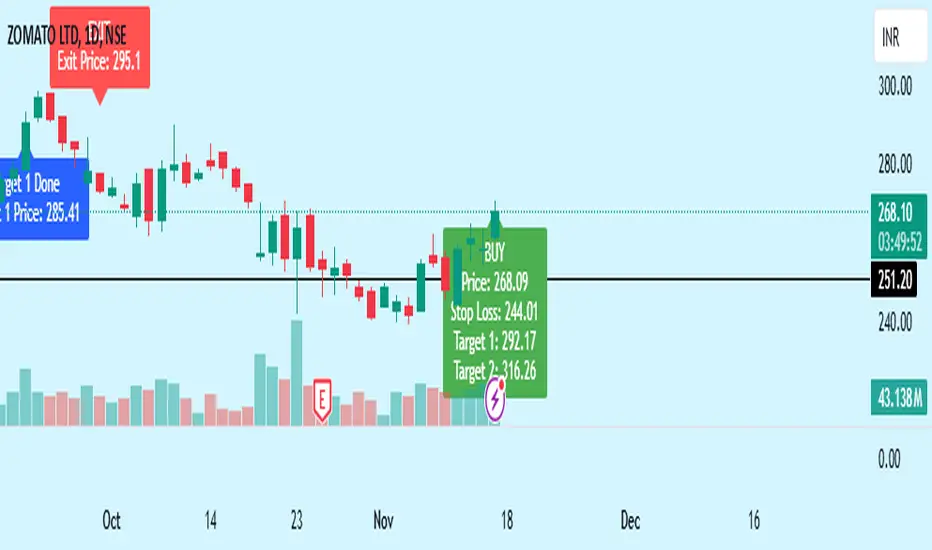
Bewakoof stock indicator**Title**: "Bewakoof Stock Indicator: Multi-Timeframe RSI and SuperTrend Entry-Exit System"
---
### Description
The **Bewakoof Stock Indicator** is an original trading tool that combines multi-timeframe RSI analysis with the SuperTrend indicator to create reliable entry and exit signals for trending markets. This indicator is designed for traders looking to follow strong trends with built-in risk management. By filtering entries through short- and long-term momentum and utilizing dynamic trailing exits, this indicator provides a structured approach to trading.
#### Indicator Components
1. **Multi-Timeframe RSI Analysis**:
- The Relative Strength Index (RSI) is calculated across three timeframes: Daily, Weekly, and Monthly.
- By examining multiple timeframes, the indicator confirms that trends align over short, medium, and long-term intervals, making buy signals more reliable.
- **Buy Condition**: All three RSI values must meet these thresholds:
- **Daily RSI > 50** – indicates short-term upward momentum,
- **Weekly RSI > 60** – signals medium-term strength,
- **Monthly RSI > 60** – confirms long-term trend alignment.
- This filtering process ensures that buy signals are generated only in stable, upward-trending markets.
2. **SuperTrend Confirmation**:
- The SuperTrend (20-period ATR with a multiplier of 2) acts as a trend filter and trailing stop mechanism.
- For a buy condition to be valid, the closing price must be above the SuperTrend level, verifying that the market is trending up.
- The combination of RSI and SuperTrend helps to avoid false signals, focusing only on well-established trends.
#### Trade Signals
- **Buy Signal**: When both the multi-timeframe RSI and SuperTrend conditions are met, a buy signal is triggered, indicated by a “BUY” label on the chart with details:
- **Entry Price**,
- **Initial Stop-Loss** (set at the SuperTrend level for risk control),
- **Target 1** – calculated with a 1:1 risk-reward ratio based on the initial stop-loss,
- **Target 2** – calculated with a 1:2 risk-reward ratio based on the initial stop-loss.
- **Exit Signals**: This indicator provides two exit strategies to protect profits:
1. **Fixed Stop-Loss**: Automatically set at the SuperTrend level at the time of entry to limit risk.
2. **Trailing Exit**: Exits are triggered if the price crosses below the SuperTrend level, adapting to potential trend reversals.
#### Labeling & Alerts
The **Bewakoof Stock Indicator** offers intuitive labeling and alert options:
- **Labels**: Buy and exit points are clearly marked, showing entry, stop-loss, and targets directly on the chart.
- **Alerts**: Custom alerts can be set for:
- **Buy signals** when both conditions are met, and
- **Exit signals** triggered by the stop-loss or trailing exit.
#### Use Case and Benefits
This indicator is ideal for trend-following traders who value risk control and trend confirmation:
- **Stronger Trend Signals**: By requiring RSI alignment across multiple timeframes, this indicator focuses only on trades with strong trend momentum.
- **Dynamic Risk Management**: Using both fixed and trailing exits enables flexible trade management, balancing risk and potential reward.
- **Simple Trade Execution**: The chart labels and alerts simplify trade decisions, making it easy to enter, manage, and exit trades.
#### How to Use
1. **Add** the Bewakoof Stock Indicator to your chart.
2. **Watch** for the "BUY" label as your entry point.
3. **Manage the trade** using the labeled stop-loss and target levels.
4. **Exit** on either a stop-loss hit or when the price crosses below the SuperTrend for a trailing exit.
The **Bewakoof Stock Indicator** is a complete solution for trend-following traders, combining the strength of multi-timeframe RSI with the SuperTrend’s trend-following capabilities. This systematic approach aims to provide high-confidence entries and effective risk management, empowering traders to follow trends with precision and control.
ATR Range Pivot LinesDescription:
This Pine Script calculates and plots pivot lines based on ATR (Average True Range) value and closing price. It uses the previous trading day's ATR value to set static pivot levels for the current trading day. These pivot lines help traders identify potential support and resistance levels based on historical volatility. The script includes two main pivot lines—ATR High and ATR Low —and two midpoint lines between them for additional context. Labels are added to show the exact pivot values, with options to customize label positions.
Intended Use:
The script is designed to help traders forecast potential price ranges for the current trading day based on the previous day’s volatility. By adding and subtracting the previous day's ATR from the prior close, the script identifies key levels where price action may encounter support or resistance. It is useful for setting realistic price targets or entry/exit points. Since the ATR-based pivot lines are static for the entire day, they provide a reliable range for intraday trading strategies.
Disclosure:
This script was generated using AI. It is recommended to review and test the script thoroughly before applying it in live trading scenarios.

Johnny's Moving Average RibbonProps to Madrid for creating the original script: Madrid Moving Average Ribbon.
All I did was upgrade it to pinescript v5 and added a few changes to the script.
Features and Functionality
Moving Average Types: The indicator offers a choice between exponential moving averages (EMAs) and simple moving averages (SMAs), allowing users to select the type that best fits their trading strategy.
Dynamic Color Coding: Each moving average line within the ribbon changes color based on its direction and position relative to a reference moving average, providing visual cues for market sentiment and trend strength.
Lime Green: Indicates an uptrend and potential long positions, shown when a moving average is rising and above the longer-term reference MA.
Maroon: Suggests caution for long positions or potential short reentry points, displayed when a moving average is rising but below the reference MA.
Ruby Red: Represents a downtrend, suitable for short positions, shown when a moving average is falling and below the reference MA.
Green: Signals potential reentry points for downtrends or warnings for uptrend reversals, displayed when a moving average is falling but above the reference MA.
Usage and Application
Trend Identification: Traders can quickly ascertain the market's direction at a glance by observing the predominant color of the ribbon and its orientation.
Trade Entry and Exit Points: The color transitions within the ribbon can signal potential entry or exit points, with changes from green to lime or red to maroon indicating shifts in market momentum.
Customization: Users have the flexibility to toggle between exponential and simple moving averages, allowing for a tailored analytical approach that aligns with their individual trading preferences.
Technical Specifications
The ribbon consists of multiple moving averages calculated over different periods, typically ranging from shorter to longer-term intervals to capture various aspects of market behavior.
The color dynamics are determined by comparing each moving average to a reference point, often a longer-term moving average within the ribbon, to assess the relative trend strength and direction.

RSI of Zero Lag MA (ValueRay)The RSI of a Zero Lag Moving Average a powerful tool for for reliable exit signals.
The Relative Strength Index (RSI) is a widely recognized momentum oscillator that measures the speed and change of price movements. It provides valuable insights into overbought and oversold conditions, enabling traders to identify potential reversal points and take advantage of market inefficiencies.
The RSI of a Zero Lag Indicator takes this concept a step further by incorporating the Zero Lag Moving Average. The Zero Lag Moving Average is a cutting-edge indicator that minimizes lag and provides a smoother representation of price action, allowing for quicker and more precise responses to market movements.
By combining the RSI with the Zero Lag Moving Average, this indicator offers traders a superior exit strategy. When the RSI reaches extreme levels of overbought or oversold conditions, it indicates a potential reversal in the market. The Zero Lag Moving Average further enhances this signal by reducing delays and providing timely exit points.
Moreover, the RSI of a Zero Lag Indicator is not limited to mean reversion strategies. While it excels in identifying mean reversion opportunities, it can also be used in conjunction with other trading approaches. Traders can take advantage of its objective signals to exit trades profitably, regardless of their chosen strategy.
With its ability to accurately pinpoint overbought and oversold conditions, the RSI of a Zero Lag Indicator offers traders a competitive edge in the market. By providing timely exit signals and minimizing lag, it helps traders optimize their trading decisions and increase their chances of success.

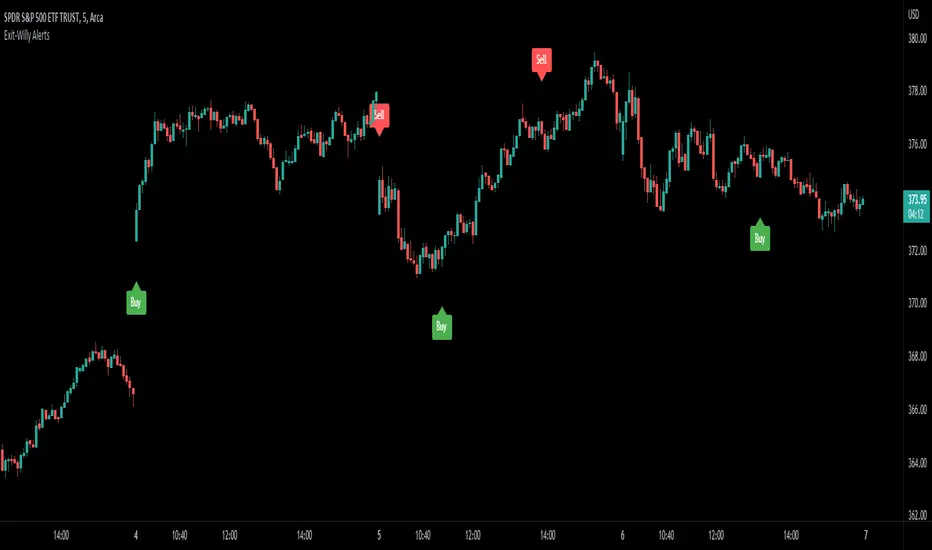
Exit-Willy AlertsThis is the Exit-Willy indicator. It issues Buy and Sell signals based on exit data from different moving averages and the Williams Percent R. It also has a LSMA filter. All values are adjustable. I like to use it with a higher Exit value being as it filters some of the false signals. There are multiple different settings to change and alter.
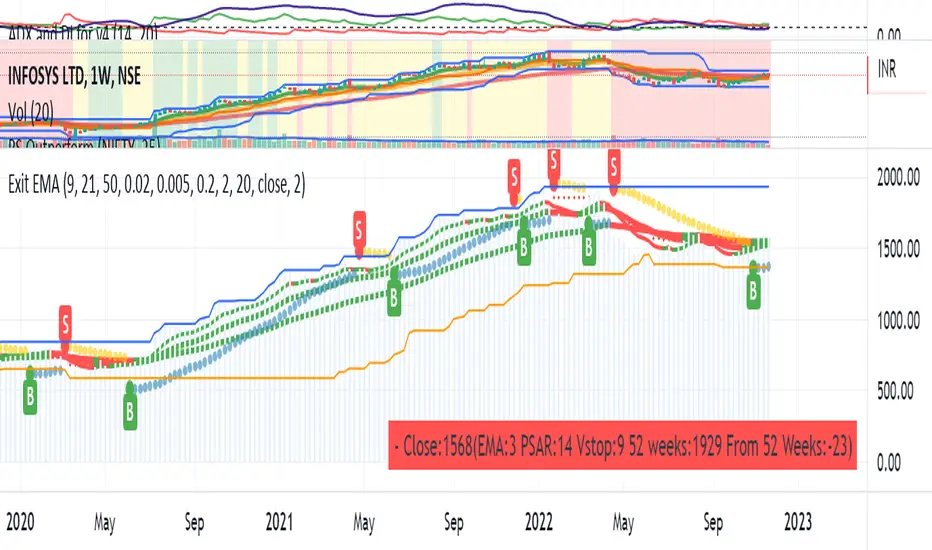
Consolidated IndicatorI have attempted to combine all the parameters to decide on the entry and exit points for stocks. The indicator combines
1) EMAs
2)PSAR
3)ATR
The script also attempts to show the risk-reward
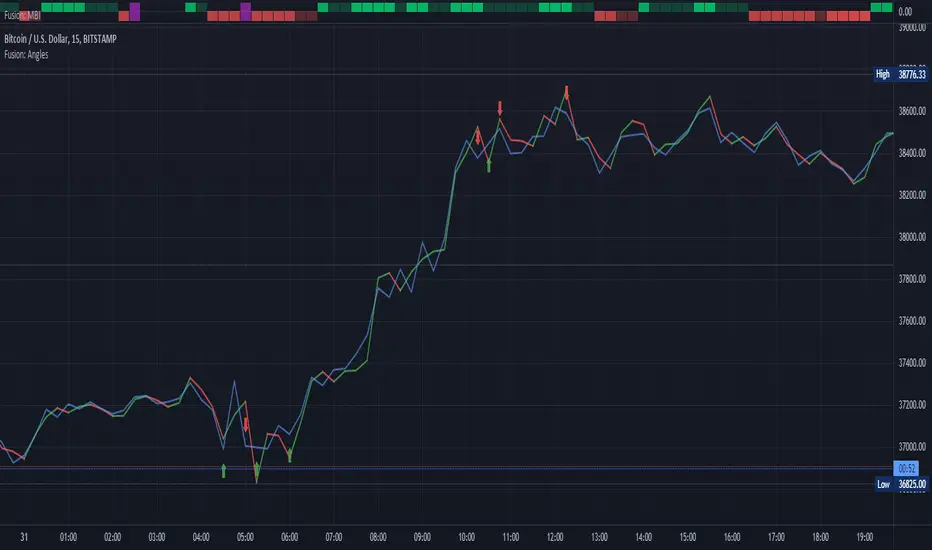
Fusion: Pivot Angles and ThresholdsThis is a somewhat unusual indicator working purely on geometry.
You set a threshold for an angle of a pivot and if the angle is LESS THAN (because the sharper the pivot the smaller the angle) your threshold then a signal is given.
I use this as an exit indicator and it works well for me when other methods don't give a clear signal. Seeing where it shows up it might also make a good entry indicator but I'll leave it up to others to play with that and see if it's a good entry indicator for them. If you find it is good for entries or other things please drop me a note or make a comment, I would appreciate knowing.
If you set the length to 1 for the moving average then it will just use the source and not perform a moving average operation.
There's half a dozen or so moving average types to select from so you will probably find one that suits you pretty well.
The settings are certainly not optimized so set to whatever suits your needs as my defaults will probably be wrong for you.
The code is structured to easily drop into a bigger system so use it as a lone indicator or add the code to some bigger project you are creating. If you do integrate it into something else then send me a note as it would be nice to know it's being well used.
Finally, if you find value please do make a comment, give a thumbs up etc.
Enjoy and good luck!
DCA RSI Add funds exit simulatorThis script helps with planning on how to exit DCA deals that are in the negative.
The following deal information is required
- Current average position price
- Funds invested
- Required take profit
Additional indicator settings are
- The date/time on which to start the simulator
- Minimum deviation % to start adding funds
- Expected bounceback from when funds are added
The RSI trigger
Adding funds is triggered when the selected RSI settings yield a value that is at or beyond the selected threshold.
How it works
The amount of funds needed are calculated based on the supplied settings, such that the new average price matches the expected bounceback.
It will also show if the exit strategy has failed to hit the TP (this happens when the RSI threshold is hit again)

+ REX OscillatorSo, what is the REX oscillator, you might be asking yourself.
"The Rex oscillator is an indicator that measures market behavior based on the relationship of the close to the open, high and low values of the same bar. A big difference between the high and close on a bar indicates weakness, and wide disparity between the low and close indicates strength. The difference between open and close also indicates market performance."
The True Value of a Bar (TVB) gives an indication of how healthy the market is. A negative close and a positive TVB (or vice versa) is an indication of the market building strength on the opposing side of the trend. The Rex oscillator is a moving average of the TVB value with the specified period.
I first came across this watching one of many No Nonsense Forex videos. Mostly, from comments I've read, it is used as an exit indicator for people who trade with a system similar or identical to the one VP espouses in his NNFX blog. I think it's perfectly apt to use as an entry indicator as well, or even as both, perhaps, depending on the moving average you chose to apply to the TVB.
There are a few other versions of this on tradingview, but I thought I'd make an updated version. Added Donchian Channels because I like the idea of a dynamic sort of overbought/sold area. I left out the basis because the indicator pivots around a center line, and has a signal line as well. A basis line just seemed like too much, and would likely not be very useful.
The additional usual things that I incorporate into my indicators are included here: optional candle coloring, alerts, and probably a too large selection of moving averages.
Credit to Nemozny for the FRAMA calculation. I may add that to other indicators I have.

Ultimate Buy/Sell IndicatorAn Indicator based on the William Alligator, helping to find suitable entry and exit points.

SNAP BACK 2.0 Strategy
This strategy is designed to allow you to catch the bounce or "SNAP Back" of an equity that has been in a trend.
1) Once the moving averages are in the order of 200SMA > 50 SMA > 34EMA > 20SMA > 8EMA (or reverse for and uptrend), the strategy is setup.
2) Next you wait for a trigger of the closing price crossing the 8EMA, while there is a desired gap size between the 8EMA and the 20SMA (2-10% of stock value preferred).
3) Exit position based on target profit reached (conservative sell half at 34EMA and engage a trailing stop loss for remainder or set static limit) or price crosses 8EMA or stop loss%
*)This code also allows you to determine your desired backtesting date compliments of alanaster
This code is the product of many hours of hard work on the part of the greater tradingview community. The credit goes to everyone in the community who has put code out there for the greater good.
The idea for the coding came from a video I watched on YouTube presented by TradeStation called Snap Back - thank you guys for the inspiration.
UPDATE: I have coded the other side of the strategy to allow you to take advantage of the same set-up in an uptrend for Short plays. You can turn the up or downsides on, off, or both.
The main intent is to catch the bounces of a falling stock. However, I have found that you can do the inverse and catch the drops in a rising stock (the latter is not as reliable). This also tends to work better on less volatile stocks. I have included a large volume of user defined conditions and display entry and exit conditions on the chart to see how your choices are impacting the script.

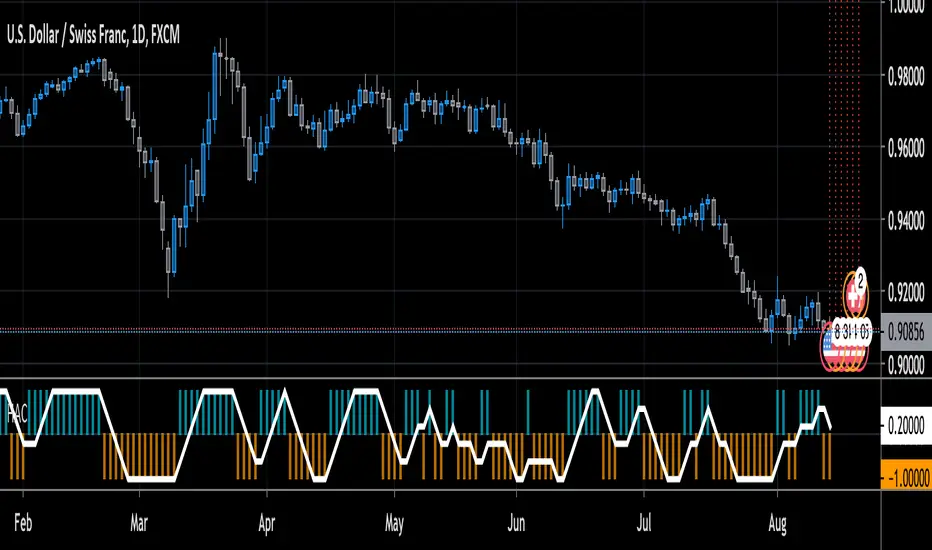
Heiken-Ashi Color Vts// Simple as it says:
// gives you the color of the Heiken Ashi candles in a separate panel.
// I needed this indicator since in TV switching from HA to normal candles resets the chart and I had to go back manually.
// This solves the nasty issue.
// Moreover, nobody enters/exits the trade on the HA values but everyone uses just their color, right?
// Since bearish candles are encoded with value -1 and bullish candles with +1,
// a simple average can be defined (if you don't find it useful, disable it).
// Vitelot-Yanez-Vts, Aug 2020
//
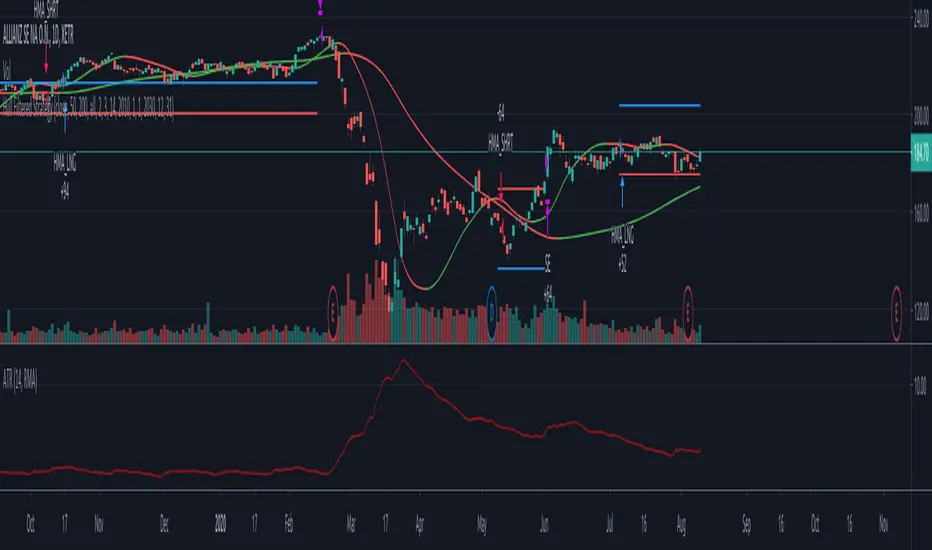
Hull Moving Average based strategyThis is a simple Hull Moving Average based strategy using a short term HMA for signal generation and a long term HMA for filtering purposes.
A long entry is generated if the short term HMA changes direction from decreasing to increasing values and if the long term HMA indicates an uptrend (i.e. previous value < current value)
A short entry is generated if the short term HMA changes direction from increasing to decreasing values and if the long term HMA indicates a downtrend (i.e. previous value > current value)
Positions are closed using an ATR based stop loss/take profit system. Stop Loss (red) and Take Profit (blue) levels are plotted on the chart.
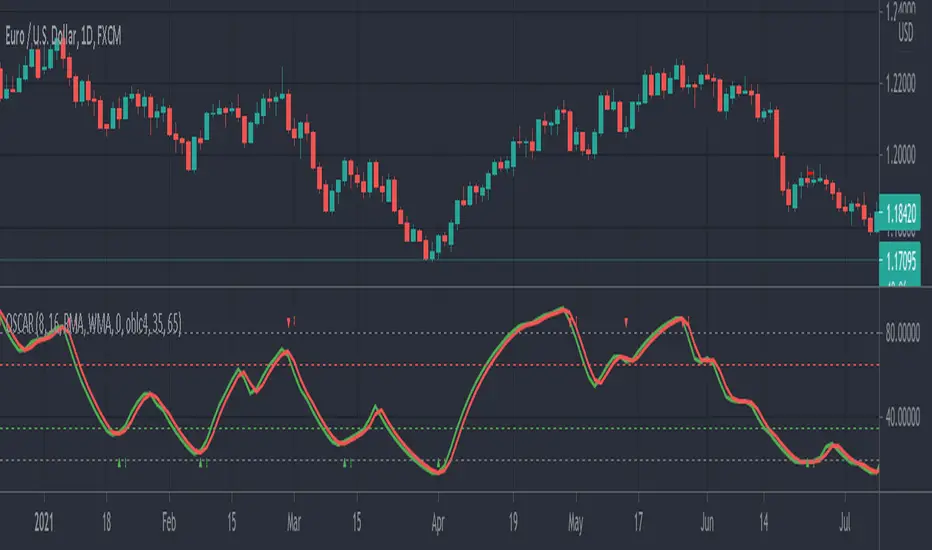
OSCAR Oscillator by GenZai - NNFXOSCAR Oscillator by GenZai
Green line is the Oscar Rough
Red line is the Oscar
By default based on the 8 last candles and smoothed using RMA
Purple line is the Slow Oscar
By default based on the 16 last candles and smoothed using WMA
HOW TO USE
Exit signaling
This indicator can be used as an exit indicator when line cross each other.
Entry signaling
When the green line crosses up, it indicates a long entry
When the red line crosses up, it indicates a short entry
Overbought/Oversold
When the indicator crosses the dashed grey lines it indicates Overbought Oversold
Slow Oscar Add-on
This is an Add-on to the orignal Oscar indicator
Can be hidden if you want the original experience of the Oscar indicator.
Can be used as a confirmation indicator by looking at the direction of the slope to verify is your are trending long or trending short.
Can be used as a baseline to confirm signals given by Oscar
Can be used to tweak your signals and test different settings.
Stock or Forex?
The program was originally written for stocks, but works equally well with the Forex market.
How this indicator is calculated ?
This is the formula we use to calculate the Oscar:
let A = the highest high of the last eight days (including today)
let B = the lowest low of the past eight days (including today)
let C = today's closing price
let X = yesterday's oscillator figure (Oscar)
Today's "rough" oscillator equals (C-B) divided by (A-B) times 100.
Next we "smooth" our rough number (let's call it Y) like this:
Final oscillator number = ((X divided by 3) times 2), plus (Y divided by 3).
SETTINGS:
You can choose between different smoothing options:
RMA: Moving average used in RSI. It is the Adjusted exponential moving averages (also known as Wilder's exponential moving average)
SMA : Simple moving average
EMA : Exponential moving average
WMA : Weighted moving average
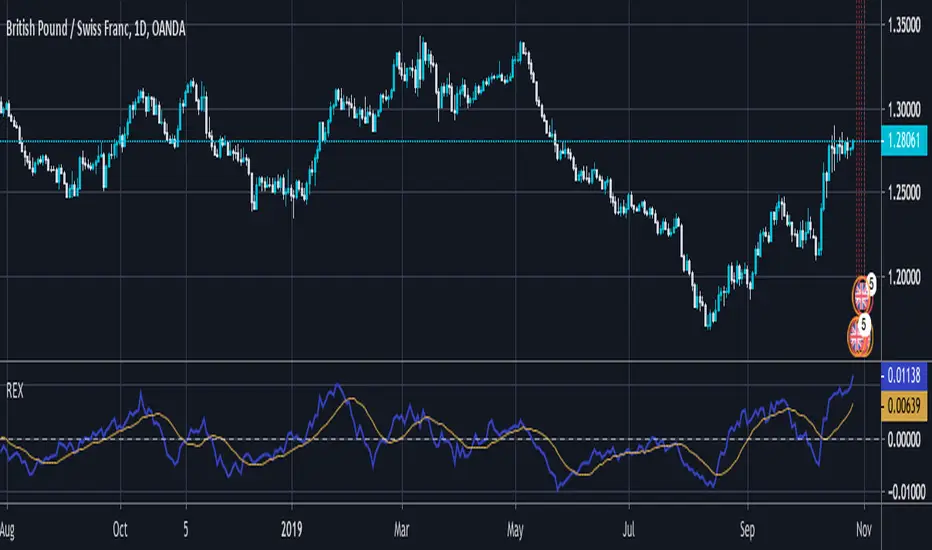
REX by vitelot// Best used as an exit indicator at default settings.
// Also doing well in entering positions by using TEMA(14) for REX and SMA(14) as signal.
// You need to tune it yourself according to your trading style.
// Use at your own risk.
//
// Vitelot/Yanez/Vts Oct 2019
//
Modified Gann HiLo ActivatorIntroduction
The gann hilo activator is a trend indicator developed by Robert Krausz published into W. D. Gann Treasure Discovered: Simple Trading Plans for Stocks & Commodities . This indicator crate a trailing stop aiming to show the direction of the trend.
This indicator is fairly easy to compute and dont require lot of skills to understand. First we calculate the simple moving average of both price high and price low, when the close price is higher than the moving average of the price high the indicator return the moving average of the price low, else the indicator return the moving average of the price high if the close price is lower than the moving average of the price low.
My indicator add a different calculation method in order to avoid whipsaw trades as well as adding significance to the moving average length. A Median method has been added to provide more robustness.
The Indicator
The indicator is a simple trailing stop aiming to show the direction of the trend. The indicator use a different source instead of the price high/low for its calculation. The first method is the "SMA" method which like the classic hilo indicator use a simple moving average for the calculation of the indicator.
Sma Method with length = 25
The "Median" use a moving median instead of a simple moving average, this provide more robustness.
Median Method with length = 25
The shape is less curved and the indicator can sometimes avoid whipsaw with high's length periods.
Mult Parameter
The mult parameter is a parameter set to be lower or equal to 1 and greater or equal to 0. High values allow the indicator to be far from the price thus avoiding whipsaw trades, lower ones lower the distance from the price. A mult parameter of 0.1 approximate the original hilo indicator.
In blue the indicator with mult = 0.1 and in radical red the original hilo activator.
Conclusion
The modifications allow more control over the indicator as well as adding more robustness while the original one is destined to fail when market price is more complex.
Thanks for reading :)
For any questions/suggestions feel free to pm me

Relative Body Indicator by VtsRBI:
The EMA of the relative body (RB) of Japanese candles is evaluated.
The RB of a candle (my definition) is simply the ratio of the body with respect to its full length
and taken positive for bull candles and negative for bear candles:
e.g. a bull "marubozo" has RB=1 a bear "marubozo" has RB=-1;
a "doji" has RB=0.
This simple indicator grasps the essence of the market by filtering out a great deal of noise.
A flag can be selected to calculate its very basic binary version, where a bull candle counts as a one
and a bear candle counts as a minus one.
Enter (or exit) the market when the signal line crosses the base line.
When the market is choppy we have a kind of alternating bear and bull candles so that
RBI is FLAT and usually close to zero.
Therefore avoid entering the market when RBI is FLAT and INSIDE the Exclusion level.
The exclusion level is to be set by hand: go back in history and check when market was choppy; a good
way to set it is to frame the oscillations of RBI whe price was choppy.
RBI is more effective when an EMA of price is used as filtering. I found EMA(13) to be
a decent filter: go long when base crosses signal upwards AND closing price is above EMA(13);
same concept for going short.
As any other indicator, use it with responsibility: THERE CAN'T BE A SINGLE MAGIC INDICATOR winning
all trades.
Above all, have fun.
Vitelot/Yanez/Vts March 31, 2019
Note: I'm not aware of any indicator like this. My apologies to whoever had this idea before me.

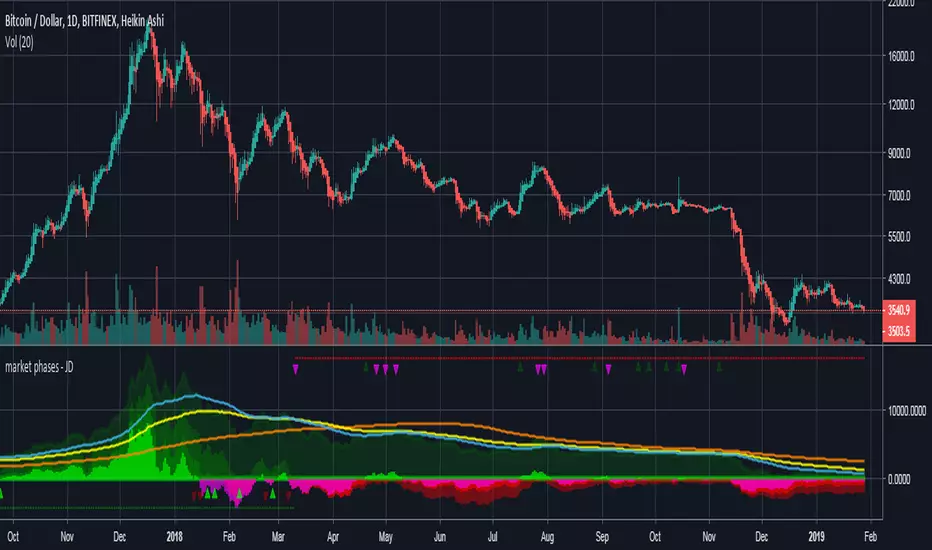
market phases - JDThis indicator shows the relation of price against different period ma's.
When put in daily Timeframe it gives the 1400 Day (= 200 Weekly) and the 200 ,100 an 50 Daily.
The lines show the 200,100 and 50 ma in relation to the 1400 ma.
JD.
#NotTradingAdvice #DYOR
Exit Strategy is important than Entry Strategy!Exit Strategy is important than Entry Strategy!
Simple strategy get large profit!
