Adaptive Squeeze Momentum +OVERVIEW
Adaptive Squeeze Momentum+ is an enhanced, auto-adaptive momentum indicator inspired by the classic Squeeze Momentum concept. This script dynamically adjusts its parameters to any timeframe without requiring manual inputs, making it a versatile tool for intraday traders and long-term investors alike.
CONCEPTS
The indicator combines Bollinger Bands (BB) and Keltner Channels (KC) to identify volatility compression ("squeeze") and expansion phases. When BB contracts within KC, a squeeze is detected, signaling reduced volatility and potential for a breakout. Additionally, a linear regression momentum calculation helps assess the strength and direction of price moves.
FEATURES
Auto-Adaptation:
Automatically adjusts BB/KC lengths and multipliers based on the chart timeframe (from 1 minute to 1 month).
Dynamic Squeeze Detection:
Clear visual encoding of squeeze status:
- Gray cross: neutral
- Blue cross: squeeze active
- Yellow cross: squeeze released
Momentum Histogram:
Colored area chart shows positive and negative momentum with slope-based coloring.
Clean Visualization:
Minimalist plots focused on actionable signals.
USAGE
Identify Squeeze Phases:
When the blue cross appears, the market is in a volatility squeeze, potentially preceding a breakout.
Monitor Momentum Direction:
The area plot shows the magnitude and direction of price momentum.
Confirm Entries and Exits:
Combine squeeze releases (yellow) with positive momentum for potential long entries or negative momentum for shorts.
Adaptable to Any Market:
Works seamlessly across cryptocurrencies, stocks, forex, and indices on all timeframes.
Expansion

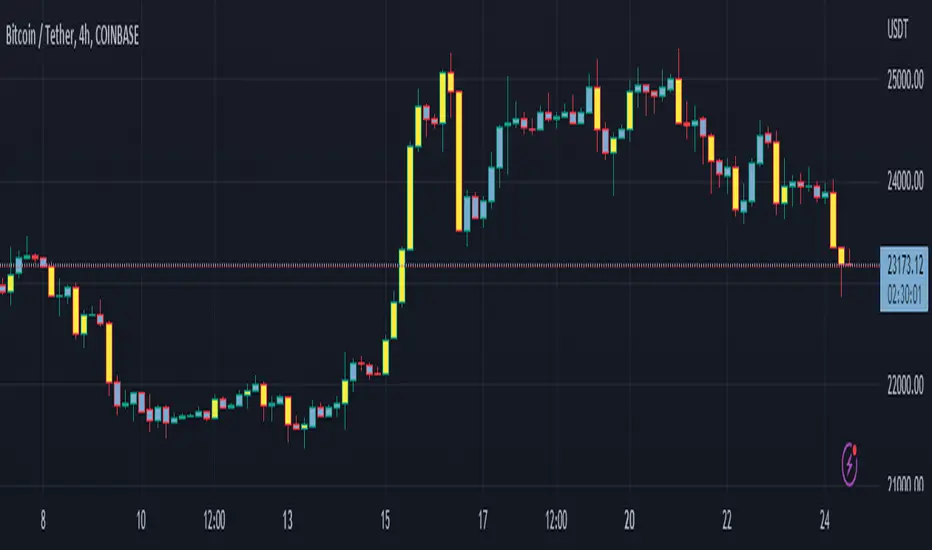
Expanded Cloud [LuxAlgo]The Expanded Cloud tool allows traders to identify and follow trends accurately. It is based on the well-known Donchian Channels, but with enhanced features.
It features a trailing cloud that expands with the price and a trading stats dashboard.
🔶 USAGE
The tool is super easy to use. Traders can identify bigger or smaller trends just by adjusting the length from the settings panel.
Trend identification is based on Donchian Channels. An uptrend is indicated when the cloud is located below the price, while a downtrend is indicated when the cloud is above it.
Dots signal the start of a new trend, and the width of the clouds identifies the strength of the price expansion. The wider the cloud, the bigger the move.
The expanded cloud, due to its visual, can also act as a trailing stop.
🔹 Trend Identification
As we can see in the chart above, different length values identify different trends on the same BTC daily chart. Larger values identify larger trends.
🔹 Cloud Expansion
From the settings panel, traders can adjust how the clouds expand based on the Expansion % parameter. It accepts values from 0 to 100, which controls how much of the expansion is taken into account. Higher values will make the cloud expand and get closer to the price faster.
When the cloud moves opposite to the direction of the indicated trend (e.g: the cloud decreases while being below the price), it is often indicative of the end of a retracement, and we can expect the price to move with the indicated trend.
The chart above shows the effect of different Expansion % values.
🔹 Dashboard
The trading statistics dashboard informs traders of key metrics derived from the tool. The following are notable:
PNL: Theoretical profit or loss from all trends identified by the tool in the right scale units.
EXPECT.: Expected value of each trade. It is derived from win rate and risk-to-reward metrics.
AVG: 1st TOUCH: The average number of bars from the beginning of a new trend until the price touches the cloud for the first time.
🔶 SETTINGS
Length: Length for trend detection
Expansion %: Percentage of price expansion for cloud formation
Source: Source of the data
🔹 Dashboard
Show Dashboard: Enable/disable the statistics dashboard
Location: Dashboard location
Size: Dashboard size

Volatility Price FlowCapitalize on market volatility with our new volatility price flow indicator. We have designed this indicator to process historical price movements and indicate when price may have reached exhaustion in the context of current volatility.
This is achieved by taking the price deviation from a user defined moving average, and applying a weighting to the deviations from the candle body and candle wick on both buy side and sell side, over a user defined period. The period of the base moving average, type of moving average and the period of the historical price deviations can all be modified. This creates a typical 'band' style indicator, though with a unique characteristic that the buy and sell side vary independently as well as the band expansion being based on weighted variables tied to the actual price changes, rather than just a standard deviation the moves uniformly.
Additionally, these bands can be merged with an anchored vwap - we do this so that the deviations of price from the moving average can include a more volume based approach to identifying potential pivots.
The end result is an indicator that reflects the current market price movements, identifies and capitalizes on impulsive or beginning moves to indicate potential tops / bottoms / reversals.
The signals are simple - anytime price closes within a band, having been outside the band, a signal is displayed. As a basic guide to setting the indicator up for the first time, we suggest reducing all of the multipliers to a value less than 1. Then gradually increase each one, until the signals reduce in quantity and improve in quality, starting with the price deviation multiplier, then the volatility multiplier and finally the expansion multiplier.
Last of all, alerts can be created based on the current chart timeframe and indicator settings, simply by adding an alert that uses the built in buy or sell signal.
Note: We cannot guarantee the accuracy of the signals provided, since the user creates the signals by modifying the settings, and as such we can take no responsibility for any trading losses incurred using the indicator and highly encourage all users to manage their risk and only risk what you can afford to lose.

Candlestick DataCandlestick Data Indicator
The Candlestick Data indicator provides a comprehensive overview of key metrics for analyzing price action and volume in real-time. This overlay indicator displays essential candlestick data and calculations directly on your chart, offering an all-in-one toolkit for traders seeking in-depth insights.
Key Features:
Price Metrics: View the daily high, low, close, and percentage change.
Volume Insights: Analyze volume, relative volume, and volume buzz for breakout or consolidation signals.
Range Analysis: Includes closing range, distance from low of day (LoD), and percentage change in daily range expansion.
Advanced Metrics: Calculate ADR% (Average Daily Range %), ATR (Average True Range), and % from 52-week high.
Moving Averages: Supports up to four customizable moving averages (EMA or SMA) with distance from price.
Market Context: Displays the sector and industry group for the asset.
This indicator is fully customizable, allowing you to toggle on or off specific metrics to suit your trading style. Designed for active traders, it brings critical data to your fingertips, streamlining decision-making and enhancing analysis.
Perfect for momentum, swing, and day traders looking to gain a data-driven edge!

Exponential Grid [Phi, Pi, Euler]If you disagree with one of the EMH principles that price is too random, then by definition you must agree that historic price has deterministic function to a scenario ahead.
I personally believe that constants like phi, pi and e can mimic exponential growth of the price.
In this script, first grid is based on the Lowest price multiplied with self fraction of the constant.
For example:
If you are familiar with fib ratio 1.272, then you must know that it is 1.618 to the power of 0.5.
With default settings of exponent step 0.25
First grid = Lowest price x phi^0.25
Second grid = Lowest price x phi^0.25x2
Third grid = Lowest price x phi^0.25x3 and so on
The script will automatically find the lowest price and update the grid values.
Or you can set up your custom Lowest price manually if you feel like the All Time Low level loses its relevance value after long period.
There are 64 grids including Lowest price level. And it wasn't by a chance. Pine Script has a limitation of max 64 plots. Number of grids shown in the chart depends on the highest price. Once price breaks above ATH a couple of next grids will be plotted automatically. In most cases if everything is plotted, the chart appears squeezed and you'll need to zoom in to see it. Therefore, I adjusted it relatively to the scale of the chart for the comfort.
In some cases 64 plots aren't enough to cover the whole chart. For example, let's take a look at NVIDIA chart:
Since the price has started with 0.0333, it is way too small to cover all with default settings.
We are left with 2 choices:
Either Enable "Round"
OR increase Exponent Step (from 0.25 to 0.5 in the particular example below)
If you set constant to pi or e which is a bigger number than phi, expect the gaps to be bigger. To reduce it to a more gradual way of expansion you can decrease Exponent Step.

ICT Macros [LuxAlgo]The ICT Macros indicator aims to highlight & classify ICT Macros, which are time intervals where algorithmic trading takes place to interact with existing liquidity or to create new liquidity.
🔶 SETTINGS
🔹 Macros
Macro Time options (such as '09:50 AM 10:10'): Enable specific macro display.
Top Line , Mid Line , Bottom Line and Extending Lines options: Controls the lines for the specific macro.
🔹 Macro Classification
Length : A length to detect Market Structure Brakes and classify macro type based on detection.
Swing Area : Swing or Liquidity Area selection, highest/lowest of the wick or the candle bodies.
Accumulation , Manipulation and Expansion color options for the classified macros.
🔹 Others
Macro Texts : Controls both the size and the visibility of the macro text.
Alert Macro Times in Advance (Minutes) : This option will plot a vertical line presenting the start of the next macro time. The line will not appear all the time, but it will be there based on remaining minutes specified in the option.
Daylight Saving Time (DST) : Adjust time appropriate to Daylight Saving Time of the specific region.
🔶 USAGE
A macro is a way to automate a task or procedure which you perform on a regular basis.
In the context of ICT's teachings, a macro is a small program or set of instructions that unfolds within an algorithm, which influences price movements in the market. These macros operate at specific times and can be related to price runs from one level to another or certain market behaviors during specific time intervals. They help traders anticipate market movements and potential setups during specific time intervals.
To trade these effectively, it is important to understand the time of day when certain macros come into play, and it is strongly advised to introduce the concept of liquidity in your analysis.
Macros can be classified into three categories where the Macro classification is calculated based on the Market Structure prior to macro and the Market Structure during the macro duration:
Manipulation Macro
Manipulation macros are characterized by liquidity being swept both on the buyside and sellside.
Expansion Macro
Expansion macros are characterized by liquidity being swept only on the buyside or sellside. Prices within these macros are highly correlated with the overall trend.
Accumulation Macro
Accumulation macros are characterized by an accumulation of liquidity. Prices within these macros tend to range.
The script returns the maximum/minimum price values reached during the macro interval alongside the average between the maximum/minimum and extends them until a new macro starts. These levels can act as supports and resistances.
🔶 DETAILS
All required data for the macro detection and classification is retrieved using 1 minute data sets, this includes candles as well as pivot/swing highs and lows. This approach guarantees the visually presented objects are same (same highs/lows) on higher timeframes as well as the macro classification remain same as it is in 1 min charts.
8 Macros can be displayed by the script (4 are enabled by default):
02:33 AM 03:00 London Macro
04:03 AM 04:30 London Macro
08:50 AM 09:10 New York Macro
09:50 AM 10:10 New York Macro
10:50 AM 11:10 New York Macro
11:50 AM 12:10 New York Launch Macro
13:10 PM 13:40 New York Macro
15:15 PM 15:45 New York Macro
🔶 ALERTS
When an alert is configured, the user will have the ability to be notified in advance of the next Macro time, where the value specified in 'Alert Macro Times in Advance (Minutes)' option indicates how early to be notified.
🔶 LIMITATIONS
The script is supported on 1 min, 3 mins and 5 mins charts.
🔶 RELATED SCRIPTS

Volume Channel - [With Volume Filter]The indicator calculates two volume-weighted moving averages (VWMA) using different lengths, and filters them based on a moving average of volume. The filtered VWMA values are then plotted on the chart as lines, representing the fast and slow moving averages. In addition, upper and lower bands are calculated based on the slow VWMA and plotted as lines on the chart.
The fast and slow VWMA lines can be used to identify trends in the market. When the fast VWMA is above the slow VWMA, it is an indication of an uptrend, and when the fast VWMA is below the slow VWMA, it is an indication of a downtrend. The position of the VWMA lines relative to the upper and lower bands can also be used to identify potential trade signals.
When the price is near the upper band, it indicates that the market is overbought, and when the price is near the lower band, it indicates that the market is oversold. Traders can use these signals to enter or exit trades.
The indicator also includes a volume filter, which means that the VWMA values are only calculated when the volume is above a certain moving average of volume. This helps to filter out noise in the market and provide more accurate signals.
Explanation for each parameter
vwmaLength1: This is the length of the fast volume-weighted moving average (VWMA) used in the calculation. The default value is 10, and it can be adjusted by the user.
vwmaLength2: This is the length of the slow volume-weighted moving average (VWMA) used in the calculation. The default value is 25, and it can be adjusted by the user.
bandLength: This is the length of the moving average used to calculate the upper and lower bands. The default value is 34, and it is not adjustable by the user.
volumeFilterLength: This is the length of the moving average of volume used as a filter for the VWMA calculation. The default value is 5, and it can be adjusted by the user.
src: This is the input source for the VWMA calculation. The default value is close, which means the indicator is using the closing price of each bar. However, the user can select a different input source by changing this parameter.
filteredVwma1: This is the filtered VWMA calculated based on the volume filter and the fast VWMA length. It is plotted as a line on the chart and can be used to identify short-term trends.
filteredVwma2: This is the filtered VWMA calculated based on the volume filter and the slow VWMA length. It is plotted as a line on the chart and can be used to identify long-term trends.
ma: This is the moving average of the filtered slow VWMA values, which is used to calculate the upper and lower bands. It is plotted as a line on the chart.
offs: This is the offset used to calculate the upper and lower bands. It is based on the standard deviation of the filtered slow VWMA values and is multiplied by 1.6185 * 3. It is plotted as a line on the chart.
up: This is the upper band calculated as the moving average plus the offset. It is plotted as a line on the chart and can be used to identify overbought conditions.
dn: This is the lower band calculated as the moving average minus the offset. It is plotted as a line on the chart and can be used to identify oversold conditions.

Matrix Momentum Expansion [IkkeOmar]The indicator consists of several features:
Candlestick chart: The indicator plots a candlestick chart based on the input parameters of the user. The candlesticks are colored blue or orange depending on whether the closing price is above or below the upper and lower bands.
Support and Resistance levels: The indicator also plots support and resistance levels based on the CCI (Commodity Channel Index) of the asset's price. These levels are dynamic and change based on the user's input parameters.
Momentum: The indicator calculates the momentum of the market based on the smoothed and standard deviation of the asset's price. It uses this momentum to calculate upper and lower bands that are plotted on the chart.
Warning signals: The indicator can also be used to identify potential warning signals. When the closing price of the asset moves above the upper band, it could indicate that the market is overbought and a potential reversal could occur. Conversely, when the closing price moves below the lower band, it could indicate that the market is oversold and a potential reversal could occur.
Contractions and expansions in the bands can provide important information to traders about potential price movements.
When the bands contract, it indicates that the market is experiencing low volatility and the price is likely to move sideways. During these periods, traders may look for other signals, such as support and resistance levels or price patterns, to determine potential entry and exit points.
On the other hand, when the bands expand, it indicates that the market is experiencing high volatility and the price is likely to move in a particular direction. Traders can use this information to identify potential trend reversals or continuation patterns. When the upper and lower bands move further apart, it indicates that the trend is becoming stronger, while when they move closer together, it indicates that the trend may be weakening.
When the price moves outside of the bands, it can also provide important information to traders. If the price moves above the upper band, it could indicate that the market is overbought and a potential reversal could occur. Conversely, if the price moves below the lower band, it could indicate that the market is oversold and a potential reversal could occur.
Very important note!
When you see contractions, please understand that it's a wonderful opportunity to pivot into position to catch a good trade because we will see an expansion after!

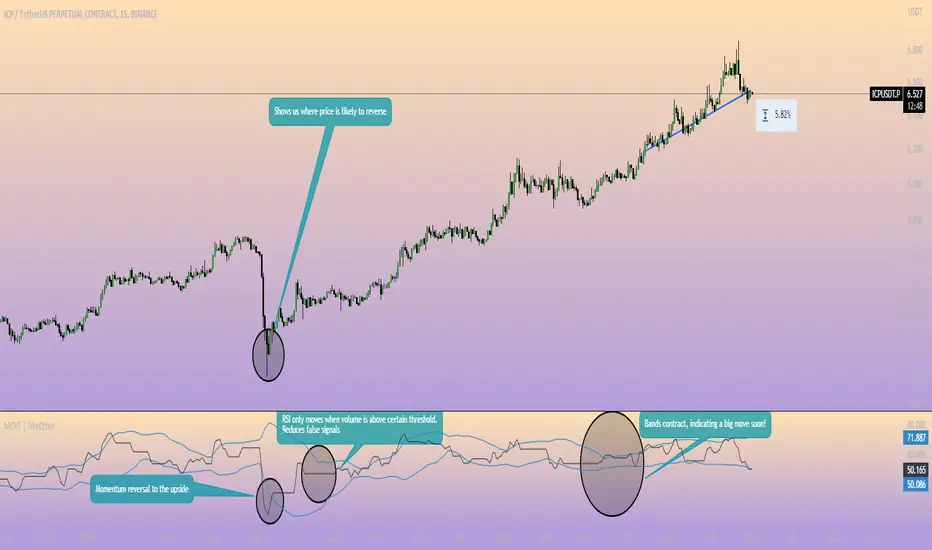
Momentum Channel - [Volume Filter]The indicator incorporates a volume filter to ensure that the RSI only moves when the volume is above the moving average of the volume.
The filtered RSI is then used to calculate the Bollinger Bands and moving averages, providing insights into the market dynamics.
It also gives you insight into the bigger timeframes so you can monitor momentum!
Volume Filter Length: Input parameter for the length of the volume filter moving average.
Overview of code:
rsiPeriod: Input parameter for the RSI period.
bandLength: Input parameter for the length of the Bollinger Bands.
lengthrsipl: Input parameter for the length of the fast moving average (MA) on the RSI.
volumeFilterLength: Input parameter for the length of the volume filter moving average.
volumeAvg: Calculates the moving average of the volume using the ta.sma() function with the specified volume filter length.
filteredRsi: Uses the ta.valuewhen() function to obtain the RSI value only when the volume is greater than or equal to the volume moving average. This creates a filtered RSI based on the volume filter.
offs: Calculates the offset value for the Bollinger Bands. It is derived by multiplying 1.6185 with the standard deviation of the filtered RSI using the ta.stdev() function.
Expansion Finder by nnamWhat this Indicator Does
This indicator helps the trader locate expansion and contraction areas in an easy visual way.
When the asset moves from a contraction phase into an expansion phase, the bars change color (customizable). This allows the trader to recognize areas of contraction and avoid trading them. Once a Bar Range moves outside of the average range as specified by the user, the bar will change color informing the trader that the current bar and by default the market, is moving into an expansion phase from a contraction phase.
The indicator works well for those traders that use the Forex Master Pattern to locate Value Lines and Value Areas on the chart giving them an opportunity to draw in these areas with ease.
As shown in the screenshot below, the boxes are manually drawn after the trader locates an easily identifiable area of contraction.
The Indicator makes it easy to find longer areas of contraction and ignore the noise of smaller contractions.
Customizable Settings allow the trader to define the lookback range that determines the number of bars to base the average.
A "multiplier" setting allows the trader to easily adjust the Average by changing the average using a simple calculation.
Example, if the average multiplier is set to "1", the average will be used.
Using the standard average is not always the best way to define these contractions, so traders can set the average to a higher or lower number by using the multiplier, thus changing the calculation but maintaining a consistent number across the chart.
Example: If the average is not plotting the contraction correctly, the trader can manually adjust the multiplier down to 0.5 thus adjusting the average in half or increase the multiplier to 2 thus doubling the average.
As seen in the screenshot below, this changes the number of expansion bars visible on the chart.
Below you can see Value Areas and Value Lines drawn in. These lines assist the trader in defining important levels for future trading.
I hope this Indicator helps you locate value areas and value lines on charts in an easy way.
Any questions or concerns or suggestions, please do not hesitate to reach out.
Happy Trading !!!!
Stockbee Momentum BurstThis is a script to color code bars based on the bullish- and bearish combination.
Bullish Combination
Percent: Price >= 4% from yesterday and Volume today > Yesterday
Dollar: Price >= 0.9 dollar from open
Base Requirements
- Price > Yesterday's close
- Price > Open
- Price is within 30% of high
- Todays price range >= Yesterdays price range
- Yesterday's move <= 2%
- Volume >= 100 000
Bearish Combination
Percent: Price <= 4% from yesterday and Volume today > Yesterday
Dollar: Price <= 0.9 dollar from open
Base Requirements
- Price < Yesterday's close
- Price < Open
- Price is within 30% of low
- Todays price range >= Yesterdays price range
- Yesterday's move >= -2%
- Minimum volume for each of last 3 days >= 100 000
Momentum Filter
These are based on the 10 and 20 EMA crossover, where the former above would indicate upward momentum and below downward momentum. This can help to narrow down the color code to continuation phases. The linked option will override all other momentum filters, bullish candles will be displayed when EMA 10 > 20 and bearish candles when EMA 10 < 20.

[CBB] Volatility Squeeze ToyThe main concept and features of this script are adapted from Mark Whistler's book "Volatility Illuminated". I have deviated from the use cases and strategies presented in the book, but the 3 Bollinger Bands use his optimized settings as the default length and standard deviation multiplier. Further insights into Mark's concepts and volatility research were gained by reading and watching some of TV user DadShark's materials (www.tradingview.com).
This script has been through many refinements and feature cycles, and I've added unrelated complimentary features not present in the book. The indicator is better studied than described, and unless you have read the book, any short summary of the material will just make you squint and think about the wrong things.
Here is a limited outline of features and concepts:
1. 3 Bollinger Bands of different length and/or deviation multiplier. Perhaps think of them as representing the various time frames that compression and expansion cycles and events manifest in, and also the expression of range, speed and price distribution within those time frames. You can gain insight into the magnitude of events based on how the three bands interact and stay contained, or not. If volatility is significant enough, all "time frames" represented by the bands will eventually record the event and subsequent price action, but the early signals will come from the spasms of the shortest, most volatile band. Many times the short band will contract again before, or just as it reaches a longer band, but in extreme cases, volatility will explode and all bands at all time frames will erupt in succession. In these cases you will see additional color representing shorter bands (lower time frame volatility in concept) traveling outside of longer bands. It is worth taking a look at the price levels and candles where these volatility bands cross each other.
2. In addition to the mean of the bands, there are a variety of other moving averages available to gauge trend, range, and areas of interest. This is accomplished with variable VWAP, ATR, smoothing, and a special derived loosely from the difference between them.
3. The bands are also used to derive conditions under which volatility is considered compressed, or in "squeeze" . Under these conditions the candles will turn yellow. Depending on your chart settings and indicator settings, these zones can be completely useless or drag on through fairly significant price action. Or, the can give you fantastic levels to watch for breakouts. The point is that volatility is compressed during these conditions, and you should expect the inevitable once this condition ends. Sometimes you can find yourself in a nice fat trend straight away, other times you may blow an account because you gorged your position based on arbitrary bar color. It's not like that. Pay attention to the highest and lowest bars of these squeeze ranges, and carefully observe future price action when it returns to these squeeze ranges. This info is more and more valuable at higher time frames.
The 3 bands, a smoothed long trend VWAP, and the squeeze condition colored bars are all active by default. All features can be shown or hidden on the control panel.
There are some deep market insights to mine if you live with this one for a while. As with any indicator, blunt "buy/sell here" approaches will lead to loss and frustration. however , if you pay attention to squeeze range, band/moving average confluence, high volume and/or large range candles their open/close behavior around these areas and squeeze ranges, you will start to catch the beginning of some powerful momentum moves.
Enjoy!

ATR Volume DivergenceThe indicator measures ATR relative to VOLUME of each candle, marks the candles where there is more volume than in the previous one, but a lower ATR - signifying a compression in price movement - resistance. It also marks the candle where there is a greater ATR than in the previous candle, but lower volume - signifying an expansion in price movement - vacuum.
P.S. Bring indicator to FRONT to see the colored candles clearly

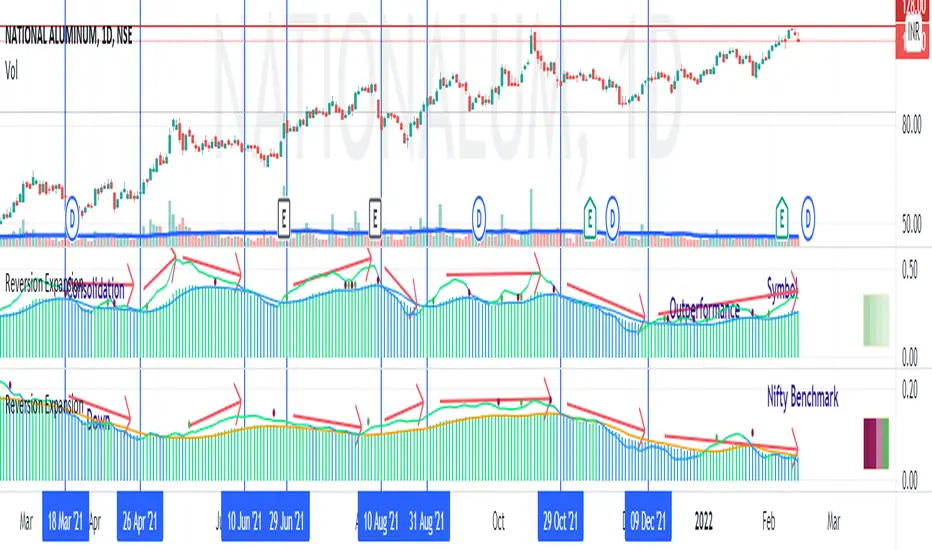
Price - Mean Reversion ExpansionA simple indicator, to plot the quantitatively the reversion and expansion of price from a set of means.
A green bar plots prices above the set of means. A bar plots prices below the set of means. A blue bar plots price entangled in the means. The height of the bars denotes the far-ness from the set of means.
A blue envelope over the bars is the average of this reversion/expansion. A "crossover" of any bar (red/green) over this envelope is indicated by a "green dot" a "crossunder" of any bar (red/green) under this envelope is indicated by a "red dot".
The small trend strength table (when enabled) on the right side below show in a easy manner the data presented in the " Mean Angles " indicator. Refer to description there for more details.
Volume Contraction and ExpansionA simple indicator that shows volume expansion and contraction of a trend through colorization of the candles. It indicates the underlying volume support of a trend. This indicator might come in handy for any Elliott Wave analyst trying to incorporate volume into his analysis.

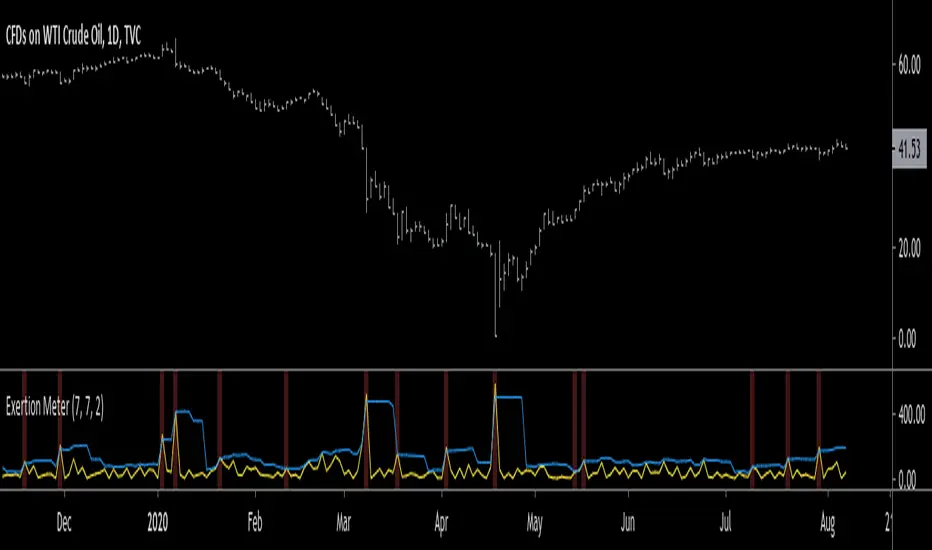
Exertion MeterHello traders, today I wanted to present you something special. I present you the Exertion Meter!
Created from scratch, this idea is based on a theory of mine called "Exertion".
Exertion occurs when price moves beyond the previous bar's range thus it has "exerted itself".
The idea is that when price moves a lot, it exerts a lot of energy which eventually leads to calmer motion, usually in the direction price has exerted itself.
Now, when price has exerted itself a lot in a particular direction, it's telling you that it will likely continue in that direction.
Once this happens, it will gradually calm down until price begins the cycle again, exerting itself in either the same or opposite direction.
This theory is similar to the theory of expansion & contraction phases.
This indicator attempts to show you where price has exerted itself by giving you a two lines cross signal.
The default settings are recommended, but experimentation is encouraged to fit your own personal system.
Both settings control the standard deviation line ( aka . Upper Bollinger Band ).
Enjoy, and hit the follow button to get easy access to all my indicators and to follow my latest publications!
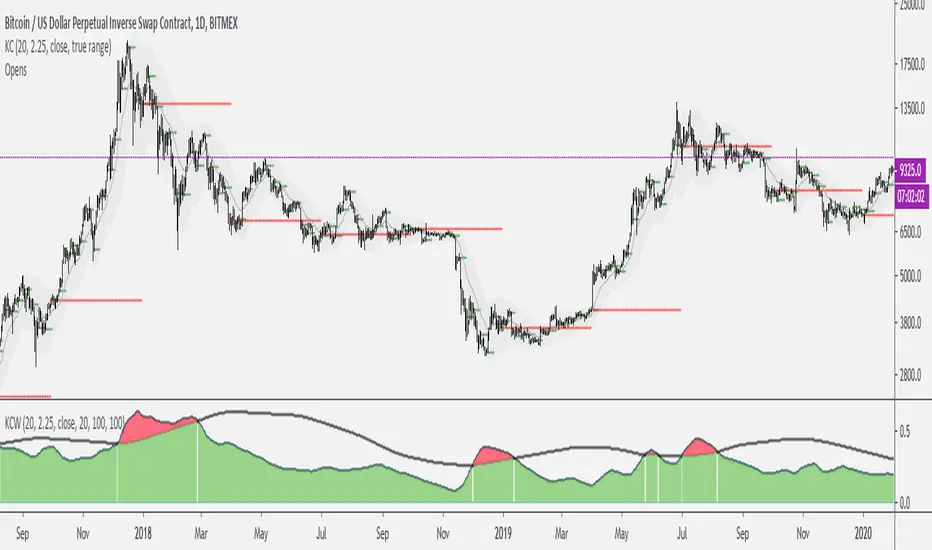
Keltner Channels WidthSimilar to bollinger bands width, but for keltner channels, designed to recognize when a move is exhausted and contraction is to be expected.
Would use it as a filter to stay out of any trades if the indicator peaks (red color).
R100 Volatility Combo Bands v1 (*v*)The Volatility Combo Bands are made from 4 separate volatility bands- two Bollinger Bands (10 and 20 period) and two Price Headley Acceleration Bands (10 and 20 period). The Volatility Combo Bands plot the innermost upper and lower points from these bands and then plots a mid-line. By default, only the standard 20 period Bollinger Bands and Combo Bands with mid-line are displayed, but can be configured however you want.
Try it out- see squeezes earlier, ride the bands earlier in trending markets, trade pullbacks to the Combo Bands and mid-line, trade the range of the band or use them to help identify potential support and resistance levels. Hopefully they can add another dimension to identifying volatility contraction patterns or whatever you currently use these things for!
I hope you get some value out of it. Only conditions of use are that if you improve it, let me know and if you publish something that uses it, don't hide the code! Enjoy!
Code for the Price Headley Acceleration Bands pinched and modified from LazyBear - thankyou.

[Marvin] Concentración/Expasión de volatilidadUn interesante indicador que te da los niveles de concentración, debes analizar en gráficos de H4 luego podrás notar que romperá dependiendo de la tendencia en corto o largo, dando en promedio unos 20 a 100 pips.
Deja en tu comentarios que te parece.


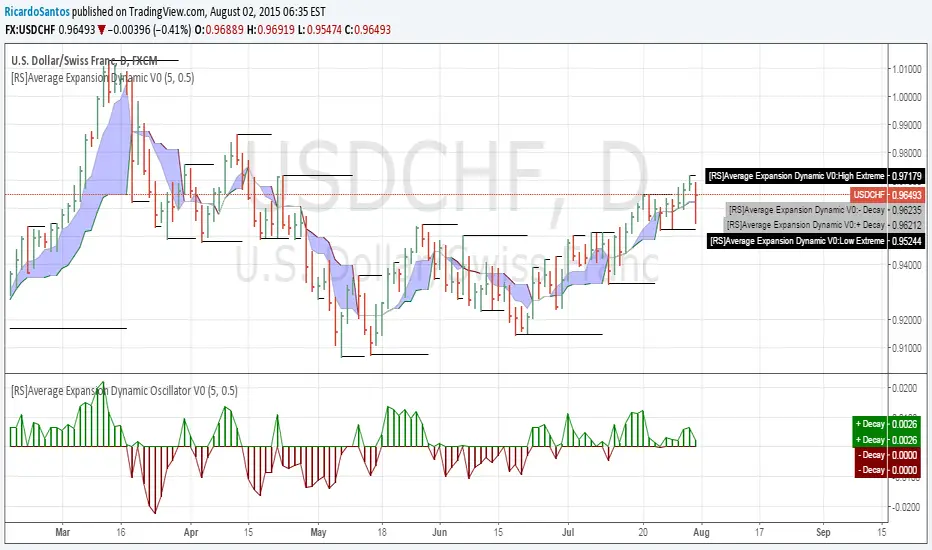
[RS]Average Expansion Dynamic Oscillator V0EXPERIMENTAL:
Oscillator Version.
calculation of extremes and price range for averaging movement.
while price is above market is rising, when bellow market is falling. also can discern strength from the gap of the averages.

[RS]Average Expansion Dynamic V0EXPERIMENTAL: calculation of extremes and price range for averaging movement.
while price is above market is rising, when bellow market is falling. also can discern strength from the gap of the averages.
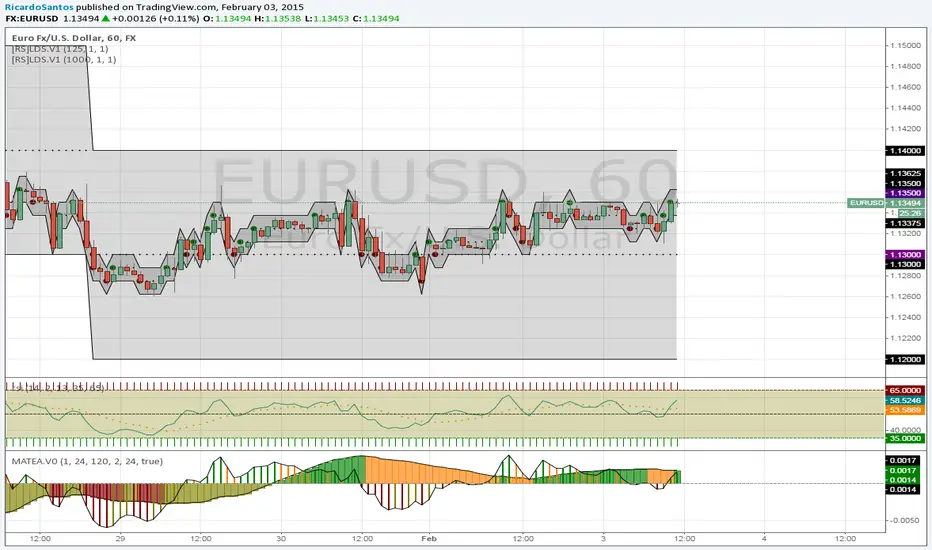
[RS]Moving Average Trend Expansion Analysis V0experimental: analyzing the differences between price closure and multiple moving averages to discern movement and direction of market.
upper signal is the long trend, while the lower signal symbolizes faster movements within the trend.