SPX Weekly Expected Moves# SPX Weekly Expected Moves Indicator
A professional Pine Script indicator for TradingView that displays weekly expected move levels for SPX based on real options data, with integrated Fibonacci retracement analysis and intelligent alerting system.
## Overview
This indicator helps options and equity traders visualize weekly expected move ranges for the S&P 500 Index (SPX) by plotting historical and current week expected move boundaries derived from weekly options pricing. Unlike theoretical volatility calculations, this indicator uses actual market-based expected move data that you provide from options platforms.
## Key Features
### 📈 **Expected Move Visualization**
- **Historical Lines**: Display past weeks' expected moves with configurable history (10, 26, or 52 weeks)
- **Current Week Focus**: Highlighted current week with extended lines to present time
- **Friday Close Reference**: Orange baseline showing the previous Friday's close price
- **Timeframe Independent**: Works consistently across all chart timeframes (1m to 1D)
### 🎯 **Fibonacci Integration**
- **Five Fibonacci Levels**: 23.6%, 38.2%, 50%, 61.8%, 76.4% between Friday close and expected move boundaries
- **Color-Coded Levels**:
- Red: 23.6% & 76.4% (outer levels)
- Blue: 38.2% & 61.8% (golden ratio levels)
- Black: 50% (midpoint - most critical level)
- **Current Week Only**: Fibonacci levels shown only for active trading week to reduce clutter
### 📊 **Real-Time Information Table**
- **Current SPX Price**: Live market price
- **Expected Move**: ±EM value for current week
- **Previous Close**: Friday close price (baseline for calculations)
- **100% EM Levels**: Exact upper and lower boundary prices
- **Current Location**: Real-time position within the EM structure (e.g., "Above 38.2% Fib (upper zone)")
### 🚨 **Intelligent Alert System**
- **Zone-Aware Alerts**: Separate alerts for upper and lower zones
- **Key Level Breaches**: Alerts for 23.6% and 76.4% Fibonacci level crossings
- **Bar Close Based**: Alerts trigger on confirmed bar closes, not tick-by-tick
- **Customizable**: Enable/disable alerts through settings
## How It Works
### Data Input Method
The indicator uses a **manual data entry approach** where you input actual expected move values obtained from options platforms:
```pinescript
// Add entries using the options expiration Friday date
map.put(expected_moves, 20250613, 91.244) // Week ending June 13, 2025
map.put(expected_moves, 20250620, 95.150) // Week ending June 20, 2025
```
### Weekly Structure
- **Monday 9:30 AM ET**: Week begins
- **Friday 4:00 PM ET**: Week ends
- **Lines Extend**: From Monday open to Friday close (historical) or current time + 5 bars (current week)
- **Timezone Handling**: Uses "America/New_York" for proper DST handling
### Calculation Logic
1. **Base Price**: Previous Friday's SPX close price
2. **Expected Move**: Market-derived ±EM value from weekly options
3. **Upper Boundary**: Friday Close + Expected Move
4. **Lower Boundary**: Friday Close - Expected Move
5. **Fibonacci Levels**: Proportional levels between Friday close and EM boundaries
## Setup Instructions
### 1. Data Collection
Obtain weekly expected move values from options platforms such as:
- **ThinkOrSwim**: Use thinkBack feature to look up weekly expected moves
- **Tastyworks**: Check weekly options expected move data
- **CBOE**: Reference SPX weekly options data
- **Manual Calculation**: (ATM Call Premium + ATM Put Premium) × 0.85
### 2. Data Entry
After each Friday close, update the indicator with the next week's expected move:
```pinescript
// Example: On Friday June 7, 2025, add data for week ending June 13
map.put(expected_moves, 20250613, 91.244) // Actual EM value from your platform
```
### 3. Configuration
Customize the indicator through the settings panel:
#### Visual Settings
- **Show Current Week EM**: Toggle current week display
- **Show Past Weeks**: Toggle historical weeks display
- **Max Weeks History**: Choose 10, 26, or 52 weeks of history
- **Show Fibonacci Levels**: Toggle Fibonacci retracement levels
- **Label Controls**: Customize which labels to display
#### Colors
- **Current Week EM**: Default yellow for active week
- **Past Weeks EM**: Default gray for historical weeks
- **Friday Close**: Default orange for baseline
- **Fibonacci Levels**: Customizable colors for each level type
#### Alerts
- **Enable EM Breach Alerts**: Master toggle for all alerts
- **Specific Alerts**: Four alert types for Fibonacci level breaches
## Trading Applications
### Options Trading
- **Straddle/Strangle Positioning**: Visualize breakeven levels for neutral strategies
- **Directional Plays**: Assess probability of reaching target levels
- **Earnings Plays**: Compare actual vs. expected move outcomes
### Equity Trading
- **Support/Resistance**: Use EM boundaries and Fibonacci levels as key levels
- **Breakout Trading**: Monitor for moves beyond expected ranges
- **Mean Reversion**: Look for reversals at extreme Fibonacci levels
### Risk Management
- **Position Sizing**: Gauge likely price ranges for the week
- **Stop Placement**: Use Fibonacci levels for logical stop locations
- **Profit Targets**: Set targets based on EM structure probabilities
## Technical Implementation
### Performance Features
- **Memory Managed**: Configurable history limits prevent memory issues
- **Timeframe Independent**: Uses timestamp-based calculations for consistency
- **Object Management**: Automatic cleanup of drawing objects prevents duplicates
- **Error Handling**: Robust bounds checking and NA value handling
### Pine Script Best Practices
- **v6 Compliance**: Uses latest Pine Script version features
- **User Defined Types**: Structured data management with WeeklyEM type
- **Efficient Drawing**: Smart line/label creation and deletion
- **Professional Standards**: Clean code organization and comprehensive documentation
## Customization Guide
### Adding New Weeks
```pinescript
// Add after market close each Friday
map.put(expected_moves, YYYYMMDD, EM_VALUE)
```
### Color Schemes
Customize colors for different trading styles:
- **Dark Theme**: Use bright colors for visibility
- **Light Theme**: Use contrasting dark colors
- **Minimalist**: Use single color with transparency
### Label Management
Control label density:
- **Show Current Week Labels Only**: Reduce clutter for active trading
- **Show All Labels**: Full information for analysis
- **Selective Display**: Choose specific label types
## Troubleshooting
### Common Issues
1. **No Lines Appearing**: Check that expected move data is entered for current/recent weeks
2. **Wrong Time Display**: Ensure "America/New_York" timezone is properly handled
3. **Duplicate Lines**: Restart indicator if drawing objects appear duplicated
4. **Missing Fibonacci Levels**: Verify "Show Fibonacci Levels" is enabled
### Data Validation
- **Expected Move Format**: Use positive numbers (e.g., 91.244, not ±91.244)
- **Date Format**: Use YYYYMMDD format (e.g., 20250613)
- **Reasonable Values**: Verify EM values are realistic (typically 50-200 for SPX)
## Version History
### Current Version
- **Pine Script v6**: Latest version compatibility
- **Fibonacci Integration**: Five-level retracement analysis
- **Zone-Aware Alerts**: Upper/lower zone differentiation
- **Dynamic Line Management**: Smart current week extension
- **Professional UI**: Comprehensive information table
### Future Enhancements
- **Multiple Symbols**: Extend beyond SPX to other indices
- **Automated Data**: Integration with options data APIs
- **Statistical Analysis**: Success rate tracking for EM predictions
- **Additional Levels**: Custom percentage levels beyond Fibonacci
## License & Usage
This indicator is designed for educational and trading purposes. Users are responsible for:
- **Data Accuracy**: Ensuring correct expected move values
- **Risk Management**: Proper position sizing and risk controls
- **Market Understanding**: Comprehending options-based expected move concepts
## Support
For questions, issues, or feature requests related to this indicator, please refer to the code comments and documentation within the Pine Script file.
---
**Disclaimer**: This indicator is for informational purposes only. Trading involves substantial risk of loss and is not suitable for all investors. Past performance does not guarantee future results.
Expectedmove

True Range/Expected MoveThis indicator plots the ratio of True Range/Expected Move of SPX. True Range is simple the high-low range of any period. Expected move is the amount that SPX is predicted to increase or decrease from its current price based on the current level of implied volatility. There are several choices of volatility indexes to choose from. The shift in color from red to green is set by default to 1 but can be adjusted in the settings.
Red bars indicate the true range was below the expected move and green bars indicate it was above. Because markets tend to overprice volatility it is expected that there would be more red bars than green. If you sell SPX or SPY option premium red days tend to be successful while green days tend to get stopped out. On a 1D chart it is interesting to look at the clusters of bar colors.

4C Options Expected Move (Weekly + 0DTE)This indicator plots the calculated Expected Move for BOTH Weekly and Zero Dated Expiration (0DTE) Daily options, for a quick visual reference.
Please Note: This indicator is different from our original "4C Expected Move (Weekly Options)" indicator, as it now packages the ability to ALSO plot 0DTE options expected moves along with Weekly expected moves. Many other newer features have also been implemented.
Background Information
The Expected Move (EM) is the amount that a stock is predicted to increase or decrease from its current price, based on the current level of options pricing and implied volatility.
This range can be viewed as possible support and resistance, or, once price gets outside of the range, institutional hedging actions can accelerate the move in that direction.
It can be useful to know what the weekly EM range is for a stock to understand the probabilities of the overall distance, direction and volatility for the week.
About the Indicator
This indicator plots the calculated Expected Move for BOTH Weekly and Zero Dated Expiration (0DTE) options, for a quick visual reference.
For the weekly EM, the range is based on the Weekly close of the prior week.
For the Daily EM based on 0DTE options, the range is based on the Daily close of the prior day.
The indicator will automatically start a new weekly EM plot at the beginning of the week, and a new daily EM at the beginning of each day.
The EM values must be updated weekly and/or daily.
Features
Plots the EM for the week
Plots the EM for the day, for symbols that offer daily expiration options
Plots the 2 Standard Deviation EM for both the weekly and daily EM
Labels with calculated values are plotted near the levels for quick visual aid
Settings
Can toggle weekly EM on/off
Can toggle Daily EM on/off
Can toggle 2 Standard Deviation lines on/off
Can toggle labels for all EM on/off
Robust line settings
Can adjust label location left/right based on personal preference
Can enter symbol into settings as a reference
Handy instructions in the settings
How To Set Up The Indicator
To use this indicator you must have access to a broker with options data (not available on Tradingview).
Usually, you can look at the stock's option chain to find the weekly expected move.
You will have to do your own research to find where this information is displayed depending on your broker. You may also need to find the information elsewhere if your broker does not have this information.
You can also do your calculation of the EM using the following formula (please do your own research):
Expected Move = Option Price x Implied Volatility x Square Root of Time
See screenshot example below
This is the Thinkorswim platform's option chain, and the Implied Volatility % and the calculated EM are on the right side of the option chain.
The Expected Move is circled in blue. Use the +- number in parentheses, NOT the % value.
For the weekly EM, input the number that corresponds to the weekly option into the indicator. This must be done on a weekly basis, and It is typically best to use the EM for the next week expiration that is generated AFTER the Friday close and/or before the Monday open of the upcoming week.
For the daily EM, input the number that corresponds to the daily 0DTE option into the indicator. This must be done on a daily basis, and it is typically best to use the EM value for the 0DTE option that is generated the night before (after market close), or before the market opens for that 0DTE. .

4C Expected Move (Weekly Options)This indicator plots the Expected Move (EM) calculated from weekly options pricing, for a quick visual reference.
The EM is the amount that a stock is predicted to increase or decrease from its current price, based on the current level of implied volatility.
This range can be viewed as support and resistance, or once price gets outside of the range, institutional hedging actions can accelerate the move in that direction.
The EM range is based on the Weekly close of the prior week.
It can be useful to know what the weekly EM range is for a stock to understand the probabilities of the overall distance, direction and volatility for the week.
To use this indicator you must have access to a broker with options data (not available on Tradingview).
Look at the stock's option chain and find the weekly expected move. You will have to do your own research to find where this information is displayed depending on your broker.
See screenshot example on the chart. This is the Thinkorswim platform's option chain, and the Implied Volatility % and the calculated EM is circled in red. Use the +- number in parentheses, NOT the % value.
Input that number into the indicator on a weekly basis, ideally on the weekend sometime after the cash market close on Friday, and before the Market open at the beginning of the trading week.
The indicator must be manually updated each week.
It will automatically start over at the beginning of the week.

Trading Made Easy Pressure OscillatorAs always, this is not financial advice and use at your own risk. Trading is risky and can cost you significant sums of money if you are not careful. Make sure you always have a proper entry and exit plan that includes defining your risk before you enter a trade.
Those who have looked at my other indicators know that I am a big fan of Dr. Alexander Elder and John Carter. This is relevant to my trading style and to this indicator in general. While I understand it goes against TradingView rules generally to display other indicators while describing a new one, I need the Bollinger Bands, Bollinger Bands Width, and a secondary directional indicator to explain the full power of this indicator. In short, if this is strongly against the rules, I will edit the post as needed.
Those of you who are aware of John Carter are going to know this already, but for those who don’t, an explanation is necessary. John Carter is a relatively famous retail-turned-institutional (sort of) trader. He is the founder of TradetheMarkets, that later turned into SimplerTrading. Him and his company have a series of YouTube videos, he has made appearances on the MoneyShow, TastyTrade, and has authored a couple of books about trading. However, he is probably most famous for his “Squeeze” indicator that was originally launched on Thinkorswim and through his website but has now been incorporated into several trading platforms and even has a few open-source versions available here. In short, the Squeeze indicator looks to identify periods of consolidation and marry that with a momentum oscillator so you can position yourself in a quiet period before a large move. This in my opinion, is one of the best indicators an option trader can have, since options are priced both on time and volatility. To do this, the Squeeze identifies when the Bollinger Bands, a measure of price standard deviation, have contracted inside the Keltner Channels (a measure of the average range of a stock). This highlights something known as “the Squeeze”, when the 2x standard deviations (95% of all likely price movement using data from the past 20 periods) is less than the 1.5x average true range (ATR) of the stock over the same number of periods. These periods are when a stock is resting and in a period of consolidation and is generally followed by another large move once it has rested long enough. The momentum oscillator is used to determine the direction of this next move.
While I think this is one of the best indicators ever made, it is not without its pitfalls. I find that the “Squeeze” periods sometimes take too long to setup (something that was addressed by John and released in a new indicator, the Squeeze Pro, but even that is still slowish) and that the momentum oscillator was also a bit slow. They used a linear regression formula to track momentum, which can lag considerably at times. Collectively, this meant that getting into moves a few candles late was not uncommon or someone solely trading squeeze setups could have missed very good trade opportunities.
To improve on this, I present, the Trading Made Easy Pressure Oscillator. This more accurately identifies when volatility is reducing and the trading range is likely to contract, increasing the “pressure” on the price. This is often marked several candles before a “Squeeze” has started. To identify these ranges, I applied a 21-period exponential moving average to the Bollinger Bands Width indicator (BBW). As mentioned above, the Bollinger Bands measure the 2x standard deviation of price, typically based on a 20-period SMA. When the BBs expand, it marks periods of high volatility, when they contract, conversely, periods of low volatility. Therefore, applying an EMA to the BBW indicator allows us to confidently mark when volatility has slowed down earlier than traditional methods. The second improvement I made was using the Absolute Price oscillator instead of a linear regression-style oscillator. The APO is very similar to a MACD, it measures the difference between two exponential moving averages, here the 8 and 21 (Fibonacci EMAs). However, I find the APO to be smoother than the MACD, yet more reactive than the linear regression-style oscillators to get you into moves earlier.
Uses:
1) Buying before a bigger than expected move. This is especially relevant for options traders since theta decay will often eat away much of our profits while we wait for a large enough price move to offset the time decay. Here, we buy a call option/shares when the momentum oscillator matches the longer-term trend (i.e. the APO crosses over the zero line when price is above the 200-day EMA, and vice versa for puts/shorting the stock). This coincides with Dr. Elder’s Triple Screen Trading System, that we are aligning ourselves with the path of least resistance. We want to do this when price is currently in an increasing pressure situation (i.e. volatility is contracting) to make sure we are buying an option when premium and Implied Volatility is low so we can get a better price and have a better risk to reward ratio. Low volatility is denoted by a purple dot, high volatility a blue dot along the midline of the indicator. A scalper or short-term swing trader may look to exit when the blue dots turn purple signalling a likely end to a move. A longer-term trend trader can look to other exit scenarios, such as a cross of the oscillator below the zero line, signalling to go short, or using a moving average as a trailing stop.
2) Sell premium after a larger than expected move has finished. After a larger than expected move has completed (a series of blue dots is followed by a purple dot), use this time to sell theta-driven options strategies such as straddles, strangles, iron condors, calendar spreads, or iron butterflies, anything that benefits from contracting volatility and stagnating prices. This is useful here since reducing volatility typically means a contraction of prices and the reduced likelihood of a move outside of the normal range.
3) Divergences. This indicator is sensitive enough to highlight divergences. I personally don’t use it as such as I prefer to trend trade vs. reversion trade. Use at your own risk, but they are there.
In summary, this indicator improves upon the famous Squeeze indicator by increasing the speed at which periods of consolidation are marked and trend identification. I hope you enjoy it.

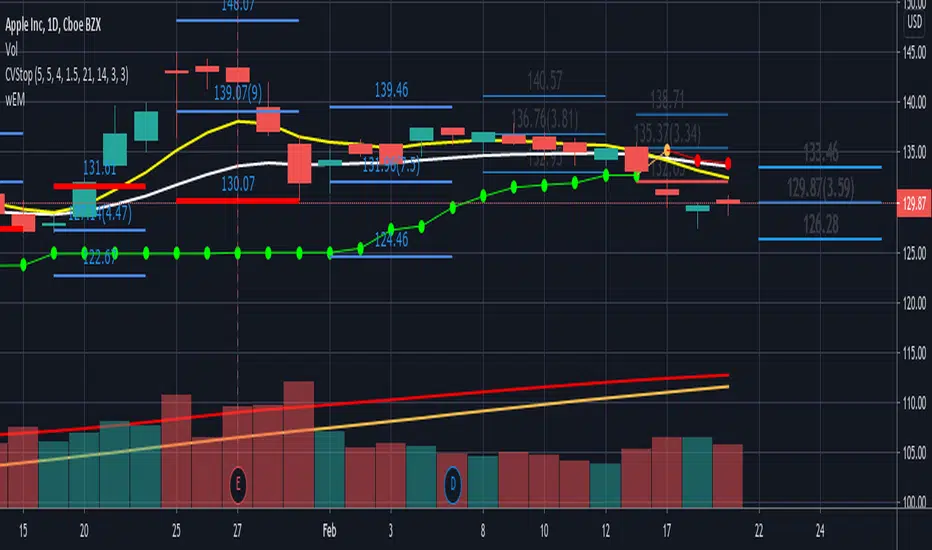
wEMPlotDescription:
Plots the Weekly Expected Move (wEM) using the following week's Option Chain ATM Call+Put ask price to determine the EM for the following week
The wEM is the options market pricing in the expected future volatility for the following week.
The wEM is the range that the underlying price will be contained during the week 68% of the time.
These levels can be used as targets for options or equity trades for either directional or non-directional trades.
The options market in the major indices, such as SPX, can drive the overall market's order flow and so the EM can provide
useful insight into the hedging levels being used by professionals and market markers.
As Trading View does not currently provide access to option chain data, the option chain expected move for an underlying has to be manually
entered each week, but the script provides an easy to use framework to enter the parameters for the next week.
These parameters are as follows:
eg.
t1_1 = timestamp(2021, 02, 08) <==== timestamp for the start of next week (yyyy,mm,dd)
t1_2 = timestamp(2021, 02, 12) <==== timestamp for the end of next week (yyyy,mm,dd)
plotwem("QQQ", 331.36, 5.86, t1_1, t1_2, 0, 0)
^^^^
plotwem(Symbol, Close-last-week, Expected Move next week, Next week start timestamp, Next week end timestamp, Highlight-Upper-EM, Highlight-Lower-EM)
Parameters are:
Symbol : Underlying chart symbol (aka ticker). Can be a symbol for equity, future or index.
Close-last-week: Closing price at the end of last week.
Expected Move next week: The Expected Move for next week: Calculated from next week's Option Chain ATM Call+Put ask price
Next week start timestamp : Timestamp for the start of next week
Next week end timestamp : Timestamp for the end of next week
Highlight-Upper-EM : highlight upper expected move level. Set to 1 to highlight with red color. Set to 0 is no highlight.
Highlight-Lower-EM : highlight lower expected move level. Set to 1 to highlight with red color. Set to 0 is no highlight.
The highlight parameters can be updated at any point to indicate that the underlying has either touched the EM level or breached the level.
The highlights can be used to visually determine periods of market instability which can provide insight into applicable strategies for the market conditions.
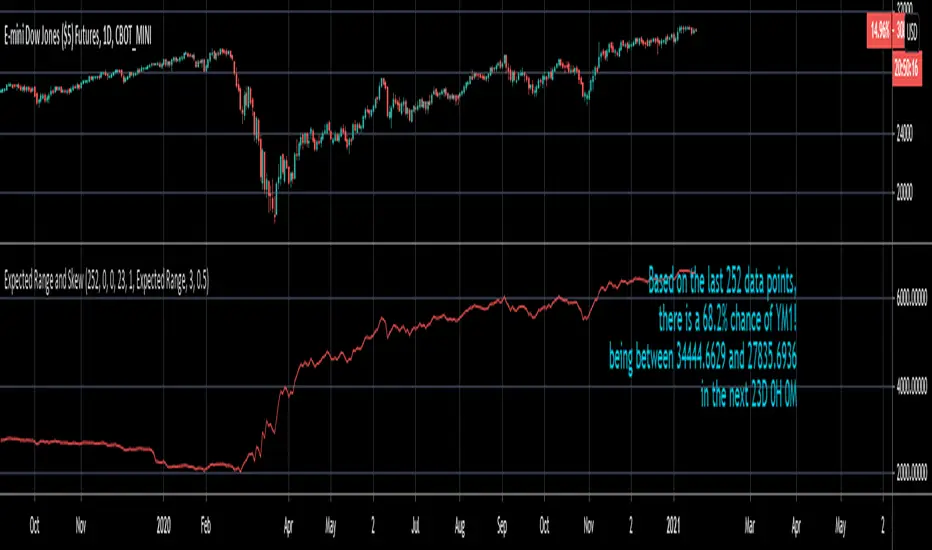
Expected Range and SkewThis is an open source and updated version of my previous "Confidence Interval" script. This script provides you with the expected range over a given time period in the future and the skew of that range. For example, if you wanted to know the expected 1 standard deviation range of MSFT over the next 20 days, this will tell you that. Additionally, this script will also tell you the skew of the expected range.
How to use this script:
1) Enter the length, this will determine the number of data points used in the calculation of the expected range.
2) Enter the amount of time you want projected forward in minutes, hours, and days.
3) Input standard deviation of the expected range.
4) Pick the type of data you want shown from the dropdown menu. Your choices are either the expected range or the skew of the expected range.
5) Enter the x and y coordinates of the label (optional). This is useful so it doesn't impede your view of the plot.
Here are a few notes about this script:
First, the expected range line gives you the width of said range (upper bound - lower bound), and the label will tell you specifically what the upper and lower bounds of the expected range are.
Second, this script will work on any of the default timeframes, but you need to be careful with how far out you try to project the expected range depending on the timeframe you're using. For example, if you're using the 1min timeframe, it probably won't do you any good trying to project the expected range over the next 20 days; or if you're using the daily timeframe it doesn't make sense to try to project the expected range for the next 5 hours. You can tell if the time horizon you're trying to project doesn't work well with the chart timeframe you're using if the current price is outside of either the upper or lower bounds provided in the label. If the current price is within the upper and lower bounds provided in the label, then the time horizon that you're projecting over is reasonable for the chart timeframe you're using.
Third, this script does not countdown automatically, so the time provided in the label will stay the same. For example, in the picture above, the expected range of Dow Futures over the next 23 days from January 12th, 2021 is calculated. But when tomorrow comes it won't count down to 22 days, instead it will show the range over the next 23 days from January 13th, 2021. So if you want the time horizon to change as time goes on you will have to update this yourself manually.
Lastly, if you try to set an alert on this script, you will get a warning about it possibly repainting. This is because of the label, not the plot itself. The label constantly updates itself, which triggers the warning. I tested setting alerts on this script both with and without the inclusion of the label, and without the label the repainting warning did not occur. So remember, if you set an alert on this script you will get a warning about it possibly repainting, but this is because of the label constantly updating, not the plot itself.
SPY Expected Move by VIXThis indicator shows 1 and 2 standard deviation price move from the VWAP based on VIX. Implied Volatility (IV) is being used extensively in the Option world to project the Expected Move for the underlying instrument. VIX is used as a proxy for SPY's IV for 30 days.
This indicator is meaningful only for SPY but can be used in any other instrument which has a strong correlation to SPY.
