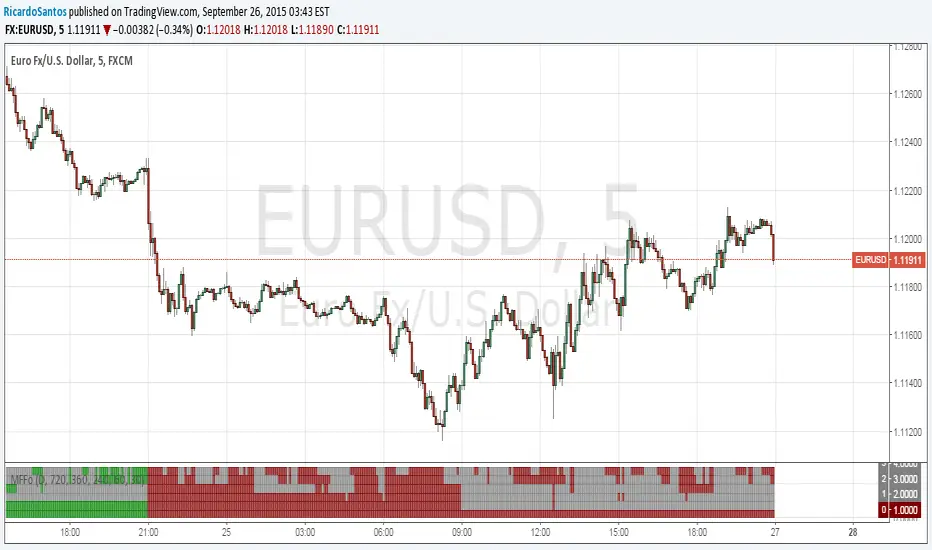
[RS]Market Fractility Flow Oscillator V0EXPERIMENTAL:
same as MTF-BIAS. but slightly more practical, reads market fractality flow into a oscillator.
Experimental
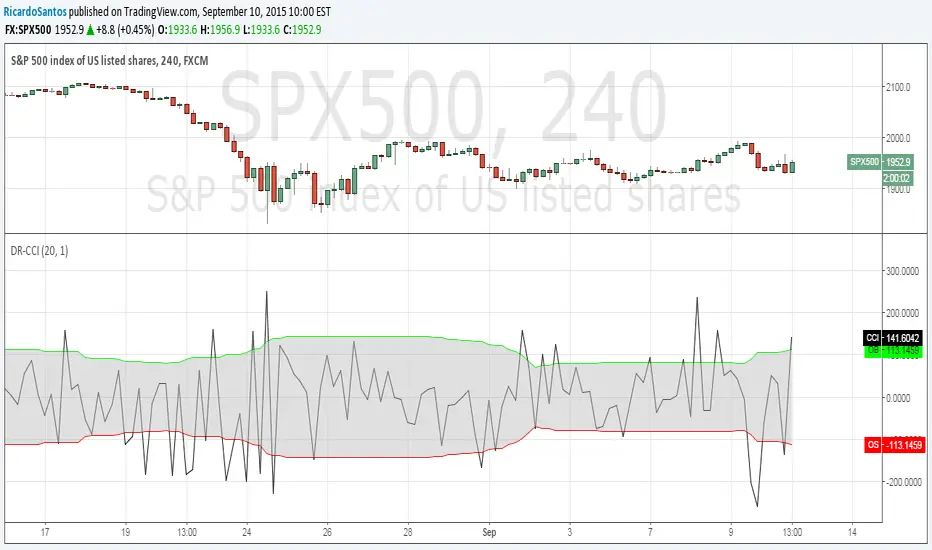
[RS]Linear Regression Bands V2EXPERIMENTAL:
added titles to inputs and plots for better understanding what is what(DCC)
M = middle, T = top, B = bottom, S = signal.


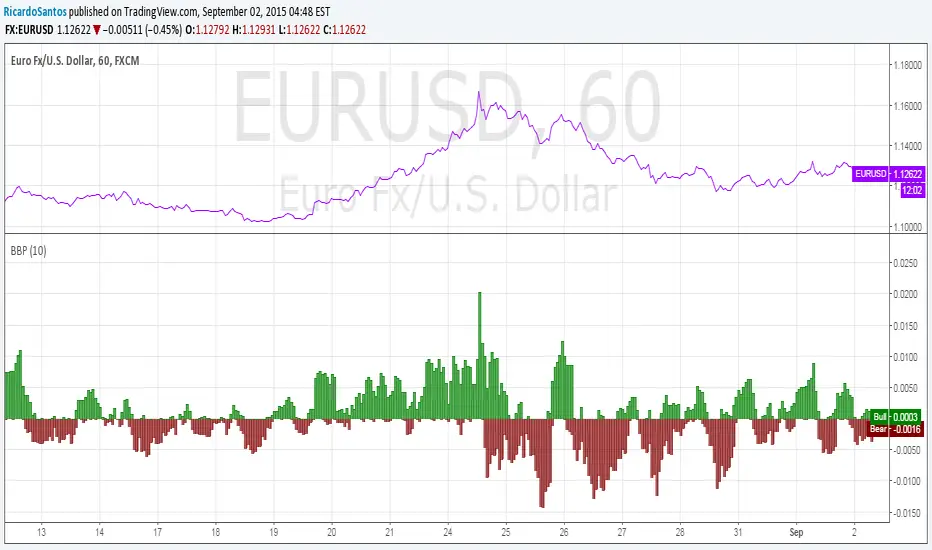
[RS]Linear Regression Bull and Bear Power V0EXPERIMENTAL:
Bull and Bear power based on linear regression (this is a non lagging oscillator, the parameter are for the lookup window for the donchian extremes)
this indicator can also be used for convergence/divergence.
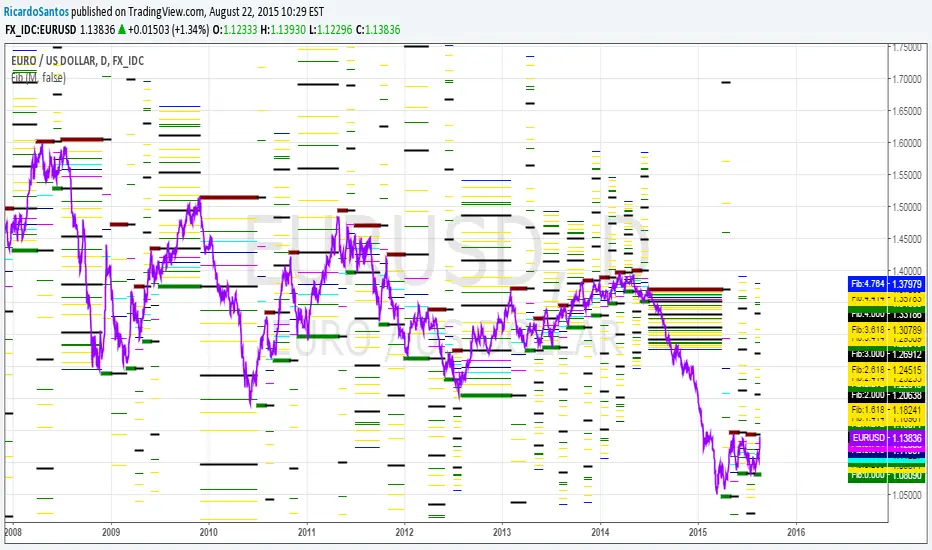
[RS]MTF Fibonacci Cycles V0EXPERIMENTAL:
Fibonacci rate levels based on price advance/decline, can be used to make visualizations of fib clusters or for cycles.
[RS]Timed Percentual Change V0EXPERIMENTAL: time based percentual change.
note: each series uses it self as base reference so there's a bit a divergence.

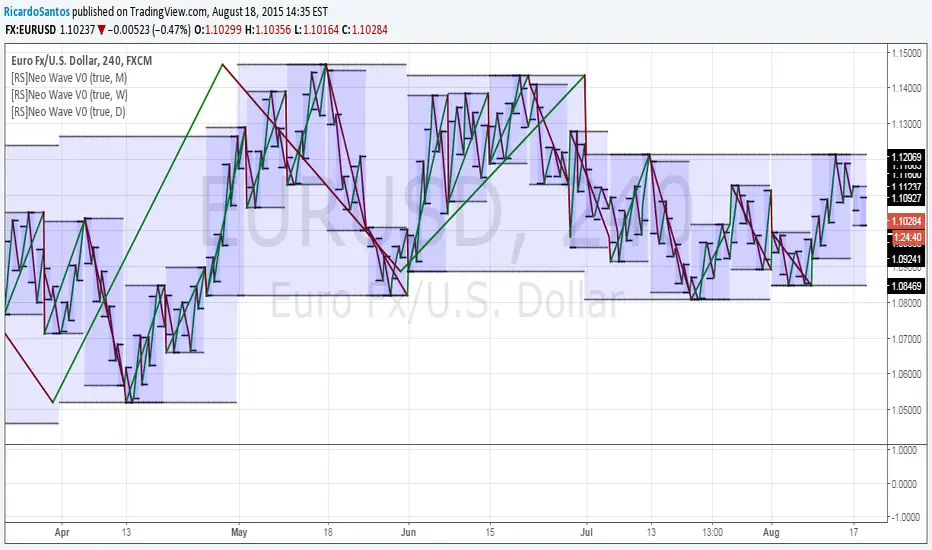
[RS]Neo Wave V0EXPERIMENTAL: Request for IvanLabrie.
Method for reading Neo Wave's.
note: some issues arent possible to work around/fix due to limitations in pinescript.
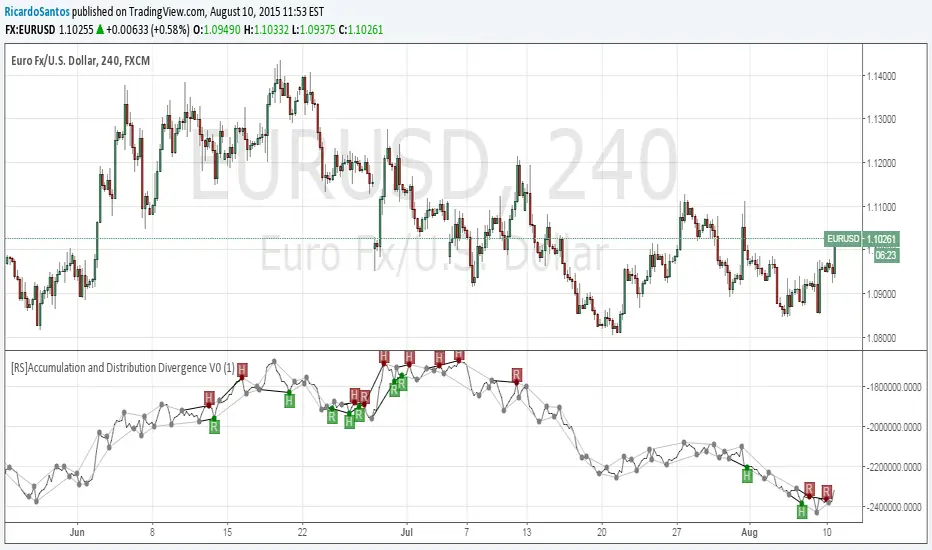
[RS]Accumulation and Distribution Divergence V0EXPERIMENTAL: Accumulation and Distribution Divergence detection.
[RS]MACD Divergence V0EXPERIMENTAL:
MACD Divergence detection.
looks like macd is more prone for missing the extremes in price then the rsi due to lag.

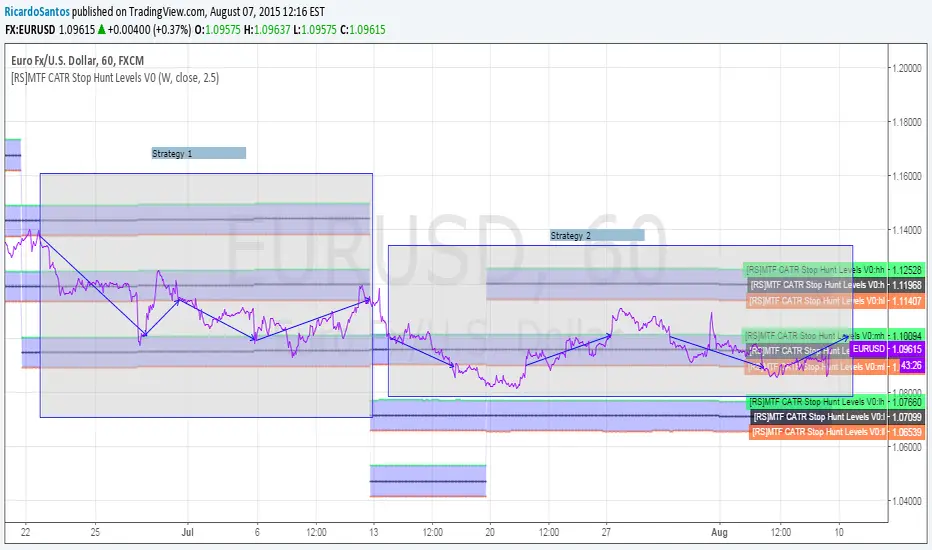
[RS]MTF CATR Stop Hunt Levels V0EXPERIMENTAL:
Adaptation from stop hunt levels:
Uses timeframe and atr to set ranges.
[RS]Multiple Time Frame Range Swing V0EXPERIMENTAL:
(republishing, previous had alot of lines crowding the chart)
MTF Range Swing.

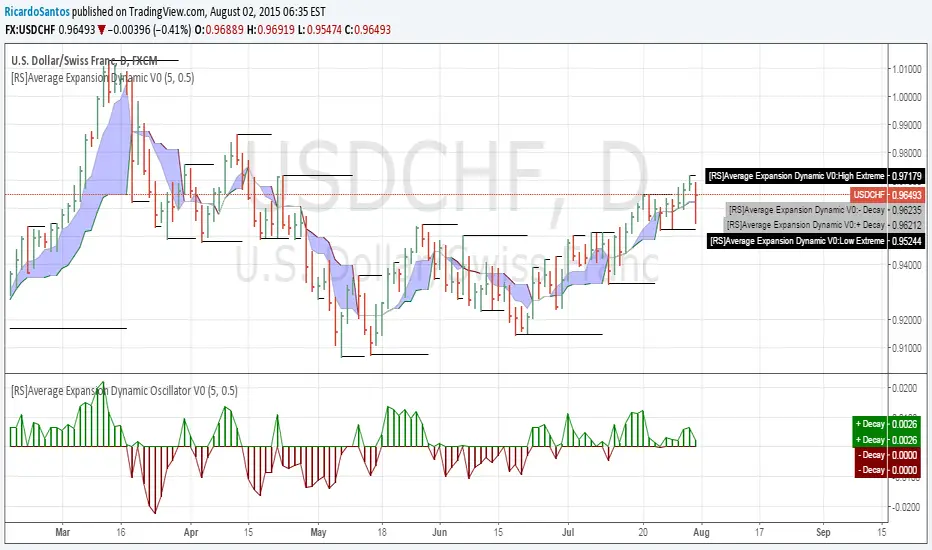
[RS]Average Expansion Dynamic Oscillator V0EXPERIMENTAL:
Oscillator Version.
calculation of extremes and price range for averaging movement.
while price is above market is rising, when bellow market is falling. also can discern strength from the gap of the averages.

[RS]Average Expansion Dynamic V0EXPERIMENTAL: calculation of extremes and price range for averaging movement.
while price is above market is rising, when bellow market is falling. also can discern strength from the gap of the averages.
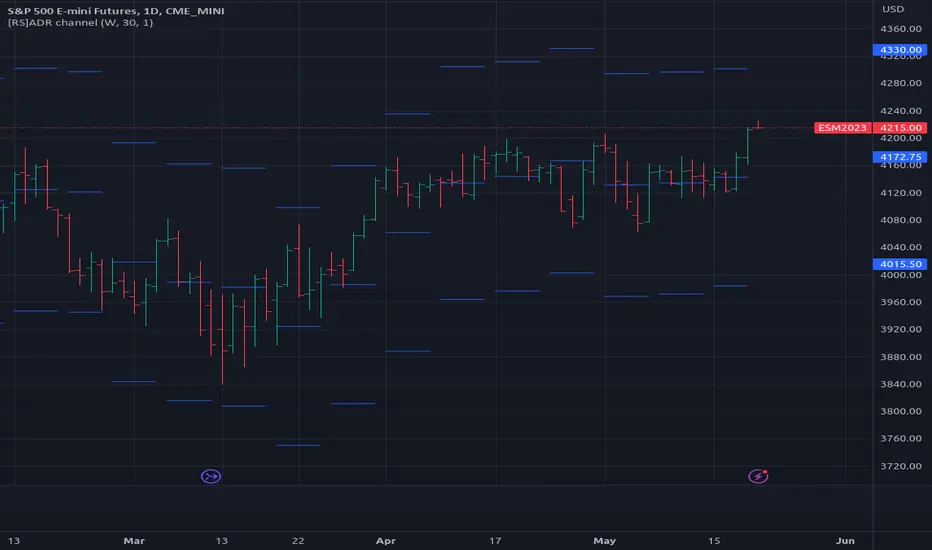
[RS]ADR channel V0EXPERIMENTAL: needs validation if calculation is correct for the ADR. granted it has more use with optional timeframe.

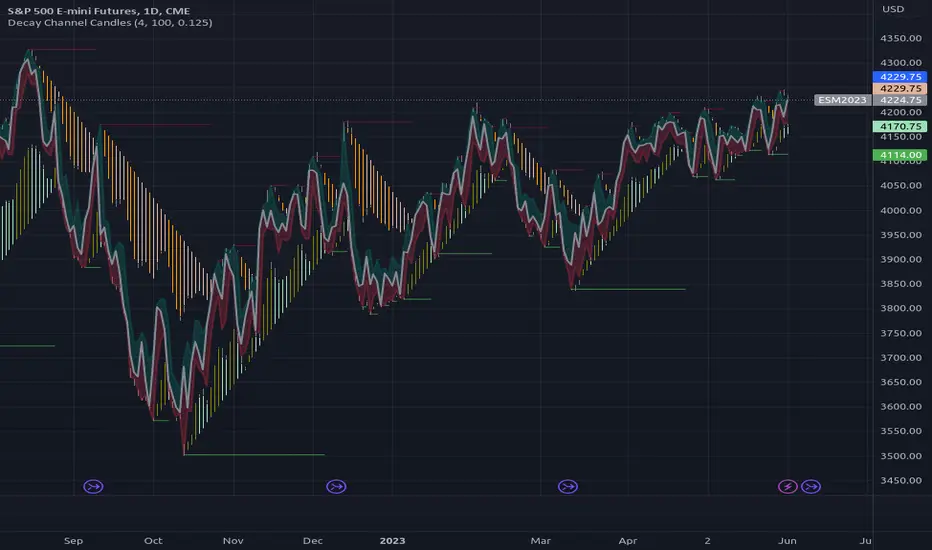
[RS]Decay Channel Candles V0EXPERIMENTAL: Experiment using Linear Regression based on %atr for decay(decay option is a mutiplier for the atr).
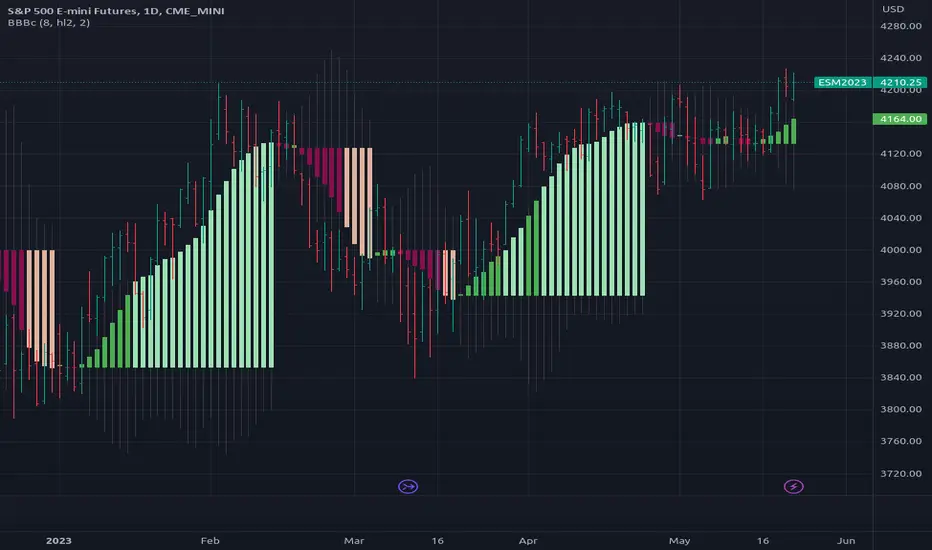
[RS]Bollinger Bands Breakout Candles V0EXPERIMENTAL: a experiment using bollingers and directional momentum, Breakout detector.
[RS]MTF Donchian Range Wave Sync V1EXPERIMENTAL: using Donchian channels with diferent lengths to extract multiple time frame's to extract price in range rates. the title may be a tiny bit misleading tho -_-''
update: reversed colors, joined the line zone space to make the waves visually stand out more.

[RS]ZigZag (MA, Pattern Recognition) V2EXPERIMENTAL:
Best method so far to draw the zigzag.
Multi time frame options


[RS]Temporal Fractal Flow Study V1EXPERIMENTAL: Study on Fractal Price Flow.
UPDATE: Cleaned up, added optional time frames(all), will need to go into options for setup, all settings are off by default.
