Regime Gated Confluence Score [Pineify]Regime Gated Confluence Score
Overview
This pane indicator combines trend, momentum, and volume after a four-state gate selects meaning and weight. The main score and dashboard reconcile signed contributions.
Problem Definition
Fixed-weight confluence hides a regime error. Positive RSI may confirm a trend but mark extension in a range. EMA separation can persist after efficient travel ends. Relative volume shows participation, not acceptance. A permanent sum can stay strong when path efficiency is low, factors disagree, or ATR leaves its baseline, so users cannot tell whether magnitude reflects agreement or one dominant input.
Design Rationale
ATR-normalized EMA separation and slope measure trend across price scales. Centered RSI supplies momentum; RANGE reverses it to express a fade. Volume pressure combines capped relative volume with close location without claiming aggressor flow. EMA spread and path efficiency classify structure; ATR versus baseline identifies displacement. Lower hold thresholds add hysteresis. A trained model would add hidden data assumptions, while fixed weights preserve the failure. Explicit rules accept sensitivity and lag for auditability.
Key Features
Four regimes with hysteresis.
Standardized trend, RSI, and participation factors.
Regime weights, range inversion, missing-volume renormalization, conflict attenuation, exact contribution totals, and confirmed alerts.
How It Works
EMA spread and fast-EMA change are normalized by ATR, blended 65/35, and clipped to -1 through +1. RSI is centered at 50, divided by 25, and clipped. Volume multiplies close location inside the bar by relative volume capped at 2.5 times baseline, then smooths it. If fewer than 80% of volume-window bars are usable, volume is omitted.
Trend strength is absolute normalized EMA spread. Path efficiency divides net movement by total one-bar movement. ATR relative to baseline measures displacement. VOLATILE has priority until its lower hold level clears. Otherwise, strong separation and efficiency enter TREND, weak evidence enters RANGE, and unresolved evidence is TRANSITION.
Trend/momentum/volume weights are 55/30/15 in TREND, 15/60/25 in RANGE, 40/35/25 in VOLATILE, and 35/40/25 in TRANSITION. RANGE reverses only RSI. Missing volume removes its weight and renormalizes the others. Agreement divides absolute net contribution by total absolute contribution and sets a 0.55-to-1 gate; VOLATILE adds an ATR penalty. Gated components sum to the score. Warm-up or invalid threshold and EMA ordering blocks output with a diagnostic.
How Multiple Indicators Work Together
Trend estimates structure, momentum locates bounded pressure, and volume tests participation plus bar acceptance. The regime interprets them before combination. Without range inversion, extension becomes a continuation vote; without trend, brief momentum can dominate; without volume, weights must be renormalized. Agreement converts remaining conflict into lower magnitude rather than hiding it.
Trading Ideas and Insights
Use the score as context, not an order. A confirmed threshold cross during TREND identifies aligned conditions. In RANGE, check whether trend or volume opposes inverted momentum before considering a fade. In VOLATILE, a compressed gate shows ATR displacement discounting the raw sum. A strong component beside a modest total indicates conflict.
Unique Aspects
The contribution is the sequence of classification, interpretation change, weighting, and attenuation. RANGE reverses momentum while other factors can veto it; hysteresis separates trend entry from persistence; missing volume is removed; and agreement scales every component so the ledger equals the score. The halo shows magnitude, the background shows regime, and the table exposes construction.
How to Use
Start with defaults and compare the regime label with visible path behavior. Wait for warm-up. Keep the ledger visible to see whether structure, oscillator pressure, or participation drives direction. Use confirmed alerts when closing-state transitions matter. Contribution lines are diagnostic; the halo and background form the primary view. Omitted volume means a disclosed two-factor score.
Customization
EMA lengths and slope lookback control structural response; RSI length controls momentum sensitivity. Volume baseline and smoothing trade speed for stability. Regime length changes path efficiency and the ATR baseline. Entry thresholds must exceed hold thresholds. Raising the score threshold reduces alert frequency but does not establish better forecasting. Visual switches change display only.
Assumptions and Limitations
The script uses chart OHLC and reported volume. Exchange, tick, and absent volume differ; close-location volume is only a proxy. EMA, ATR, RSI, and rolling baselines lag. RANGE can fade a breakout, hysteresis can delay exits, and attenuation can suppress an early shock.
Realtime factors, regime, colors, and score can change before close; alerts require confirmation. No request calls, future data, pivots, or negative offsets are used. The script does not model liquidity, news, sizing, entries, stops, or exits. Thresholds do not establish expected return. Sparse bars and unreliable volume can distort evidence.
Conclusion
This replaces a fixed sum with an inspectable state process. The score and ledger show weights, conflict attenuation, and missing-data effects. Keep separate risk and execution rules.
.
Indicatore

Mean Reversion Pro 📊 Mean Reversion Pro — Data-Driven Edge on Any Market, Any Timeframe
Most mean reversion indicators tell you the price is "too far" from the moving average. This one tells you exactly how far is statistically worth trading — using your own chart's historical data as proof.
Works on all instruments and timeframes: futures (NQ, ES, CL, GC…), crypto (BTC, ETH, SOL…), forex (EUR/USD, GBP/USD…), indices (SPX, DAX, NASDAQ…), stocks, commodities — anything with a price and volume.
─────────────────────────────────────────
🔍 WHAT THIS INDICATOR DOES
─────────────────────────────────────────
Mean Reversion Pro silently analyses every historical instance where price deviated from a moving average by a given distance. For each of 15 tested threshold levels it computes:
• Win rate — % of times price returned to the MA within the timeout
• Expectancy — (win-rate × avg MFE) − (loss-rate × avg MAE)
• Profit Factor — gross gain / gross loss ratio
• Avg MAE — average adverse excursion (how far against you before reverting)
• Avg MFE — average favourable excursion (how far in your favour)
• Avg return time — average bars needed to reach the MA
It then automatically selects the threshold with the highest expectancy that also satisfies your minimum win-rate and minimum occurrences filters — and only then shows a signal. No manual optimisation. No curve-fitting.
─────────────────────────────────────────
⚙️ KEY FEATURES
─────────────────────────────────────────
✅ Universal — works on futures, crypto, forex, indices, stocks, commodities
✅ 3 threshold modes: fixed Points, ATR multiples, Z-Score (adapts to any volatility regime)
✅ 5 MA types: EMA, SMA, WMA, VWMA, Hull MA
✅ Auto-optimised threshold — the indicator finds the best level by itself
✅ Real-time dashboard: win-rate, expectancy, profit factor, MAE, MFE, return time (Long & Short)
✅ Dynamic bands: 1× and 1.5× optimal threshold zones drawn on the chart
✅ Non-repainting signals — only fires on confirmed, closed bars
✅ Optional filters: trend (EMA 50), volume, US session, minimum ATR
✅ Minimum history guard — signals are held until enough bars have been analysed
✅ All parameters fully exposed and documented with tooltips
─────────────────────────────────────────
📈 WHO IS THIS FOR
─────────────────────────────────────────
• Futures traders — NQ, MNQ, ES, MES, CL, GC, SI, ZB…
• Crypto traders — BTC, ETH, SOL and all altcoins on any exchange
• Forex traders — all major, minor and exotic pairs
• Index traders — SPX, NDX, DAX, FTSE, CAC, Nikkei…
• Stock traders and swing traders looking for mean reversion pullbacks
• Prop firm traders who need a systematic, rules-based edge
• Any trader tired of arbitrary support/resistance levels with no statistical backing
─────────────────────────────────────────
🧠 HOW TO USE IT
─────────────────────────────────────────
1. Apply to any chart on any timeframe
2. Let at least 500 bars load (recommended: 1000–2000 for robust statistics)
3. Choose Threshold Mode:
— Points → best for futures and indices (fixed price distances)
— ATR → best for crypto and forex (volatility-adjusted)
— Z-Score → best for statistical/quant approaches
4. Set your minimum Win Rate (default 65%) and minimum Occurrences (default 15)
5. A signal appears only when all statistical conditions are met AND your filters pass
6. Read the dashboard to assess setup quality before entering a trade
─────────────────────────────────────────
💡 WHY EXPECTANCY MATTERS MORE THAN WIN RATE
─────────────────────────────────────────
A strategy with 80% win rate can still lose money if the average loss is 5× the average win. Mean Reversion Pro uses expectancy — the only metric that combines win rate, average gain and average loss into a single number — as its selection criterion. A signal only appears when the math is in your favour.
─────────────────────────────────────────
⚠️ DISCLAIMER
─────────────────────────────────────────
This indicator is a decision-support tool only. It does not provide financial advice and does not guarantee future results. Past statistical performance is not indicative of future performance. Always use proper risk management. Indicatore

Trend Strength Meter [AGPro Series]Trend Strength Meter
⚡ OVERVIEW
Trend Strength Meter is a multi-factor composite oscillator that quantifies how strong a directional trend actually is, on a single 0-to-100 score. It merges five independent trend dimensions (ADX, slope angle, momentum ROC, moving-average alignment, and pullback depth) into one weighted reading, then classifies the market into three clear states: Strong Trend (80+), Mild Trend (50-80), and Weak / Range (<50). The goal is to give a trader the answer to one of the most common daily questions in technical analysis: "Is the trend strong enough to act on right now, or is it fading?"
The indicator is built for discretionary and systematic traders who want a single, normalized number instead of reading half a dozen separate trend tools. It is scale-invariant (ATR-normalized) and works across timeframes and instruments.
🎯 UNIQUE EDGE
Trend-strength tools usually give a single-factor reading (for example, ADX alone) which can be misleading. ADX can be high during range contractions, slopes can spike during noise, MA stacks can be aligned while price sits deep in pullback. This indicator fuses all five dimensions so that no single factor can dominate the score without confirmation from the others.
Three design choices set it apart:
1. Weighted multi-factor composite. Every factor is independently normalized to 0-100, then combined with user-adjustable weights that auto-normalize. A Strong reading therefore requires broad agreement across independent trend dimensions, not just one signal firing.
2. Dominant Factor readout. The information panel shows which of the five factors is contributing most to the current score, so the trader understands why the score is where it is. A score of 84 driven by ADX and a score of 84 driven by Alignment are structurally different markets, and the readout makes that visible.
3. Historical context built in. The panel exposes Historical Max Score over a configurable lookback window, and Strong-Trend Duration (how many bars the score has held above the Strong threshold). Both of these help gauge trend maturity and exhaustion risk.
📊 METHODOLOGY
The composite score is built from five independently scored factors, each normalized to 0-100:
• Factor 1 — ADX. Directional movement strength from the standard DMI/ADX system, linearly mapped so that ADX = 60 maps to a score of 100.
• Factor 2 — Slope Angle. The slope of an EMA over its length window, normalized by ATR to be scale-invariant, then converted to a 0-100 score via an arctangent curve. High slope in either direction yields a high score.
• Factor 3 — Momentum ROC. Rate of Change normalized by ATR and converted to a bounded 0-100 value. Captures impulse magnitude independent of price scale.
• Factor 4 — MA Alignment. Stacked EMA alignment across Fast / Mid / Slow timeframes, plus price position relative to the fast MA. Full bullish or bearish stack yields 100; partial stacks are scored proportionally (70, 40, or 15).
• Factor 5 — Pullback Depth. Distance from the nearest recent extreme (highest high or lowest low over lookback) measured in ATR units. Shallow pullback = strong trend = high score.
Each factor is multiplied by its weight, summed, and divided by total weight to produce the final 0-100 score. All five weights are independently adjustable and auto-normalize, so changing one weight does not force manual rebalancing of the others.
Directional bias (Bull / Bear / Range) is determined by the combination of DMI crossover state and close-vs-mid-MA position. State color shifts between strong bull green, strong bear magenta, neutral yellow, and weak gray based on score plus direction.
🔥 VISUAL SYSTEM
Six coordinated visual elements deliver the information without clutter:
• Score histogram on the sub-panel, colored per bar by that bar's own score level (green for Strong, yellow for Mild, gray for Weak / Range). Each historical bar shows its true state at the time, not the current state.
• Horizontal reference lines at the Strong (green) and Mild (yellow) thresholds on the sub-panel.
• Historical Max step line in indigo accent, showing the highest score reached within the lookback window, so past trend peaks are immediately visible.
• Mini Gauge on the right edge of the sub-panel. A compact vertical meter split into two halves: left half shows the fixed 0-100 zone reference (Weak / Mild / Strong), right half fills up to the current score, with a bold needle line marking the exact level.
• Price badge floating above the last candle, showing "TSM " so the reading is visible without needing to look at the panel.
• Information panel on the price chart with seven rows: Score, State, Direction, Dominant Factor, Historical Max, and Strong Bars duration.
🧭 SIGNALS AND ALERTS
Three built-in alerts:
• Strong Bull Entry — Score crosses above the Strong threshold while directional bias is Bull.
• Strong Bear Entry — Score crosses above the Strong threshold while directional bias is Bear.
• Trend Fade — Score drops below the Mild threshold, indicating the trend is weakening.
All alerts fire once per bar close, so there is no intra-bar repainting.
🧮 KEY INPUTS
Core Settings
• ADX Length, Slope MA Length, Momentum ROC Length, MA Alignment Fast / Mid / Slow, Pullback ATR Length
• Score Smoothing (EMA applied to score for optional overlay line)
• Strong Threshold (default 80), Mild Threshold (default 50), Historical Lookback (default 100 bars)
Factor Weights (auto-normalized)
• ADX 30, Slope 20, Momentum 20, Alignment 20, Pullback 10
Visual
• Badge toggle, Background tint toggle, Reference lines toggle, Mini Gauge toggle, Historical Max line toggle, Smoothed Score line toggle, Label size, Badge ATR offset
Panel
• Show / hide, Position (6 anchors), Theme (Dark / Light), Font size
📈 HOW TO USE
1. Add the indicator to any chart and any timeframe. Defaults are calibrated for 4H / Daily; for lower timeframes consider reducing the ADX and ROC lengths.
2. Use the 0-100 score as a regime filter. Many trend-following setups perform better when the score is above 50, and breakout / continuation setups perform best when the score is crossing above 80 with a clear Bull or Bear direction.
3. Watch the Dominant Factor. A score of 85 driven primarily by Momentum may fade fast; the same score driven by Alignment tends to be more structural.
4. Use Historical Max and Strong Bars to gauge maturity. A Strong-Bars reading of 30+ on a daily chart often signals late-cycle conditions where continuation risk increases and fresh entries need tighter risk management.
5. Combine with structure tools (support / resistance, order blocks, market-structure tools) for entries. This indicator is designed to answer "how strong is the trend," not "where do I enter."
⚠️ LIMITATIONS AND TRANSPARENCY
• This is an indicator, not a trading strategy. It does not produce buy / sell recommendations and it does not backtest trade outcomes.
• The score is a lagging composite built from historical price data. It does not predict future price movement.
• During sharp regime transitions (news events, gap opens), the score can change rapidly from one bar to the next. This is by design, not a bug.
• Factor weights are user-adjustable. Defaults are a reasonable starting point but may need tuning per instrument / timeframe.
• The Pullback factor assumes trending behavior. In tight consolidations it can read misleadingly high, which is why the Dominant Factor readout exists as a cross-check.
• No-repaint: all calculations are based on confirmed (closed) bar data; alerts fire on bar close only.
📌 RISK DISCLOSURE
Trading carries substantial risk. This indicator is an analytical tool for research and study purposes and does not constitute financial advice, a trading signal, or a recommendation to buy or sell any instrument. Past behavior of any indicator is not indicative of future results. Users are solely responsible for their trading decisions and should conduct their own due diligence and risk management.
Indicatore

Setup Quality Scorecard [AGPro Series]Setup Quality Scorecard
Setup Quality Scorecard grades every bar on a transparent 0-100 scale across ten independent confluence dimensions. Instead of another signal generator, it is a quality filter: it tells you how strong the current setup is, which factors are firing, and how often similar past setups have followed through. Works on any symbol, any timeframe.
🔹 OVERVIEW
Every trader has the same question before pulling the trigger: "Is this setup actually good, or am I forcing it?" Setup Quality Scorecard answers that question with a single auditable number. The composite score blends ten orthogonal factors — trend, momentum, volume, volatility, structure, S/R proximity, divergence, candle quality, session context, and higher-timeframe alignment — into a weighted 0-100 quality rating. Bars scoring above the A-Tier threshold are marked with support/resistance-style zones on the chart, so high-quality setup regions stay visible even as the market moves on.
🔹 UNIQUE EDGE
Most quality indicators hide their internals behind a black-box algorithm. This one is fully transparent. Every factor exposes its own 0-10 score in the panel, every factor weight is user-adjustable, and every historical signal is evaluated against a forward-looking hit-rate test. There are no secret filters, no proprietary confidence bands, and no cherry-picked backtest. If a setup scores 87, you can see exactly which factors contributed and which did not.
🔹 METHODOLOGY
Each of the ten factors is computed independently on the current bar and normalized to a 0-10 scale:
1. Trend Alignment — EMA 20/50/200 stack plus slope confirmation
2. Momentum — RSI zone position combined with 3-bar RSI delta
3. Volume Context — relative volume versus 20-period SMA, calibrated for real-world distribution
4. Volatility Regime — ATR percentile over the last 100 bars, favoring mid-range regimes
5. Structure — HH/HL or LH/LL confirmation via recent pivots
6. S/R Proximity — ATR-normalized distance to the nearest pivot level
7. Divergence — price-versus-RSI regular divergence captured at pivot time
8. Candle Quality — body-to-range ratio and wick balance
9. Session Context — active trading session weighting (London/NY overlap prioritized)
10. HTF Agreement — graduated higher-timeframe alignment scoring (full stack, partial stack, opposed regimes)
The ten factor scores are weighted by user-adjustable coefficients, summed, and normalized to produce the final 0-100 composite. Tier labels (S / A / B / C / D) are assigned against user-configurable thresholds.
🔹 SIGNALS AND ALERTS
When a bar crosses into A-Tier or higher, a zone is drawn using support/resistance-style geometry (body plus a small ATR cushion). Zones merge automatically when adjacent qualifying setups share the same directional bias, preventing chart clutter. Each zone is labeled with its tier and score in compact A·83 format, with a dotted leader line connecting the label to the zone edge.
Four built-in alert conditions are exposed:
- S-Tier Setup Detected (score crosses the S-Tier threshold)
- A-Tier Setup Detected (score crosses the A-Tier threshold)
- New Bullish Quality Setup (first A-tier bullish bar in a run)
- New Bearish Quality Setup (first A-tier bearish bar in a run)
🔹 KEY INPUTS
- General: Higher timeframe reference, rolling history window, forward evaluation bars
- Thresholds: S / A / B / C tier cutoffs, fully adjustable
- Factor Weights: ten independent sliders, 0.0 to 2.0, tune the scorer to your style
- Zones: adaptive extend (auto or manual), merge window, max height cap in ATR units, maximum age
- Labels: on-chart label mode (A-Tier only, S-Tier only, off), size presets
- Panel: position, size, factor breakdown toggle
🔹 HOW TO USE
Start with defaults and observe for a full session on your chart. Trend traders should raise the Trend and HTF Align weights. Reversal traders should raise Divergence, Structure, and S/R Proximity. Use the Active count in the panel as a quick filter: fewer than three factors above seven generally means a weak setup regardless of composite score. Use the hit-rate number to sanity-check whether your current configuration is performing on this asset and timeframe — if it is below 50 percent on a large sample, revisit your weight assignments.
🔹 LIMITATIONS AND TRANSPARENCY
The hit-rate metric is backward-looking. It measures how often past A-tier signals produced a one-ATR directional move within the next N bars. It is not a forecast of future performance. A hit rate with fewer than twenty signals is flagged with an info marker because the sample size is not yet statistically meaningful. Factor definitions are static — they do not adapt to regime changes automatically. Session weighting assumes standard crypto and equity session times in UTC; adjust if you are trading exotic hours. The script uses pivot-based structure, which lags by the pivot length on the right edge of the chart (a standard trade-off for noise suppression).
🔹 RISK DISCLOSURE
This indicator is an analytical tool, not financial advice. It does not predict future price movements. A high quality score does not guarantee a winning trade. Past performance of any displayed signal does not indicate future results. Always use proper risk management and position sizing. Never trade with capital you cannot afford to lose. Indicatore

Indicatore

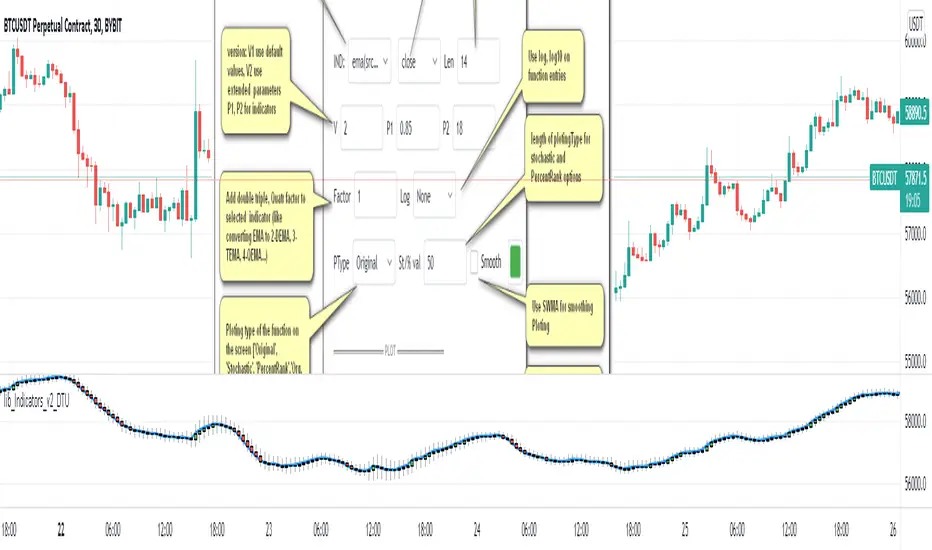
Indicator Functions with Factor and HeikinAshiHello all,
This indicator returns below selected indicators values with entered parameters.
Also you can add factorization, functions candles, function HeikinAshi and more to the plot.
VERSION:
Version 1: returns series only source and Length with already defined default values
Version 2: returns series with source, Length, p1 and p2 parameters according to the indicator definition (ex: )
PARAMETERS p1 p2
for defining multi arguments (See indicators list) indicator input value usable with verison=V2 selected.. ex: for alma( src , len ,offset=0.85,sigma=6), set source=source, len=length, p1=0.85 an p2=6
FACTOR:
Add double triple, Quadruple factors to selected indicator (like converting EMA to 2-DEMA, 3-TEMA, 4-QEMA...)
1-Original
2-Double
3-Triple
4-Quadruple
LOG
Log: Use log, log10 on function entries
PLOTTING:
PType: Plotting type of the function on the screen
Original :use original values
Org. Range (-1,1): usable for indicators between range -1 and 1
Stochastic: Convert indicator values by using stochastic calculation between -1 & 1. (use AT/% length to better view)
PercentRank: Convert indicator values by using Percent Rank calculation between -1 & 1. (use AT/% length to better view)
ST/%: length for plotting Type for stochastic and Percent Rank options
Smooth: Use SWMA for smoothing the function
DISPLAY TYPES
Plot Candles: Display the selected indicator as candle by implementing values
Plot Ind: Display result of indicator with selected source
HeikinAshi: Display Selected indicator candles with Heikin Ashi calculation
INDICATOR LIST:
hide = 'DONT DISPLAY', //Dont display & calculate the indicator. (For my framework usage)
alma = 'alma( src , len ,offset=0.85,sigma=6)', // Arnaud Legoux Moving Average
ama = 'ama( src , len ,fast=14,slow=100)', //Adjusted Moving Average
acdst = 'accdist()', // Accumulation/distribution index.
cma = 'cma( src , len )', //Corrective Moving average
dema = 'dema( src , len )', // Double EMA (Same as EMA with 2 factor)
ema = 'ema( src , len )', // Exponential Moving Average
gmma = 'gmma( src , len )', //Geometric Mean Moving Average
hghst = 'highest( src , len )', //Highest value for a given number of bars back.
hl2ma = 'hl2ma( src , len )', //higest lowest moving average
hma = 'hma( src , len )', // Hull Moving Average .
lgAdt = 'lagAdapt( src , len ,perclen=5,fperc=50)', //Ehler's Adaptive Laguerre filter
lgAdV = 'lagAdaptV( src , len ,perclen=5,fperc=50)', //Ehler's Adaptive Laguerre filter variation
lguer = 'laguerre( src , len )', //Ehler's Laguerre filter
lsrcp = 'lesrcp( src , len )', //lowest exponential esrcpanding moving line
lexp = 'lexp( src , len )', //lowest exponential expanding moving line
linrg = 'linreg( src , len ,loffset=1)', // Linear regression
lowst = 'lowest( src , len )', //Lovest value for a given number of bars back.
pcnl = 'percntl( src , len )', //percentile nearest rank. Calculates percentile using method of Nearest Rank.
pcnli = 'percntli( src , len )', //percentile linear interpolation. Calculates percentile using method of linear interpolation between the two nearest ranks.
rema = 'rema( src , len )', //Range EMA (REMA)
rma = 'rma( src , len )', //Moving average used in RSI . It is the exponentially weighted moving average with alpha = 1 / length.
sma = 'sma( src , len )', // Smoothed Moving Average
smma = 'smma( src , len )', // Smoothed Moving Average
supr2 = 'super2( src , len )', //Ehler's super smoother, 2 pole
supr3 = 'super3( src , len )', //Ehler's super smoother, 3 pole
strnd = 'supertrend( src , len ,period=3)', //Supertrend indicator
swma = 'swma( src , len )', //Sine-Weighted Moving Average
tema = 'tema( src , len )', // Triple EMA (Same as EMA with 3 factor)
tma = 'tma( src , len )', //Triangular Moving Average
vida = 'vida( src , len )', // Variable Index Dynamic Average
vwma = 'vwma( src , len )', // Volume Weigted Moving Average
wma = 'wma( src , len )', //Weigted Moving Average
angle = 'angle( src , len )', //angle of the series (Use its Input as another indicator output)
atr = 'atr( src , len )', // average true range . RMA of true range.
bbr = 'bbr( src , len ,mult=1)', // bollinger %%
bbw = 'bbw( src , len ,mult=2)', // Bollinger Bands Width . The Bollinger Band Width is the difference between the upper and the lower Bollinger Bands divided by the middle band.
cci = 'cci( src , len )', // commodity channel index
cctbb = 'cctbbo( src , len )', // CCT Bollinger Band Oscilator
chng = 'change( src , len )', //Difference between current value and previous, source - source.
cmo = 'cmo( src , len )', // Chande Momentum Oscillator . Calculates the difference between the sum of recent gains and the sum of recent losses and then divides the result by the sum of all price movement over the same period.
cog = 'cog( src , len )', //The cog (center of gravity ) is an indicator based on statistics and the Fibonacci golden ratio.
cpcrv = 'copcurve( src , len )', // Coppock Curve. was originally developed by Edwin "Sedge" Coppock (Barron's Magazine, October 1962).
corrl = 'correl( src , len )', // Correlation coefficient . Describes the degree to which two series tend to deviate from their ta. sma values.
count = 'count( src , len )', //green avg - red avg
dev = 'dev( src , len )', //ta.dev() Measure of difference between the series and it's ta. sma
fall = 'falling( src , len )', //ta.falling() Test if the `source` series is now falling for `length` bars long. (Use its Input as another indicator output)
kcr = 'kcr( src , len ,mult=2)', // Keltner Channels Range
kcw = 'kcw( src , len ,mult=2)', //ta.kcw(). Keltner Channels Width. The Keltner Channels Width is the difference between the upper and the lower Keltner Channels divided by the middle channel.
macd = 'macd( src , len )', // macd
mfi = 'mfi( src , len )', // Money Flow Index
nvi = 'nvi()', // Negative Volume Index
obv = 'obv()', // On Balance Volume
pvi = 'pvi()', // Positive Volume Index
pvt = 'pvt()', // Price Volume Trend
rise = 'rising( src , len )', //ta.rising() Test if the `source` series is now rising for `length` bars long. (Use its Input as another indicator output)
roc = 'roc( src , len )', // Rate of Change
rsi = 'rsi( src , len )', // Relative strength Index
smosc = 'smi_osc( src , len ,fast=5, slow=34)', //smi Oscillator
smsig = 'smi_sig( src , len ,fast=5, slow=34)', //smi Signal
stdev = 'stdev( src , len )', //Standart deviation
trix = 'trix( src , len )' , //the rate of change of a triple exponentially smoothed moving average .
tsi = 'tsi( src , len )', //True Strength Index
vari = 'variance( src , len )', //ta.variance(). Variance is the expectation of the squared deviation of a series from its mean (ta. sma ), and it informally measures how far a set of numbers are spread out from their mean.
wilpc = 'willprc( src , len )', // Williams %R
wad = 'wad()', // Williams Accumulation/Distribution .
wvad = 'wvad()' //Williams Variable Accumulation/Distribution
I will update the indicator list when I will update the library
Thanks to tradingview, @RodrigoKazuma for their open source indicators
Indicatore

lib_Indicators_v2_DTULibrary "lib_Indicators_v2_DTU"
This library functions returns included Moving averages, indicators with factorization, functions candles, function heikinashi and more.
Created it to feed as backend of my indicator/strategy "Indicators & Combinations Framework Advanced v2 " that will be released ASAP.
This is replacement of my previous indicator (lib_indicators_DT)
I will add an indicator example which will use this indicator named as "lib_indicators_v2_DTU example" to help the usage of this library
Additionally library will be updated with more indicators in the future
NOTES:
Indicator functions returns only one series :-(
plotcandle function returns candle series
INDICATOR LIST:
hide = 'DONT DISPLAY', //Dont display & calculate the indicator. (For my framework usage)
alma = 'alma(src,len,offset=0.85,sigma=6)', //Arnaud Legoux Moving Average
ama = 'ama(src,len,fast=14,slow=100)', //Adjusted Moving Average
acdst = 'accdist()', //Accumulation/distribution index.
cma = 'cma(src,len)', //Corrective Moving average
dema = 'dema(src,len)', //Double EMA (Same as EMA with 2 factor)
ema = 'ema(src,len)', //Exponential Moving Average
gmma = 'gmma(src,len)', //Geometric Mean Moving Average
hghst = 'highest(src,len)', //Highest value for a given number of bars back.
hl2ma = 'hl2ma(src,len)', //higest lowest moving average
hma = 'hma(src,len)', //Hull Moving Average.
lgAdt = 'lagAdapt(src,len,perclen=5,fperc=50)', //Ehler's Adaptive Laguerre filter
lgAdV = 'lagAdaptV(src,len,perclen=5,fperc=50)', //Ehler's Adaptive Laguerre filter variation
lguer = 'laguerre(src,len)', //Ehler's Laguerre filter
lsrcp = 'lesrcp(src,len)', //lowest exponential esrcpanding moving line
lexp = 'lexp(src,len)', //lowest exponential expanding moving line
linrg = 'linreg(src,len,loffset=1)', //Linear regression
lowst = 'lowest(src,len)', //Lovest value for a given number of bars back.
pcnl = 'percntl(src,len)', //percentile nearest rank. Calculates percentile using method of Nearest Rank.
pcnli = 'percntli(src,len)', //percentile linear interpolation. Calculates percentile using method of linear interpolation between the two nearest ranks.
rema = 'rema(src,len)', //Range EMA (REMA)
rma = 'rma(src,len)', //Moving average used in RSI. It is the exponentially weighted moving average with alpha = 1 / length.
sma = 'sma(src,len)', //Smoothed Moving Average
smma = 'smma(src,len)', //Smoothed Moving Average
supr2 = 'super2(src,len)', //Ehler's super smoother, 2 pole
supr3 = 'super3(src,len)', //Ehler's super smoother, 3 pole
strnd = 'supertrend(src,len,period=3)', //Supertrend indicator
swma = 'swma(src,len)', //Sine-Weighted Moving Average
tema = 'tema(src,len)', //Triple EMA (Same as EMA with 3 factor)
tma = 'tma(src,len)', //Triangular Moving Average
vida = 'vida(src,len)', //Variable Index Dynamic Average
vwma = 'vwma(src,len)', //Volume Weigted Moving Average
wma = 'wma(src,len)', //Weigted Moving Average
angle = 'angle(src,len)', //angle of the series (Use its Input as another indicator output)
atr = 'atr(src,len)', //average true range. RMA of true range.
bbr = 'bbr(src,len,mult=1)', //bollinger %%
bbw = 'bbw(src,len,mult=2)', //Bollinger Bands Width. The Bollinger Band Width is the difference between the upper and the lower Bollinger Bands divided by the middle band.
cci = 'cci(src,len)', //commodity channel index
cctbb = 'cctbbo(src,len)', //CCT Bollinger Band Oscilator
chng = 'change(src,len)', //Difference between current value and previous, source - source .
cmo = 'cmo(src,len)', //Chande Momentum Oscillator. Calculates the difference between the sum of recent gains and the sum of recent losses and then divides the result by the sum of all price movement over the same period.
cog = 'cog(src,len)', //The cog (center of gravity) is an indicator based on statistics and the Fibonacci golden ratio.
cpcrv = 'copcurve(src,len)', //Coppock Curve. was originally developed by Edwin "Sedge" Coppock (Barron's Magazine, October 1962).
corrl = 'correl(src,len)', //Correlation coefficient. Describes the degree to which two series tend to deviate from their ta.sma values.
count = 'count(src,len)', //green avg - red avg
dev = 'dev(src,len)', //ta.dev() Measure of difference between the series and it's ta.sma
fall = 'falling(src,len)', //ta.falling() Test if the `source` series is now falling for `length` bars long. (Use its Input as another indicator output)
kcr = 'kcr(src,len,mult=2)', //Keltner Channels Range
kcw = 'kcw(src,len,mult=2)', //ta.kcw(). Keltner Channels Width. The Keltner Channels Width is the difference between the upper and the lower Keltner Channels divided by the middle channel.
macd = 'macd(src,len)', //macd
mfi = 'mfi(src,len)', //Money Flow Index
nvi = 'nvi()', //Negative Volume Index
obv = 'obv()', //On Balance Volume
pvi = 'pvi()', //Positive Volume Index
pvt = 'pvt()', //Price Volume Trend
rise = 'rising(src,len)', //ta.rising() Test if the `source` series is now rising for `length` bars long. (Use its Input as another indicator output)
roc = 'roc(src,len)', //Rate of Change
rsi = 'rsi(src,len)', //Relative strength Index
smosc = 'smi_osc(src,len,fast=5, slow=34)', //smi Oscillator
smsig = 'smi_sig(src,len,fast=5, slow=34)', //smi Signal
stdev = 'stdev(src,len)', //Standart deviation
trix = 'trix(src,len)' , //the rate of change of a triple exponentially smoothed moving average.
tsi = 'tsi(src,len)', //True Strength Index
vari = 'variance(src,len)', //ta.variance(). Variance is the expectation of the squared deviation of a series from its mean (ta.sma), and it informally measures how far a set of numbers are spread out from their mean.
wilpc = 'willprc(src,len)', //Williams %R
wad = 'wad()', //Williams Accumulation/Distribution.
wvad = 'wvad()' //Williams Variable Accumulation/Distribution.
}
f_func(string, float, simple, float, float, float, simple) f_func Return selected indicator value with different parameters. New version. Use extra parameters for available indicators
Parameters:
string : FuncType_ indicator from the indicator list
float : src_ close, open, high, low,hl2, hlc3, ohlc4 or any
simple : int length_ indicator length
float : p1 extra parameter-1. active on Version 2 for defining multi arguments indicator input value. ex: lagAdapt(src_, length_,LAPercLen_=p1,FPerc_=p2)
float : p2 extra parameter-2. active on Version 2 for defining multi arguments indicator input value. ex: lagAdapt(src_, length_,LAPercLen_=p1,FPerc_=p2)
float : p3 extra parameter-3. active on Version 2 for defining multi arguments indicator input value. ex: lagAdapt(src_, length_,LAPercLen_=p1,FPerc_=p2)
simple : int version_ indicator version for backward compatibility. V1:dont use extra parameters p1,p2,p3 and use default values. V2: use extra parameters for available indicators
Returns: float Return calculated indicator value
fn_heikin(float, float, float, float) fn_heikin Return given src data (open, high,low,close) as heikin ashi candle values
Parameters:
float : o_ open value
float : h_ high value
float : l_ low value
float : c_ close value
Returns: float heikin ashi open, high,low,close vlues that will be used with plotcandle
fn_plotFunction(float, string, simple, bool) fn_plotFunction Return input src data with different plotting options
Parameters:
float : src_ indicator src_data or any other series.....
string : plotingType Ploting type of the function on the screen
simple : int stochlen_ length for plotingType for stochastic and PercentRank options
bool : plotSWMA Use SWMA for smoothing Ploting
Returns: float
fn_funcPlotV2(string, float, simple, float, float, float, simple, string, simple, bool, bool) fn_funcPlotV2 Return selected indicator value with different parameters. New version. Use extra parameters fora available indicators
Parameters:
string : FuncType_ indicator from the indicator list
float : src_data_ close, open, high, low,hl2, hlc3, ohlc4 or any
simple : int length_ indicator length
float : p1 extra parameter-1. active on Version 2 for defining multi arguments indicator input value. ex: lagAdapt(src_, length_,LAPercLen_=p1,FPerc_=p2)
float : p2 extra parameter-2. active on Version 2 for defining multi arguments indicator input value. ex: lagAdapt(src_, length_,LAPercLen_=p1,FPerc_=p2)
float : p3 extra parameter-3. active on Version 2 for defining multi arguments indicator input value. ex: lagAdapt(src_, length_,LAPercLen_=p1,FPerc_=p2)
simple : int version_ indicator version for backward compatibility. V1:dont use extra parameters p1,p2,p3 and use default values. V2: use extra parameters for available indicators
string : plotingType Ploting type of the function on the screen
simple : int stochlen_ length for plotingType for stochastic and PercentRank options
bool : plotSWMA Use SWMA for smoothing Ploting
bool : log_ Use log on function entries
Returns: float Return calculated indicator value
fn_factor(string, float, simple, float, float, float, simple, simple, string, simple, bool, bool) fn_factor Return selected indicator's factorization with given arguments
Parameters:
string : FuncType_ indicator from the indicator list
float : src_data_ close, open, high, low,hl2, hlc3, ohlc4 or any
simple : int length_ indicator length
float : p1 parameter-1. active on Version 2 for defining multi arguments indicator input value. ex: lagAdapt(src_, length_,LAPercLen_=p1,FPerc_=p2)
float : p2 parameter-2. active on Version 2 for defining multi arguments indicator input value. ex: lagAdapt(src_, length_,LAPercLen_=p1,FPerc_=p2)
float : p3 parameter-3. active on Version 2 for defining multi arguments indicator input value. ex: lagAdapt(src_, length_,LAPercLen_=p1,FPerc_=p2)
simple : int version_ indicator version for backward compatibility. V1:dont use extra parameters p1,p2,p3 and use default values. V2: use extra parameters for available indicators
simple : int fact_ Add double triple, Quatr factor to selected indicator (like converting EMA to 2-DEMA, 3-TEMA, 4-QEMA...)
string : plotingType Ploting type of the function on the screen
simple : int stochlen_ length for plotingType for stochastic and PercentRank options
bool : plotSWMA Use SWMA for smoothing Ploting
bool : log_ Use log on function entries
Returns: float Return result of the function
fn_plotCandles(string, simple, float, float, float, simple, string, simple, bool, bool, bool) fn_plotCandles Return selected indicator's candle values with different parameters also heikinashi is available
Parameters:
string : FuncType_ indicator from the indicator list
simple : int length_ indicator length
float : p1 parameter-1. active on Version 2 for defining multi arguments indicator input value. ex: lagAdapt(src_, length_,LAPercLen_=p1,FPerc_=p2)
float : p2 parameter-2. active on Version 2 for defining multi arguments indicator input value. ex: lagAdapt(src_, length_,LAPercLen_=p1,FPerc_=p2)
float : p3 parameter-3. active on Version 2 for defining multi arguments indicator input value. ex: lagAdapt(src_, length_,LAPercLen_=p1,FPerc_=p2)
simple : int version_ indicator version for backward compatibility. V1:dont use extra parameters p1,p2,p3 and use default values. V2: use extra parameters for available indicators
string : plotingType Ploting type of the function on the screen
simple : int stochlen_ length for plotingType for stochastic and PercentRank options
bool : plotSWMA Use SWMA for smoothing Ploting
bool : log_ Use log on function entries
bool : plotheikin_ Use Heikin Ashi on Plot
Returns: float Libreria
Indicatore

Indicatore

Indicatore

Indicatore
