FVG | iSolani
Unveiling Market Inefficiencies with Precision
In fast-moving markets, spotting hidden opportunities often hinges on identifying imbalances between price and value. The FVG | iSolani indicator revolutionises this process by detecting Fair Value Gaps (FVGs) —zones where price action skips over "fair" valuation levels, creating potential retracement targets. Combining advanced filtering, dynamic visualisation, and automated management, this tool empowers traders to pinpoint high-probability setups with unprecedented clarity.
Core Methodology
The indicator employs a multi-layered approach to identify FVGs:
Three-Bar Gap Analysis: Bullish FVGs form when the current low exceeds the high of two bars prior, while bearish FVGs occur when the current high stays below the low of two bars back.
Volatility-Adjusted Filtering: Gaps are measured against a 100-bar standard deviation to exclude insignificant price jumps.
Volume Confirmation: Only gaps accompanied by above-average volume (relative to a 1-bar SMA) are validated, filtering out low-conviction moves.
Auto-Invalidation System: Continuously monitors price action to remove FVG zones once price closes within their range, maintaining chart cleanliness.
Breaking New Ground
This tool introduces three paradigm-shifting innovations:
Volume-Weighted Significance: Unlike traditional FVG detectors, it ties gap validity to volume spikes, emphasising institutional activity.
Adaptive Zone Management: Boxes automatically extend rightward (when enabled) and self-destruct when invalidated, eliminating manual cleanup.
Smart Color Encoding: Offers both monochrome (for multi-timeframe analysis) and standard bull/bear color schemes, with customisable transparency.
Engine Under the Hood
The script operates through four key processes:
Gap Detection: Scans every new bar for three-candle patterns meeting FVG criteria.
Statistical Filtering: Applies user-defined threshold (default: 1σ) to separate meaningful gaps from market noise.
Box Rendering: Draws semi-transparent zones between gap boundaries using TradingView's box objects, styled according to user preferences.
Array-Based Memory: Stores all active FVGs in arrays, enabling real-time validation checks against current price action.
Standard Configuration
Optimised default settings balance visibility and functionality:
Filter: 1.0 (1 standard deviation threshold)
Colors: "Mono" mode (gray boxes) with 90% transparency
Text Labels: Enabled in medium gray
Extension: Gaps extend indefinitely rightward
Borders: Dotted lines with visible outlines
Through its fusion of quantitative rigor and visual adaptability, the FVG | iSolani transforms raw price data into actionable intelligence. By focusing on volume-confirmed gaps and automating zone management, it cuts through market chaos to reveal structurally significant levels—a must-have for traders navigating breakouts, reversals, or order-flow analysis.
Fairvaluegap

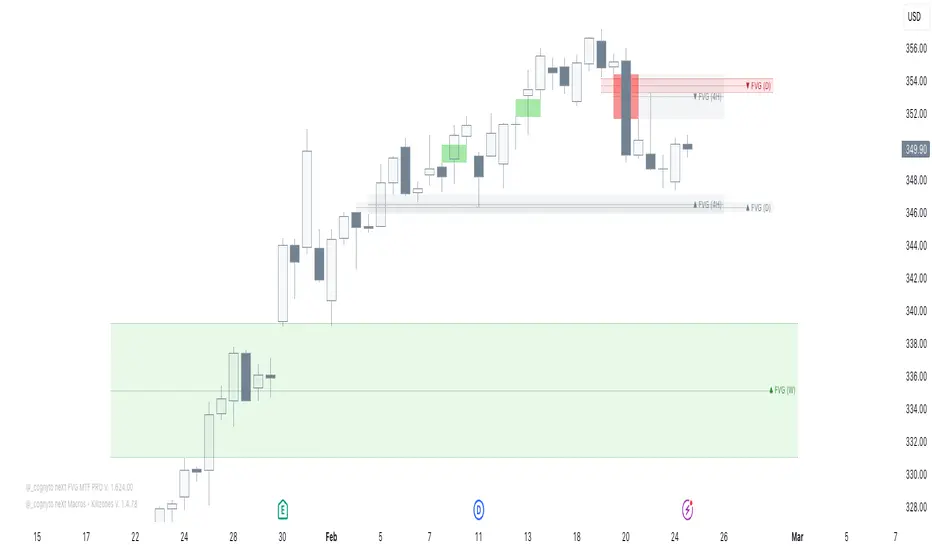
neXt FVG MTF PRO [cognyto]The neXt FVG Multi-Timeframe Indicator represents a remarkable edge in Fair Value Gap analysis. It offers traders a comprehensive and simplified interface to simultaneously monitor Fair Value Gaps across up to 9 different configurable timeframes . This feature shows traders exclusively the closest and most relevant gaps, enabling more precise top-down price action analysis. This makes it particularly valuable for strategies focused on market liquidity and inefficiencies.
Here are the 10 fundamental features that distinguish this indicator
1. Intelligent Visualisation of Next Gaps
An advanced filtering system is implemented to prioritise the visualisation of the nearest FVGs, hence its name -next-, offering a clean FVGs layout on the screen and improving analysis precision. The visualisation system continuously updates according to market price evolution, and as FVGs appear, are mitigated, or eliminated across different timeframes, it updates to ensure a structured and efficient interface.
2. Top-Down Multi-Timeframe Analysis
An efficient visualisation system is implemented to simultaneously manage up to 9 different timeframes. The differentiation between FVGs and their timeframes is established through proportional length in their visual presentation, where higher timeframes extend further to the right, establishing a clear visual hierarchy. The further right the gap extends, the stronger its significance. This structure allows visualization of both current timeframe gaps and those of higher timeframes, facilitating comprehensive market analysis.
3. Alerts
The indicator incorporates a complete notification system that allows users to stay informed in real-time about a wide range of critical events related to Gaps. This system includes customisable alerts for new Fair Value Gaps formation, mitigation notifications, and precise identification of significant gap breakout patterns, technically known as Breakaway gaps.
4. Mitigation
Mitigations represent a fundamental element in technical analysis, identifying zones where price has reached equilibrium. Considering the analytical importance of mitigated gaps, the indicator maintains their visualisation with a specific different color distinction. Additionally, it includes optional functionality for removing mitigated gaps, which can be activated according to user preferences.
5. BISI and SIBI
In addition to the FVGs present in all timeframes, the indicator facilitates precise configuration of BISI and SIBI gaps in the current timeframe, maintaining dynamic visualisation during the additional analysis process alongside other timeframes. This feature optimises the evaluation of historical market imbalances and inefficiencies, offering significant analytical perspectives in the current timeframe, and even refining market entry or exit strategies.
6. Breakaway-Gaps
The indicator provides advanced functionality for identifying and analysing Breakaway-Gaps, presenting in a structured manner the corresponding candle formations that create the Gap. This feature allows precise evaluation of strong market movements, including the assessment of potential retracements and directional patterns in high volatility conditions.
7. Consequent-Encroachment (C.E.)
The indicator implements advanced functionality that visualizes the midpoint of the displacement candle that generates the gap, using precise calculation based on the opening and closing levels of that candle.
8. FVG Fulfilment
The indicator offers advanced configuration options for FVG fullfilmet conditions through two main criteria: confirmation through candle closure that exceeds the established FVG limits, or validation through the intersection of extreme candle levels (maximum/minimum) with the FVG threshold.
9. FVG-Visualisations
Gaps are visualised on the platform once the third candle formation is complete. The system provides optional visualisation functionality during the formation process, although this feature is specifically recommended for predictive analysis, being most effective during daily or weekly market closing intervals. This feature maintains its consistency exclusively in the active timeframe.
10. Customisation
The indicator presents a wide range of advanced customisation options, facilitating comprehensive modification of visual elements. This includes professional adaptation of color palettes, typographic dimensions, line configurations, and design attributes, allowing precise optimisation according to specific user analytical requirements.
This indicator is available exclusively on TradingView. To access it, please see the ‘Author's Instructions’ above and visit our website.
DISCLAIMER
This indicator is provided for informational and educational purposes only. It does not constitute financial advice, trading advice, or any other type of advice, and should not be interpreted as a recommendation to buy, sell, or hold any investment or security of any kind. The information provided by this indicator is not intended as a substitute for professional financial advice. Users of this indicator bear sole responsibility for their trading and investment decisions, including the interpretation of market data and signals generated by this indicator. Past performance is not indicative of future results. Trading financial markets carries substantial risk of loss. Users should conduct their own research, seek professional advice when needed, and exercise due diligence before making any trading or investment decisions.
2:30 [LuciTech]this is a technical analysis tool designed to highlight key price levels and patterns during a specific trading window, based on UK time (Europe/London). It overlays visual elements on the chart, including a 12 PM reference line, Buy Side Liquidity (BSL) and Sell Side Liquidity (SSL) levels, a highlighted 2:30 PM candle, and Engulfing Fair Value Gaps (FVGs). This indicator is intended for traders who focus on intraday price action and liquidity zones.
Features
The 12 PM Line displays a vertical line at 12:00 PM (UK time) to mark the start of the session. It’s customizable, allowing you to enable or disable it and adjust its color.
BSL/SSL Lines track the highest high (BSL) and lowest low (SSL) from 12:00 PM to 2:00 PM (UK time). These lines extend horizontally until 3:30 PM, after which they remain static at their last recorded levels. You can customize them by enabling or disabling visibility, adjusting colors, choosing a line style (solid, dashed, or dotted), and setting the width.
The 2:30 PM Candle highlights the candle at 2:30 PM (UK time) with a distinct color. It’s customizable, with options to enable or disable it and change its color.
Engulfing FVG (Fair Value Gap) identifies bullish and bearish engulfing patterns with a gap from the prior candle’s range. It draws a shaded box over the FVG area, and you can customize it by enabling or disabling it and adjusting the box color.
How It Works
The indicator operates within a session starting at 12:00 PM (UK time). BSL/SSL levels update between 12:00 PM and 2:00 PM, with lines extending until 3:30 PM. After 3:30 PM, these lines freeze.
BSL/SSL lines show the highest price (BSL) and lowest price (SSL) reached during the 12:00 PM to 2:00 PM window. After 3:30 PM, they remain static, marking the final range boundaries.
The 2:30 PM candle emphasizes a key timestamp, often of interest to intraday traders.
Engulfing FVGs detect significant price gaps created by engulfing candles, which may indicate potential reversal or continuation zones.
Settings
12 PM Line Settings let you toggle visibility and set the line color.
BSL/SSL Line Settings allow you to toggle visibility, set BSL and SSL colors, choose a line style (Solid, Dashed, Dotted), and adjust width (1-4).
2:30 Candle Settings let you toggle visibility and set the candle color.
Engulfing FVG Settings allow you to toggle visibility and set the box color.
Interpretation
The 12 PM Line serves as a reference for the session start.
BSL/SSL Lines may act as potential support or resistance zones or highlight liquidity areas. After 3:30 PM, they remain static, showing the session’s final range.
The 2:30 PM Candle can be monitored for price action signals, such as reversals or breakouts.
Engulfing FVGs shaded areas may indicate imbalances in supply and demand, useful for identifying trade opportunities or stop-loss placement.
Notes
The timezone is set to Europe/London (UK time). Ensure your chart’s timezone aligns for accurate results.
This indicator is best used on intraday timeframes, such as 1-minute or 5-minute charts.
It provides visual aids for analysis and does not generate buy or sell signals on its own.

skX FVG Enhanced Indicator [1m,5m] skX FVG Indicator
Fair Value Gaps (FVGs) are particularly effective for scalping altcoins due to their tendency to fill price inefficiencies. These gaps occur during strong momentum moves where price leaves an 'empty' zone that often acts as a magnet for price to return to. In the volatile alt market, these gaps frequently present high-probability scalping opportunities.
Why FVGs Work in Alts:
• Quick price movements create more gaps
• Higher volatility increases gap frequency
• Institutional algorithms tend to fill these inefficiencies
• Works especially well in lower timeframes (1-5m)
Key Features:
✓ Automatic FVG detection with size filtering
✓ Smart timeframe adaptation (1m, 5m, Custom settings)
✓ Trend detection using 8/21/55 EMA system
✓ Dynamic TP/SL levels based on ATR
✓ Risk:Reward ratio automation
✓ Visual signals that stick to price levels
✓ Clear information display panel
✓ Built-in alerts system
How to Use:
1. Select your preferred timeframe (1m or 5m recommended)
2. Watch for triangle signals (▲ bullish, ▼ bearish)
3. Confirm with trend direction (shown in panel)
4. Use provided TP/SL levels for trade management
5. Set alerts for new FVG formations
Settings Explained:
• Auto Mode: Adjusts gap size to timeframe
• Custom Gap Size: Manual gap size control
• ATR Period: Volatility measurement window
• ATR Multiplier: Stop loss distance
• Risk:Reward: Take profit ratio
Best Practices:
• Use in conjunction with support/resistance
• Trade in direction of main trend
• Monitor higher timeframe structure
• Start with recommended settings
• Backtest before live trading
Note: This indicator works best in volatile market conditions and should be used as part of a complete trading strategy.
Good luck trading!
-skX

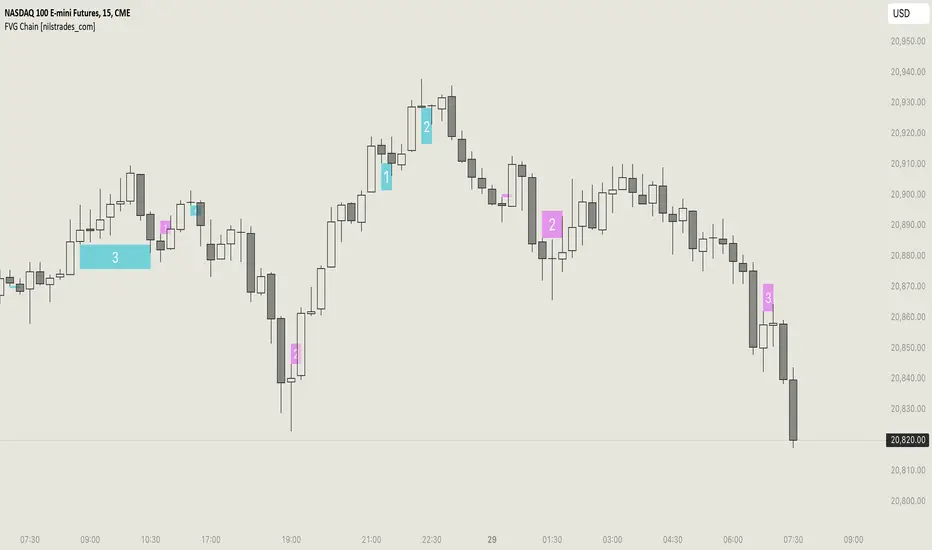
FVG Chain (Consecutive Fair Value Gaps / Imbalances)This indicator detects fair value gaps that are created out of the touch of older fair value gaps, hence creating an "FVG chain".
It counts +1 for the chain whenever a new price leg's FVG is touched.
You can use the current FVG Chain count, as well as the high, low, and price leg high/low of the current FVG as input source in external indicators. Check the data window to see the plot values.
How FVGs are detected:
Bullish: The low of the current confirmed bar is above the high of 2 bars back.
Bearish: The high of the current confirmed bar is below the low of 2 bars back.
A bullish FVG chain is broken if:
The current FVG's price leg low is broken.
The previous bar closed below the FVG, and the current confirmed bar closed below the previous bar.
A bearish FVG chain is broken if:
The current FVG's price leg high is broken.
The previous bar closed above the FVG, and the current confirmed bar closed above the previous bar.
Breakaway Fair Value Gaps [LuxAlgo]The Breakaway Fair Value Gap (FVG) is a typical FVG located at a point where the price is breaking new Highs or Lows.
🔶 USAGE
In the screenshot above, the price range is visualized by Donchian Channels.
In theory, the Breakaway FVGs should generally be a good indication of market participation, showing favor in the FVG's breaking direction. This is a combination of buyers or sellers pushing markets quickly while already at the highest high or lowest low in recent history.
While this described reasoning seems conventional, looking into it inversely seems to reveal a more effective use of these formations.
When the price is pushed to the extremities of the current range, the price is already potentially off balance and over-extended. Then an FVG is created, extending the price further out of balance.
With this in consideration, After identifying a Breakaway FVG, we could logically look for a reversion to re-balance the gap.
However, it would be illogical to believe that the FVG will immediately mitigate after formation. Because of this, the dashboard display for this indicator shows the analysis for the mitigation likelihood and timeliness.
In the example above, the information in the dashboard would read as follows (Bearish example):
Out of 949 Bearish Breakaway FVGs, 80.19% are shown to be mitigated within 60 bars, with the average mitigation time being 13 bars.
The other 19.81% are not mitigated within 60 bars. This could mean the FVG was mitigated after 60 bars, or it was never mitigated.
The unmitigated FVGs within the analysis window will extend their mitigation level to the current bar. We can see the number of bars since the formation is represented to the right of the live mitigation level.
Utilizing the current distance readout helps to better judge the likelihood of a level being mitigated.
Additionally, when considering these mitigation levels as targets, an additional indicator or analysis can be used to identify specific entries, which would further aid in a system's reliability.
🔶 SETTINGS
Trend Length: Sets the (DC) Trend length to use for Identifying Breakaway FVGs.
Show Mitigation Levels: Optionally hide mitigation levels if you would prefer only to see the Breakaway FVGs.
Maximum Duration: Sets the analysis duration for FVGs, Past this length in bars, the FVG is counted as "Un-Mitigated".
Show Dashboard: Optionally hide the dashboard.
Use Median Duration: Display the Median of the Bar Length data set rather than the Average.

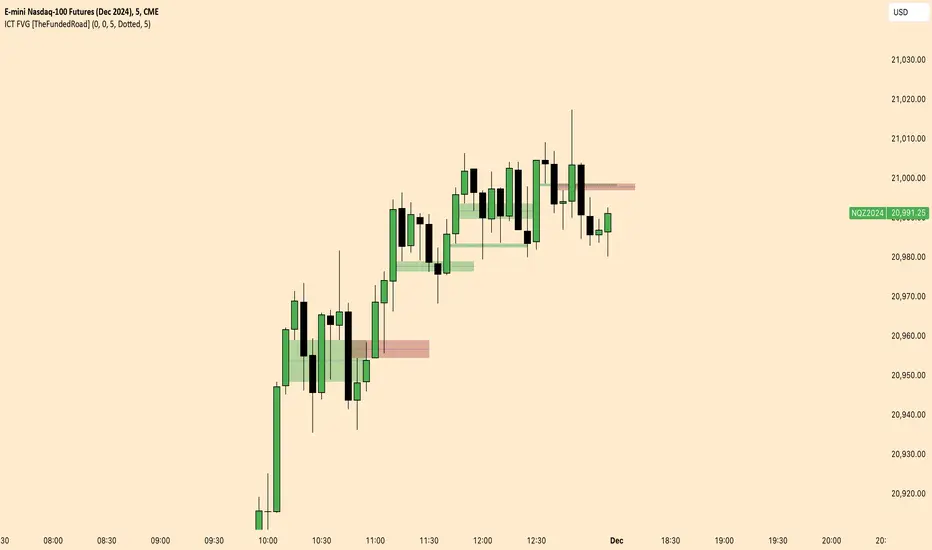
ICT FVG [TheFundedRoad]This indicator shows you all ICT Fair value gaps on chart with midpoint line
Fair value gap is a gap in a set of 3 candles, in a bullish FVG you have 1st candle high being lower than third candle low, and in a bearish FVG you have first candle low higher than third candle high, thats how this indicator finds these fair value gaps
It draws the fair value gap from the 2nd candle forward
You can customize the color and if you want to see the midpoint or not, midpoint is 50% of the gap
Silver Bullet ICT Strategy [TradingFinder] 10-11 AM NY Time +FVG🔵 Introduction
The ICT Silver Bullet trading strategy is a precise, time-based algorithmic approach that relies on Fair Value Gaps and Liquidity to identify high-probability trade setups. The strategy primarily focuses on the New York AM Session from 10:00 AM to 11:00 AM, leveraging heightened market activity within this critical window to capture short-term trading opportunities.
As an intraday strategy, it is most effective on lower timeframes, with ICT recommending a 15-minute chart or lower. While experienced traders often utilize 1-minute to 5-minute charts, beginners may find the 1-minute timeframe more manageable for applying this strategy.
This approach specifically targets quick trades, designed to take advantage of market movements within tight one-hour windows. By narrowing its focus, the Silver Bullet offers a streamlined and efficient method for traders to capitalize on liquidity shifts and price imbalances with precision.
In the fast-paced world of forex trading, the ability to identify market manipulation and false price movements is crucial for traders aiming to stay ahead of the curve. The Silver Bullet Indicator simplifies this process by integrating ICT principles such as liquidity traps, Order Blocks, and Fair Value Gaps (FVG).
These concepts form the foundation of a tool designed to mimic the strategies of institutional players, empowering traders to align their trades with the "smart money." By transforming complex market dynamics into actionable insights, the Silver Bullet Indicator provides a powerful framework for short-term trading success
Silver Bullet Bullish Setup :
Silver Bullet Bearish Setup :
🔵 How to Use
The Silver Bullet Indicator is a specialized tool that operates within the critical time windows of 9:00-10:00 and 10:00-11:00 in the forex market. Its design incorporates key principles from ICT (Inner Circle Trader) methodology, focusing on concepts such as liquidity traps, CISD Levels, Order Blocks, and Fair Value Gaps (FVG) to provide precise and actionable trade setups.
🟣 Bullish Setup
In a bullish setup, the indicator starts by marking the high and low of the session, serving as critical reference points for liquidity. A typical sequence involves a liquidity grab below the low, where the price manipulates retail traders into selling positions by breaching a key support level.
This movement is often orchestrated by smart money to accumulate buy orders. Following this liquidity grab, a market structure shift (MSS) occurs, signaled by the price breaking the CISD Level—a confirmation of bullish intent. The indicator then highlights an Order Block near the CISD Level, representing the zone where institutional buying is concentrated.
Additionally, it identifies a Fair Value Gap, which acts as a high-probability area for price retracement and trade entry. Traders can confidently take long positions when the price revisits these zones, targeting the next significant liquidity pool or resistance level.
Bullish Setup in CAPITALCOM:US100 :
🟣 Bearish Setup
Conversely, in a bearish setup, the price manipulates liquidity by creating a false breakout above the high of the session. This move entices retail traders into long positions, allowing institutional players to enter sell orders.
Once the price reverses direction and breaches the CISD Level to the downside, a change of character (CHOCH) becomes evident, confirming a bearish market structure. The indicator highlights an Order Block near this level, indicating the origin of the institutional sell orders, along with an associated FVG, which represents an imbalance zone likely to be revisited before the price continues downward.
By entering short positions when the price retraces to these levels, traders align their strategies with the anticipated continuation of bearish momentum, targeting nearby liquidity voids or support zones.
Bearish Setup in OANDA:XAUUSD :
🔵 Settings
Refine Order Block : Enables finer adjustments to Order Block levels for more accurate price responses.
Mitigation Level OB : Allows users to set specific reaction points within an Order Block, including: Proximal: Closest level to the current price. 50% OB: Midpoint of the Order Block. Distal: Farthest level from the current price.
FVG Filter : The Judas Swing indicator includes a filter for Fair Value Gap (FVG), allowing different filtering based on FVG width: FVG Filter Type: Can be set to "Very Aggressive," "Aggressive," "Defensive," or "Very Defensive." Higher defensiveness narrows the FVG width, focusing on narrower gaps.
Mitigation Level FVG : Like the Order Block, you can set price reaction levels for FVG with options such as Proximal, 50% OB, and Distal.
CISD : The Bar Back Check option enables traders to specify the number of past candles checked for identifying the CISD Level, enhancing CISD Level accuracy on the chart.
🔵 Conclusion
The Silver Bullet Indicator is a cutting-edge tool designed specifically for forex traders who aim to leverage market dynamics during critical liquidity windows. By focusing on the highly active 9:00-10:00 and 10:00-11:00 timeframes, the indicator simplifies complex market concepts such as liquidity traps, Order Blocks, Fair Value Gaps (FVG), and CISD Levels, transforming them into actionable insights.
What sets the Silver Bullet Indicator apart is its precision in detecting false breakouts and market structure shifts (MSS), enabling traders to align their strategies with institutional activity. The visual clarity of its signals, including color-coded zones and directional arrows, ensures that both novice and experienced traders can easily interpret and apply its findings in real-time.
By integrating ICT principles, the indicator empowers traders to identify high-probability entry and exit points, minimize risk, and optimize trade execution. Whether you are capturing short-term price movements or navigating complex market conditions, the Silver Bullet Indicator offers a robust framework to enhance your trading performance.
Ultimately, this tool is more than just an indicator; it is a strategic ally for traders who seek to decode the movements of smart money and capitalize on institutional strategies. With the Silver Bullet Indicator, traders can approach the market with greater confidence, precision, and profitability.

ICT Setup 03 [TradingFinder] Judas Swing NY 9:30am + CHoCH/FVG🔵 Introduction
Judas Swing is an advanced trading setup designed to identify false price movements early in the trading day. This advanced trading strategy operates on the principle that major market players, or "smart money," drive price in a certain direction during the early hours to mislead smaller traders.
This deceptive movement attracts liquidity at specific levels, allowing larger players to execute primary trades in the opposite direction, ultimately causing the price to return to its true path.
The Judas Swing setup functions within two primary time frames, tailored separately for Forex and Stock markets. In the Forex market, the setup uses the 8:15 to 8:30 AM window to identify the high and low points, followed by the 8:30 to 8:45 AM frame to execute the Judas move and identify the CISD Level break, where Order Block and Fair Value Gap (FVG) zones are subsequently detected.
In the Stock market, these time frames shift to 9:15 to 9:30 AM for identifying highs and lows and 9:30 to 9:45 AM for executing the Judas move and CISD Level break.
Concepts such as Order Block and Fair Value Gap (FVG) are crucial in this setup. An Order Block represents a chart region with a high volume of buy or sell orders placed by major financial institutions, marking significant levels where price reacts.
Fair Value Gap (FVG) refers to areas where price has moved rapidly without balance between supply and demand, highlighting zones of potential price action and future liquidity.
Bullish Setup :
Bearish Setup :
🔵 How to Use
The Judas Swing setup enables traders to pinpoint entry and exit points by utilizing Order Block and FVG concepts, helping them align with liquidity-driven moves orchestrated by smart money. This setup applies two distinct time frames for Forex and Stocks to capture early deceptive movements, offering traders optimized entry or exit moments.
🟣 Bullish Setup
In the Bullish Judas Swing setup, the first step is to identify High and Low points within the initial time frame. These levels serve as key points where price may react, forming the basis for analyzing the setup and assisting traders in anticipating future market shifts.
In the second time frame, a critical stage of the bullish setup begins. During this phase, the price may create a false break or Fake Break below the low level, a deceptive move by major players to absorb liquidity. This false move often causes smaller traders to enter positions incorrectly. After this fake-out, the price reverses upward, breaking the CISD Level, a critical point in the market structure, signaling a potential bullish trend.
Upon breaking the CISD Level and reversing upward, the indicator identifies both the Order Block and Fair Value Gap (FVG). The Order Block is an area where major players typically place large buy orders, signaling potential price support. Meanwhile, the FVG marks a region of supply-demand imbalance, signaling areas where price might react.
Ultimately, after these key zones are identified, a trader may open a buy position if the price reaches one of these critical areas—Order Block or FVG—and reacts positively. Trading at these levels enhances the chance of success due to liquidity absorption and support from smart money, marking an opportune time for entering a long position.
🟣 Bearish Setup
In the Bearish Judas Swing setup, analysis begins with marking the High and Low levels in the initial time frame. These levels serve as key zones where price could react, helping to signal possible trend reversals. Identifying these levels is essential for locating significant bearish zones and positioning traders to capitalize on downward movements.
In the second time frame, the primary bearish setup unfolds. During this stage, price may exhibit a Fake Break above the high, causing a brief move upward and misleading smaller traders into incorrect positions. After this false move, the price typically returns downward, breaking the CISD Level—a crucial bearish trend indicator.
With the CISD Level broken and a bearish trend confirmed, the indicator identifies the Order Block and Fair Value Gap (FVG). The Bearish Order Block is a region where smart money places significant sell orders, prompting a negative price reaction. The FVG denotes an area of supply-demand imbalance, signifying potential selling pressure.
When the price reaches one of these critical areas—the Bearish Order Block or FVG—and reacts downward, a trader may initiate a sell position. Entering trades at these levels, due to increased selling pressure and liquidity absorption, offers traders an advantage in profiting from price declines.
🔵 Settings
Market : The indicator allows users to choose between Forex and Stocks, automatically adjusting the time frames for the "Opening Range" and "Trading Permit" accordingly: Forex: 8:15–8:30 AM for identifying High and Low points, and 8:30–8:45 AM for capturing the Judas move and CISD Level break. Stocks: 9:15–9:30 AM for identifying High and Low points, and 9:30–9:45 AM for executing the Judas move and CISD Level break.
Refine Order Block : Enables finer adjustments to Order Block levels for more accurate price responses.
Mitigation Level OB : Allows users to set specific reaction points within an Order Block, including: Proximal: Closest level to the current price. 50% OB: Midpoint of the Order Block. Distal: Farthest level from the current price.
FVG Filter : The Judas Swing indicator includes a filter for Fair Value Gap (FVG), allowing different filtering based on FVG width: FVG Filter Type: Can be set to "Very Aggressive," "Aggressive," "Defensive," or "Very Defensive." Higher defensiveness narrows the FVG width, focusing on narrower gaps.
Mitigation Level FVG : Like the Order Block, you can set price reaction levels for FVG with options such as Proximal, 50% OB, and Distal.
CISD : The Bar Back Check option enables traders to specify the number of past candles checked for identifying the CISD Level, enhancing CISD Level accuracy on the chart.
🔵 Conclusion
The Judas Swing indicator helps traders spot reliable trading opportunities by detecting false price movements and key levels such as Order Block and FVG. With a focus on early market movements, this tool allows traders to align with major market participants, selecting entry and exit points with greater precision, thereby reducing trading risks.
Its extensive customization options enable adjustments for various market types and trading conditions, giving traders the flexibility to optimize their strategies. Based on ICT techniques and liquidity analysis, this indicator can be highly effective for those seeking precision in their entry points.
Overall, Judas Swing empowers traders to capitalize on significant market movements by leveraging price volatility. Offering precise and dependable signals, this tool presents an excellent opportunity for enhancing trading accuracy and improving performance

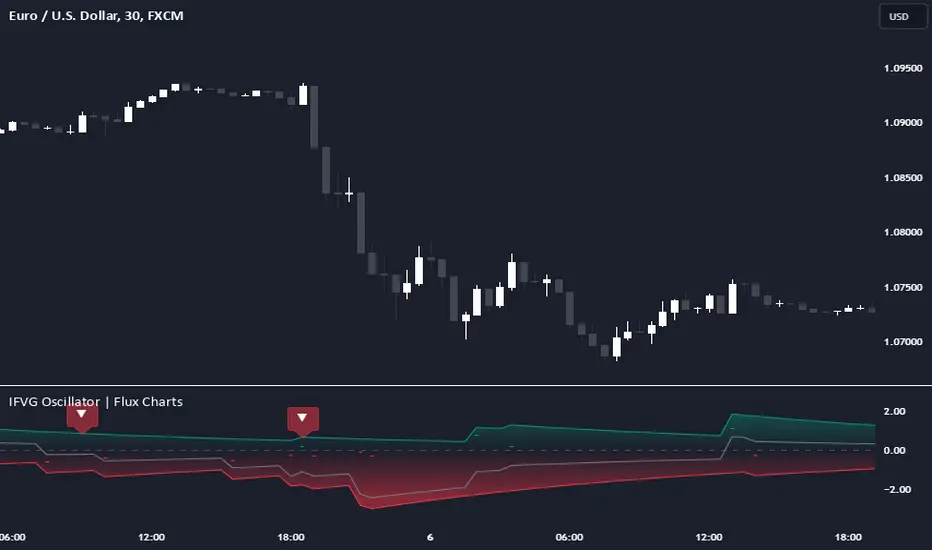
Inversion Fair Value Gap Oscillator | Flux Charts💎 GENERAL OVERVIEW
Introducing the new Inversion Fair Value Gap Oscillator (IFVG Oscillator) indicator! This unique indicator identifies and tracks Inversion Fair Value Gaps (IFVGs) in price action, presenting them in an oscillator format to reveal market momentum based on IFVG strength. It highlights bullish and bearish IFVGs while enabling traders to adjust detection sensitivity and apply volume and ATR-based filters for more precise setups. For more information about the process, check the "📌 HOW DOES IT WORK" section.
Features of the new IFVG Oscillator:
Fully Customizable FVG & IFVG Detection
An Oscillator Approach To IFVGs
Divergence Markers For Potential Reversals
Alerts For Divergence Labels
Customizable Styling
📌 HOW DOES IT WORK?
Fair Value Gaps are price gaps within bars that indicate inefficiencies, often filled as the market retraces. An Inversion Fair Value Gap is created in the opposite direction once a FVG gets invalidated. The IFVG Oscillator scans historical bars to identify these gaps, then filters them based on ATR or volume. Each IFVG is marked as bullish or bearish according to the opposite direction of the original FVG that got invalidated.
An oscillator is calculated using recent IFVGs with this formula :
1. The Oscillator starts as 0.
2. When a new IFVG Appears, it contributes (IFVG Width / ATR) to the oscillator of the corresponding type.
3. Each confirmed bar, the oscillator is recalculated as OSC = OSC * (1 - Decay Coefficient)
The oscillator aggregates and decays past IFVGs, allowing recent IFVG activity to dominate the signal. This approach emphasizes current market momentum, with oscillations moving bullish or bearish based on IFVG intensity. Divergences are marked where IFVG oscillations suggest potential reversals. Bullish Divergence conditions are as follows :
1. The current candlestick low must be the lowest of last 25 bars.
2. Net Oscillator (Shown in gray line by default) must be > 0.
3. The current Bullish IFVG Oscillator value should be no more than 0.1 below the highest value from the last 25 bars.
Traders can use divergence signals to get an idea of potential reversals, and use the Net IFVG Oscillator as a trend following marker.
🚩 UNIQUENESS
The Inversion Fair Value Gap Oscillator stands out by converting IFVG activity into an oscillator format, providing a momentum-based visualization of IFVGs that reveals market sentiment dynamically. Unlike traditional indicators that statically mark IFVG zones, the oscillator decays older IFVGs over time, showing only the most recent, relevant activity. This approach allows for real-time insight into market conditions and potential reversals based on oscillating IFVG strength, making it both intuitive and powerful for momentum trading.
Another unique feature is the combination of customizable ATR and volume filters, letting traders adapt the indicator to match their strategy and market type. You can also set-up alerts for bullish & bearish divergences.
⚙️ SETTINGS
1. General Configuration
Decay Coefficient -> The decay coefficient for oscillators. Increasing this setting will result in oscillators giving the weight to recent IFVGs, while decreasing it will distribute the weight equally to the past and recent IFVGs.
2. Fair Value Gaps
Zone Invalidation -> Select between Wick & Close price for FVG Zone Invalidation.
Zone Filtering -> With "Average Range" selected, algorithm will find FVG zones in comparison with average range of last bars in the chart. With the "Volume Threshold" option, you may select a Volume Threshold % to spot FVGs with a larger total volume than average.
FVG Detection -> With the "Same Type" option, all 3 bars that formed the FVG should be the same type. (Bullish / Bearish). If the "All" option is selected, bar types may vary between Bullish / Bearish.
Detection Sensitivity -> You may select between Low, Normal or High FVG detection sensitivity. This will essentially determine the size of the spotted FVGs, with lower sensitivies resulting in spotting bigger FVGs, and higher sensitivies resulting in spotting all sizes of FVGs.
3. Inversion Fair Value Gaps
Zone Invalidation -> Select between Wick & Close price for IFVG Zone Invalidation.
4. Style
Divergence Labels On -> You can switch divergence labels to show up on the chart or the oscillator plot.
Implied Fair Value Gap (IFVG) ICT [TradingFinder] Hidden FVG OTE🔵 Introduction
The Implied Fair Value Gap (IFVG) is distinctive due to its unique three-candlestick formation, which differentiates it from conventional Fair Value Gaps.
Implied fair value represents an estimated worth of an asset—often a business or its goodwill—based on the price likely to be received in a structured transaction between market participants at a specific point in time.
In the ever-evolving world of technical analysis, pinpointing price reversal points and market anomalies can significantly enhance trading strategies and decision-making for traders and investors. Among the advanced concepts gaining traction in this field is the Implied Fair Value Gap (IFVG), introduced by the renowned analyst Inner Circle Trader (ICT).
This tool has proven to be an effective method for identifying hidden supply and demand zones in financial markets, offering a unique edge to traders looking for high-probability setups.
Unlike traditional gaps that are visible on price charts, IFVG is a hidden gap that doesn’t appear explicitly on the chart and thus requires specialized technical analysis tools for accurate identification.
This hidden gap can signal potential price reversals and offers traders insight into high-liquidity areas where price is likely to react. This article will guide you through using the ICT Implied Fair Value Gap Indicator effectively, covering its settings, usage strategies, and key features to help you make informed decisions in the market.
🟣 Bullish Implied FVG
🟣 Bearish Implied FVG
🔵 How to Use
The IFVG indicator is designed to assist traders in recognizing hidden support and resistance zones by identifying Bullish and Bearish IFVG patterns. With this tool, traders can make better-informed decisions about suitable entry and exit points for their trades based on these patterns.
🟣 Bullish Implied Fair Value Gap
This pattern occurs in an uptrend when a large bullish candlestick forms, with the wicks of the previous and following candles overlapping the body of the central candlestick.
This overlap creates a demand zone or a hidden support level, which can act as an ideal entry point for buy trades. Often, when the price returns to this area, it is likely to resume its upward trend, presenting a profitable buying opportunity.
🟣 Bearish Implied Fair Value Gap
This pattern is similar but forms in downtrends. Here, a large bearish candlestick appears on the chart, with the wicks of adjacent candles overlapping its body. This overlap defines a supply zone or a hidden resistance level and serves as a signal for potential sell trades.
When the price returns to this zone, it often continues its downward trend, providing an optimal point for entering sell trades.
The IFVG indicator also includes various filters that traders can use to refine their analysis based on market conditions. These filters, including Very Aggressive, Aggressive, Defensive, and Very Defensive, allow users to customize the IFVG zones' width, offering flexibility according to the trader’s risk tolerance and trading style.
🟣 Example Trading Scenarios
Suppose you’re in a strong uptrend and the IFVG indicator identifies a Bullish IFVG zone. In this scenario, you could consider entering a buy trade when the price retraces to this zone, expecting the uptrend to resume. Conversely, in a downtrend, a Bearish IFVG zone can signal a favorable entry point for short trades when the price revisits this area.
🔵 Settings
Implied Block Validity Period: This parameter specifies the validity period of each identified block, taking into account the number of bars that have passed since its formation. Proper adjustment of this period helps traders focus only on relevant zones, increasing the accuracy of the analysis.
Mitigation Level OB : This option defines the mitigation level for supply and demand blocks (Order Blocks), with settings including Proximal, 50% OB, and Distal.
Depending on the selected level, the indicator will focus on closer, mid-range, or farther points for block identification, allowing traders to adjust for the level of precision required.
Implied Filter : Activating this filter allows traders to apply conditions based on the width of the IFVG zones. With options like Very Aggressive and Very Defensive, traders can control the width of IFVG zones to suit their risk management strategy—whether they prefer high-risk setups or low-risk setups.
Display and Color Settings : This section enables users to customize the appearance of the IFVG zones on their charts. Traders can set different colors for Bullish and Bearish zones, allowing for easier distinction and improved visualization.
Alert Settings : One of the standout features of the IFVG indicator is the alert system. By setting up alerts, users can be notified whenever the price approaches a demand or supply zone.
Alerts can be customized to trigger Once Per Bar (one alert per bar) or Per Bar Close (alert at the close of each bar), ensuring that traders stay updated on critical price movements without needing to monitor the chart continuously.
🔵 Conclusion
The ICT Implied Fair Value Gap (IFVG) indicator is a powerful and sophisticated tool in technical analysis, allowing professional traders to identify hidden supply and demand zones and use them as entry and exit points for buy and sell trades.
This indicator’s automatic detection of IFVG zones helps traders uncover hidden trading opportunities that can enhance their analysis.
While the IFVG indicator offers numerous advantages, it is important to use it in conjunction with other technical analysis tools and sound risk management practices.
IFVG alone does not guarantee profitability in trading; it works best when combined with other indicators such as volume analysis and trend-following indicators for a comprehensive trading strategy.

Fair Value Gaps Advanced [smart-money-indicators]This indicator is a tool to support the "SMC" strategy.
This indicator does not provide entry or exit signals.
This indicator is a tool to mark key price areas.
This indicator is a tool to mark key time areas.
This indicator is particularly distinguished by its high customizability of tools,
setting it apart from the indicators currently available on the TradingView platform.
This Fair Value Gaps or Imbalance Indicator marks liquidity areas using boxes.
Fair Value Gaps are created in high-momentum conditions, leaving an area that, in theory and as supported by backtesting, tends to be revisited.
The following settings can be configured:
Show only one-sided Gaps
- Only Fair Value Gaps formed by three consecutive bullish or bearish candles are displayed.
Extend Fair Value Gap
-The box is extended to the current candle.
Draw Mid Line
- A 50% line of the Fair Value Gap is drawn.
Extend Mid Line
-The midline is extended to the current candle.
Remove filled Fair Value Gap
-Filled Fair Value Gaps are removed.
Enable inverse Fair Value Gap
- When a bullish Fair Value Gap is broken, it creates a bearish resistance area.
- When a bearish Fair Value Gap is broken, it creates a bullish support area.
-Display Last X active Buyside Fair Value Gaps
-Display Last X active Sellside Fair Value Gaps
-Display Last X active Buyside Inverse Fair Value Gaps
-Display Last X active Sellside Inverse Fair Value Gaps

Fair Value Gap Oscillator | Flux Charts💎 GENERAL OVERVIEW
Introducing the new Fair Value Gap Oscillator (FVG Oscillator) indicator! This unique indicator identifies and tracks Fair Value Gaps (FVGs) in price action, presenting them in an oscillator format to reveal market momentum based on FVG strength. It highlights bullish and bearish FVGs while enabling traders to adjust detection sensitivity and apply volume and ATR-based filters for more precise setups. For more information about the process, check the "📌 HOW DOES IT WORK" section.
Features of the new FVG Oscillator:
Fully Customizable FVG Detection
An Oscillator Approach To FVGs
Divergence Markers For Potential Reversals
Alerts For Divergence Labels
Customizable Styling
📌 HOW DOES IT WORK?
Fair Value Gaps are price gaps within bars that indicate inefficiencies, often filled as the market retraces. The FVG Oscillator scans historical bars to identify these gaps, then filters them based on ATR or volume. Each FVG is marked as bullish or bearish according to the trend direction that preceded its formation.
An oscillator is calculated using recent FVGs with this formula :
1. The Oscillator starts as 0.
2. When a new FVG Appears, it contributes (FVG Width / ATR) to the oscillator of the corresponding type.
3. Each confirmed bar, the oscillator is recalculated as OSC = OSC * (1 - Decay Coefficient)
The oscillator aggregates and decays past FVGs, allowing recent FVG activity to dominate the signal. This approach emphasizes current market momentum, with oscillations moving bullish or bearish based on FVG intensity. Divergences are marked where FVG oscillations suggest potential reversals. Bullish Divergence conditions are as follows :
1. The current candlestick low must be the lowest of last 25 bars.
2. Net Oscillator (Shown in gray line by default) must be > 0.
3. The current Bullish FVG Oscillator value should be no more than 0.1 below the highest value from the last 25 bars.
Traders can use divergence signals to get an idea of potential reversals, and use the Net FVG Oscillator as a trend following marker.
🚩 UNIQUENESS
The Fair Value Gap Oscillator stands out by converting FVG activity into an oscillator format, providing a momentum-based visualization of FVGs that reveals market sentiment dynamically. Unlike traditional indicators that statically mark FVG zones, the oscillator decays older FVGs over time, showing only the most recent, relevant activity. This approach allows for real-time insight into market conditions and potential reversals based on oscillating FVG strength, making it both intuitive and powerful for momentum trading.
Another unique feature is the combination of customizable ATR and volume filters, letting traders adapt the indicator to match their strategy and market type. You can also set-up alerts for bullish & bearish divergences.
⚙️ SETTINGS
1. General Configuration
Decay Coefficient -> The decay coefficient for oscillators. Increasing this setting will result in oscillators giving the weight to recent FVGs, while decreasing it will distribute the weight equally to the past and recent FVGs.
2. Fair Value Gaps
Zone Invalidation -> Select between Wick & Close price for FVG Zone Invalidation.
Zone Filtering -> With "Average Range" selected, algorithm will find FVG zones in comparison with average range of last bars in the chart. With the "Volume Threshold" option, you may select a Volume Threshold % to spot FVGs with a larger total volume than average.
FVG Detection -> With the "Same Type" option, all 3 bars that formed the FVG should be the same type. (Bullish / Bearish). If the "All" option is selected, bar types may vary between Bullish / Bearish.
Detection Sensitivity -> You may select between Low, Normal or High FVG detection sensitivity. This will essentially determine the size of the spotted FVGs, with lower sensitivies resulting in spotting bigger FVGs, and higher sensitivies resulting in spotting all sizes of FVGs.
3. Style
Divergence Labels On -> You can switch divergence labels to show up on the chart or the oscillator plot.

Cumulative Volume Delta Strategy | Flux Charts💎 GENERAL OVERVIEW
Introducing the Cumulative Volume Delta Strategy (CVDS) Indicator, an advanced tool designed to enhance trading strategies by identifying potential trend reversals through volume dynamics. This script features integrated order block detection, Fair Value Gaps (FVGs), and a dynamic take-profit (TP) and stop-loss (SL) system. For an in-depth understanding of the strategy, refer to the "HOW DOES IT WORK?" section below.
Features of the new Cumulative Volume Delta Strategy (CVDS) Indicator :
Cumulative Volume Delta-based Strategy
Order Block and Fair Value Gap (FVG) Entry Methods
Dynamic TP/SL System
Customizable Risk Management Settings
Alerts for Buy, Sell, TP, and SL Signals
📌 HOW DOES IT WORK ?
The CVDS indicator operates by tracking the net volume difference between buyers and sellers to identify divergences that could indicate potential trend reversals. A cumulative volume delta (CVD) calculation is employed to measure the intensity of these divergences in relation to price movements. The net volume sum is reset every trading day (can be changed from the settings using the anchor period option), and divergences are detected when the cumulative volume crosses the 0-line over or under.
Once a significant divergence is detected, the indicator identifies breakout points, confirmed by either Fair Value Gaps (FVGs) or Order Blocks (OBs). Depending on your chosen entry mode, the indicator will trigger a buy or sell entry when the confirmation signal aligns with the breakout direction. Alerts for Buy, Sell, Take-Profit, and Stop-Loss are available.
Note that the indicator cannot run on 1-minute and 1-second charts, as it needs to get data from a lower timeframe. 1-minutes & 1-second timeframes are the minimum timeframes in their ranges respectively.
🚩 UNIQUENESS
What sets this indicator apart is the combination of volume divergence analysis with advanced price action tools like Fair Value Gaps (FVGs) and Order Blocks (OBs). The ability to choose between these methods, along with a dynamic TP/SL system that adapts based on volatility, provides flexibility for traders in any market condition. The backtesting dashboard provides metrics about the performance of the indicator. You can use it to tune the settings for best use in the current ticker. The CVD-based strategy ensures that trades are initiated only when meaningful divergences between volume and price occur, filtering out noise and increasing the likelihood of profitable trades.
⚙️ SETTINGS
1. General Configuration
Anchor Period: Time anchor period used in CVD calculation. This is essentially the period that the volume delta sum will be reset. Lower timeframes may result in more entries at the cost of less reliable results.
Entry Mode: Choose between FVGs or OBs to trigger your entries based on the confirmation signals.
Retracement Requirement: Enable to confirm the entry after a retracement toward the FVG or OB.
2. Fair Value Gaps
FVG Sensitivity: Modify the sensitivity of FVG detection, allowing for more or fewer gaps to be considered valid.
3. Order Blocks (OB)
Swing Length: Define the swing length to identify OB formations. Shorter lengths find smaller OBs, while longer lengths detect larger structures.
4. TP / SL
TP / SL Method:
a) Dynamic: The TP / SL zones will be auto-determined by the algorithm based on the Average True Range (ATR) of the current ticker.
b) Fixed : You can adjust the exact TP / SL ratios from the settings below.
Dynamic Risk: The risk you're willing to take if "Dynamic" TP / SL Method is selected. Higher risk usually means a better winrate at the cost of losing more if the strategy fails. This setting is has a crucial effect on the performance of the indicator, as different tickers may have different volatility so the indicator may have increased performance when this setting is correctly adjusted.

Candle Range Theory | Flux Charts💎 GENERAL OVERVIEW
Introducing our new Candle Range Theory Indicator! This powerful tool offers a strategy built around the Candle Range Theory, which analyzes market movements through the relative size and structure of price candles. For more information about the process, check the "HOW DOES IT WORK" section.
Features of the new Candle Range Theory Indicator :
Implementation of the Candle Range Theory
FVG & Order Block Entry Methods
2 Different TP / SL Methods
Customizable Execution Settings
Customizable Backtesting Dashboard
Alerts for Buy, Sell, TP & SL Signals
📌 HOW DOES IT WORK ?
The Candle Range Theory (CRT) indicator operates by identifying significant price movements through the relative size and structure of candlesticks. A key part of the strategy is determining large candles based on their range compared to the Average True Range (ATR) in a higher timeframe. Once identified, a breakout of either the high wick or the low wick of the large candle is required. This breakout is considered a liquidity grab. After that, the indicator waits for confirmation through Fair Value Gaps (FVGs) or Order Blocks (OBs). The confirmation structure must be the opposite direction of the breakout, for example if the high wick is broken, a bearish FVG is required for the short entry. After a confirmation signal is received, the indicator will trigger entry points based on your chosen entry method (FVG or OB), and exit points will be calculated using either a dynamic ATR-based TP/SL method or fixed percentages. Alerts for Buy, Sell, Take-Proft, and Stop-Loss are available.
🚩 UNIQUENESS
This indicator stands out because it combines two highly effective entry methods: Fair Value Gaps (FVGs) and Order Blocks (OBs). You can choose between these strategies depending on market conditions. Additionally, the dynamic TP/SL system uses the ticker's volatility to automatically calculate stop-loss and take-profit targets. The backtesting dashboard provides metrics about the performance of the indicator. You can use it to tune the settings for best use in the current tiker. The Candle Range Theory approach offers more flexibility compared to traditional indicators, allowing for better customization and control based on your risk tolerance.
⚙️ SETTINGS
1. General Configuration
Higher Timeframe: Customize the higher timeframe for analysis. Recommended combinations include M15 -> H4, H4 -> Daily, Daily -> Weekly, and Weekly -> Monthly.
HTF Candle Size: Define the size of the higher timeframe candles as Big, Normal, or Small to filter valid setups based on their range relative to ATR.
Entry Mode: Choose between FVGs and Order Blocks for your entry triggers.
Require Retracement: Enable this option if you want a retracement to the FVG or OB for entry confirmation.
Show HTF Candle Lines: Toggle to display the higher timeframe candle lines for better visual clarity.
2. Fair Value Gaps
FVG Sensitivity: You may select between Low, Normal, High or Extreme FVG detection sensitivity. This will essentially determine the size of the spotted FVGs, with lower sensitivities resulting in spotting bigger FVGs, and higher sensitivities resulting in spotting all sizes of FVGs.
3. Order Blocks
Swing Length: Swing length is used when finding order block formations. Smaller values will result in finding smaller order blocks.
4. TP / SL
TP / SL Method:
a) Dynamic: The TP / SL zones will be auto-determined by the algorithm based on the Average True Range (ATR) of the current ticker.
b) Fixed : You can adjust the exact TP / SL ratios from the settings below.
Dynamic Risk: The risk you're willing to take if "Dynamic" TP / SL Method is selected. Higher risk usually means a better winrate at the cost of losing more if the strategy fails. This setting is has a crucial effect on the performance of the indicator, as different tickers may have different volatility so the indicator may have increased performance when this setting is correctly adjusted.

ICT Judas Swing | Flux Charts💎 GENERAL OVERVIEW
Introducing our new ICT Judas Swing Indicator! This indicator is built around the ICT's "Judas Swing" strategy. The strategy looks for a liquidity grab around NY 9:30 session and a Fair Value Gap for entry confirmation. For more information about the process, check the "HOW DOES IT WORK" section.
Features of the new ICT Judas Swing :
Implementation of ICT's Judas Swing Strategy
2 Different TP / SL Methods
Customizable Execution Settings
Customizable Backtesting Dashboard
Alerts for Buy, Sell, TP & SL Signals
📌 HOW DOES IT WORK ?
The strategy begins by identifying the New York session from 9:30 to 9:45 and marking recent liquidity zones. These liquidity zones are determined by locating high and low pivot points: buyside liquidity zones are identified using high pivots that haven't been invalidated, while sellside liquidity zones are found using low pivots. A break of either buyside or sellside liquidity must occur during the 9:30-9:45 session, which is interpreted as a liquidity grab by smart money. The strategy assumes that after this liquidity grab, the price will reverse and move in the opposite direction. For entry confirmation, a fair value gap (FVG) in the opposite direction of the liquidity grab is required. A buyside liquidity grab calls for a bearish FVG, while a sellside grab requires a bullish FVG. Based on the type of FVG—bullish for buys and bearish for sells—the indicator will then generate a Buy or Sell signal.
After the Buy or Sell signal, the indicator immediately draws the take-profit (TP) and stop-loss (SL) targets. The indicator has three different TP & SL modes, explained in the "Settings" section of this write-up.
You can set up alerts for entry and TP & SL signals, and also check the current performance of the indicator and adjust the settings accordingly to the current ticker using the backtesting dashboard.
🚩 UNIQUENESS
This indicator is an all-in-one suit for the ICT's Judas Swing concept. It's capable of plotting the strategy, giving signals, a backtesting dashboard and alerts feature. Different and customizable algorithm modes will help the trader fine-tune the indicator for the asset they are currently trading. Three different TP / SL modes are available to suit your needs. The backtesting dashboard allows you to see how your settings perform in the current ticker. You can also set up alerts to get informed when the strategy is executable for different tickers.
⚙️ SETTINGS
1. General Configuration
Swing Length -> The swing length for pivot detection. Higher settings will result in
FVG Detection Sensitivity -> You may select between Low, Normal, High or Extreme FVG detection sensitivity. This will essentially determine the size of the spotted FVGs, with lower sensitivies resulting in spotting bigger FVGs, and higher sensitivies resulting in spotting all sizes of FVGs.
2. TP / SL
TP / SL Method ->
a) Dynamic: The TP / SL zones will be auto-determined by the algorithm based on the Average True Range (ATR) of the current ticker.
b) Fixed : You can adjust the exact TP / SL ratios from the settings below.
Dynamic Risk -> The risk you're willing to take if "Dynamic" TP / SL Method is selected. Higher risk usually means a better winrate at the cost of losing more if the strategy fails. This setting is has a crucial effect on the performance of the indicator, as different tickers may have different volatility so the indicator may have increased performance when this setting is correctly adjusted.

HTF Inversion Fair Value Gap | Flux Charts💎 GENERAL OVERVIEW
Introducing our new Higher Timeframe Inversion Fair Value Gaps (IFVG) indicator! Inversion Fair Value Gaps occur when a Fair Value Gap becomes invalidated. They reverse the role of the original Fair Value Gap, making a bullish zone bearish and vice versa. This indicator finds the latest IFVG in a higher timeframe and renders it in the current chart with it's divergence. For more information about the process, read the "HOW DOES IT WORK" section of the description.
Features of the new Higher Timeframe IFVG Indicator :
Renders The Higher Timeframe IFVG
Invalidation Borders
Variety Of Zone Detection / Sensitivity / Filtering / Invalidation Settings
High Customizability
🚩 UNIQUENESS
This indicator lets you take a look at the bigger picture by rendering the latest IFVG in a higher timeframe. You can see the current IFVG divergence to see how is the price action acting around the IFVG. You also can customize the FVG Filtering method, FVG & IFVG Zone Invalidation, Detection Sensitivity etc. according to your needs to get the best performance from the indicator.
📌 HOW DOES IT WORK ?
A Fair Value Gap generally occur when there is an imbalance in the market. They can be detected by specific formations within the chart. An Inversion Fair Value Gap is when a FVG becomes invalidated, thus reversing the direction of the FVG.
This indicator then renders the IFVG in a higher timeframe in your chart like this :
The opaque dashed lines at the top and the bottom of the IFVG indicate the bars that formed the original FVG. The middle dashed line that is semi-transparent shows the candlestick that invalidated the original FVG, thus created the current IFVG. The vertical solid top & bottom wicks indicate the current divergence of the highest & lowest points to the current IFVG.
The IFVGs can act as strong support & resistance points, depending on their creation volume and invalidation volume. Traders can use them for confirmation signals to their positions.
⚙️ SETTINGS
1. General Configuration
Higher Timeframe -> The higher timeframe to detect latest IFVG from. Keep in mind that his setting must be higher than the current timeframe.
IFVG Zone Invalidation -> Select between Wick & Close price for IFVG Zone Invalidation.
2. Fair Value Gaps
FVG Zone Invalidation -> Select between Wick & Close price for FVG Zone Invalidation.
Zone Filtering -> With "Average Range" selected, algorithm will find FVG zones in comparison with average range of last bars in the chart. With the "Volume Threshold" option, you may select a Volume Threshold % to spot FVGs with a larger total volume than average.
FVG Detection -> With the "Same Type" option, all 3 bars that formed the FVG should be the same type. (Bullish / Bearish). If the "All" option is selected, bar types may vary between Bullish / Bearish.
Detection Sensitivity -> You may select between Low, Normal or High FVG detection sensitivity. This will essentially determine the size of the spotted FVGs, with lower sensitivities resulting in spotting bigger FVGs, and higher sensitivities resulting in spotting all sizes of FVGs.
3. Dasboard
You can enable / disable the mitigation dashboard and customize it here.
4. Customization
Offset -> The number of candlesticks the IFVG will be rendered to the right of the latest bar.
Width -> The width of the rendered IFVG in candlesticks.

Gaps Trend [ChartPrime]The Gaps Trend - ChartPrime indicator is designed to detect Fair Value Gaps (FVGs) in the market and apply a trailing stop mechanism based on those gaps. It identifies both bullish and bearish gaps and provides traders with a way to manage trades dynamically as gaps appear. The indicator visually highlights gaps and uses the detected momentum to assess trend direction, helping traders identify price imbalances caused by strong buy or sell pressure.
⯁ KEY FEATURES & HOW TO USE
⯌ Fair Value Gap (FVG) Detection :
The indicator automatically detects both bullish and bearish FVGs, identifying gaps between candle highs and lows. Bullish gaps are shown in green, and bearish gaps in purple. These gaps indicate price imbalances driven by strong momentum, such as when there is significant buying or selling pressure.
Use : Traders can use FVG detection to identify periods of high price momentum, offering insight into potential continuation or exhaustion of trends.
⯌ Trailing Stop Feature Based on FVGs :
A core feature of this indicator is the trailing stop mechanism, which adjusts dynamically based on the identified FVGs. When a bullish gap is detected, the trailing stop is placed below the price to capture upward momentum, while bearish gaps result in a trailing stop placed above the price. This feature helps traders stay in trends while protecting profits as the price moves.
Use : The trailing stop follows the momentum of the price, ensuring that traders can stay in profitable trades during strong trends and exit when the momentum shifts.
bullish set up
bearish set up
⯌ Trend Direction Indication :
The indicator colors the chart according to the current trend direction based on the position of the price relative to the trailing stop. Green indicates an uptrend (bullish gap), while purple shows a downtrend (bearish gap). This provides traders with a quick visual assessment of trend direction based on the presence of gaps.
Use : Traders can monitor the chart's color to stay aligned with the market’s trend, staying long during green phases and short during purple ones.
⯌ Gap Size Filtering :
Each detected gap is assigned a numerical ranking based on its size, with larger gaps having higher rankings. The gap size filter allows traders to only display gaps that meet a minimum size threshold, focusing on the most impactful gaps in terms of price movement.
Use : Traders can use the filter to focus on gaps of a certain size, filtering out smaller, less significant gaps. The numerical ranking helps identify the largest and most influential gaps for decision-making.
⯌ FVG Level Visualization :
The indicator can display dashed lines marking the levels of previously filled FVGs. These levels represent areas where price once experienced a gap and later filled it. Monitoring these levels can provide traders with key reference points for potential reactions in price.
Use : Traders can use these gap levels to track where price has filled gaps and potentially use these levels as zones for entry, exit, or assessing market behavior.
⯁ USER INPUTS
Filter Gaps : Adjust the size threshold to filter gaps by their size ranking.
Show Gap Levels : Toggle the display of dashed lines at filled FVG levels.
Enable Trailing Stop : Activate or deactivate the trailing stop feature based on FVGs.
Trailing Stop Length : Set the number of bars used to calculate the trailing stop.
Bullish/Bearish Colors : Customize the colors representing bullish and bearish gaps.
⯁ CONCLUSION
The Gaps Trend indicator combines Fair Value Gap detection with a dynamic trailing stop feature to help traders manage trades during periods of high price momentum. By detecting gaps caused by strong buy or sell pressure and applying adaptive stops, the indicator provides a powerful tool for riding trends and managing risk. The additional ability to filter gaps by size and visualize previously filled gaps enhances its utility for both trend-following and risk management strategies.

ICT HTF FVGs v2 (fadi)NOTICE: Instead of updating the existing ICT HTF FVGs indicator, this indicator is being published separately due to the requests to keep the original by some traders and because of the drastic change in behavior/configurations. If the original v1 version is more appropriate for your style of trading, feel free to continue to use it.
ICT HTF FVGs v2
In trading, Fair Value Gaps (FVGs) refer to market inefficiencies or imbalances that occur when buying and selling activities are not equal. These gaps can be identified on various timeframes and are used in different trading strategies.
FVGs are crucial in price action trading as they highlight the difference between the current market price of an asset and its fair value. Traders use these gaps to identify potential trading opportunities, as they often indicate areas where the market may correct itself
This indicator will overlap the higher timeframe (HTF) FVGS over the current timeframe to help traders anticipate and plan their trades.
Features
Up to 6 higher timeframes (HTF) can be overlayed on a chart
Traders can limit the number of HTF FVGs to preset number of HTFs
Lower and current timeframes can be included
Configurable spacing of HTF FVGs to prevent overlapping
Configurable Smart Expansion of FVGs based on proximity to current price
Traders can decide what constitutes a Mitigated FVG
Show or hide mitigated FVGs to declutter the chart
Flexible display settings that controls how the FVGs are displayed
Flexible labeling of the FVG levels and content
Higher Timeframes Display Settings
This indicator provides the ability to select up to 6 HTF intervals. These intervals are based on the trader's timeframes including any custom timeframes.
Timeframe Configurations
Enable or Disable a Timeframe
The Timeframe to Display
Bullish / BISI FVG Color
Bearish / SIBI FVG Color
The number of FVGs For The Selected Timeframe
Limit to the next HTFs only can be used to display the selected number of HTF FVGs. For example, if the trader selects 3 then only 3 HTF FVGs will be displayed.
Note: If either of the next two options is selected, they will take up spots from this count.
Hide lower Timeframes restricts the FVGs to higher timeframes only. If this option is disabled, it will show lower timeframes FVGs as well.
Hide Current Timeframe removes current timeframe from the selected list of HTF FVGs. If this option is disabled, it will show current timeframe FVGs as well.
Background Transparency Enable or disable the background color (shaded area) of the FVG. If it is enabled, it will set the transparency amount. The higher the value, the more transparent the background.
Extend lines controls when and how to extend the FVG levels. There are three options:
Extension Only extends the FVGs by the specified number provided below only.
Current Candle Plus Extension extends all the FVGs beyond the current candle by the number provided below.
When in Range will only extend the FVGs near current price based on the advanced settings below. This setting will use Average True Range multiplier to calculate the range (shows FVGs that are higher or lower by the average candle size multiplied by the number in Advanced section).
Mitigated shows or hides the mitigated HTF FVGs. A FVG is considered mitigated based on one of the following options:
None will ignore mitigation and show all FVGs.
Touched when a HTF FVG is touched regardless of how deep the price get inside the FVG.
Wick filled the FVG is closed by a wick or body of a candle.
Body filled the FVG is closed by the body of a candle
Wick filled half a candle's wick or body has reached the C.E. of the FVG
Body filled half a candle body has reached the C.E. of the FVG
Extend mitigated lines sets the number of candles to extend the mitigated FVG levels by for better visibility.
Important Note: Mitigation is calculated based on the timeframe of the FVG, not current timeframe.
Display
Display settings focus on how the FVGs will be displayed. The trader is in total control and there are multiple ways to overlay FVGs on the chart.
Open / Close / C.E. / Link controls the borders. Traders can enable or disable any of them as well as set the thickness and style. Link is the right border.
C.E. also offers the option of setting the bullish (BISI) and bearish (SIBI) colors of the C.E. level
Labeling controls if the labels should be displayed next to the FVG, their color, background, and font size.
Label levels to display controls which levels to show. Open, High. or the C.E.
Label display content controls what to show in the labels, the timeframe of the label, is it a BISI or a SIBI, and a label to indicate if it is the Open or the Close.
Note: if the distance between the open and close has the potential of overlapping the labels, then the indicator will only show the C.E. label for visual clarity.
Advanced Settings
Advanced settings controls some internal calculations:
Proximity factor based on daily range used to calculate possible range of FVGs within a day's range to keep the chart clean. The higher the value, the more FVGs will be shown.
Combine labels factor for visibility used to calculate the distance between the open and close and if all the labels or only the C.E. should be displayed. The higher the value, the bigger the distance for combination (smaller numbers will show more labels).
Range should be within X candles used when "When in Range" option is selected. This is the ATR multiplier used to extend the FVGs. The higher the number, the more FVGs will be extended.
Once desired settings have been achieved, the settings can be saved as default from the bottom left of the indicator settings page for future use.

Liquidity strategy tester [Influxum]This tool is based on the concept of liquidity. It includes 10 methods for identifying liquidity in the market. Although this tool is presented as a strategy, we see it more as a data-gathering instrument.
Warning: This indicator/strategy is not intended to generate profitable strategies. It is designed to identify potential market advantages and help with identifying effective entry points to capitalize on those advantages.
Once again, we have advanced the methods of effectively searching for liquidity in the market. With strategies, defined by various entry methods and risk management, you can find your edge in the market. This tool is backed by thorough testing and development, and we plan to continue improving it.
In its current form, it can also be used to test well-known ICT or Smart Money concepts. Using various methods, you can define market structure and identify areas where liquidity is located.
Fair Value Gaps - one of the entry signal options is fair value gaps, where an imbalance between buyers and sellers in the market can be expected.
Time and Price Theory - you can test this by setting liquidity from a specific session and testing entries as that liquidity is grabbed
Judas Swing - can be tested as a market reversal after a breakout during the first hours of trading.
Power of Three - accumulation can be observed as the market moving within a certain range, identified as cluster liquidity in our tool, manipulation occurs with the break of liquidity, and distribution is the direction of the entry.
🟪 Methods of Identifying Liquidity
Pivot Liquidity
This refers to liquidity formed by local extremes – the highest or lowest prices reached in the market over a certain period. The period is defined by a pivot number and determines how many candles before and after the high/low were higher/lower. Simply put, the pivot number represents the number of adjacent candles to the left and right, with a lower high for a pivot high and a higher low for a pivot low. The higher the number, the more significant the high/low is. Behind these local market extremes, we expect to find orders waiting for breakout as well as stop-losses.
Gann Swing
Similar to pivot liquidity, Gann swing identifies significant market points. However, instead of candle highs and lows, it focuses on the closing prices. A Gann swing is formed when a candle closes above (or below) several previous closes (the number is again defined by a strength parameter).
Percentage Change
Apart from ticks, percentages are also a key unit of market movement. In the search for liquidity, we monitor when a local high or low is formed. For liquidity defined by percentage change, a high must be a certain percentage higher than the last low to confirm a significant high. Similarly, a low must be a defined percentage away from the last significant high to confirm a new low. With the right percentage settings, you can eliminate market noise.
Session Range (3x)
Session range is a popular concept for finding liquidity, especially in smart money concepts (SMC). You can set up liquidity visualization for the Asian, London, or New York sessions – or even all three at once. This tool allows you to work with up to three sessions, so you can easily track how and if the market reacts to liquidity grabs during these sessions.
Tip for traders: If you want to see the reaction to liquidity grab during a specific session at a certain time (e.g., the well-known killzone), you can set the Trading session in this tool to the exact time where you want to look for potential entries.
Unfinished Auction
Based on order flow theory, an unfinished auction occurs when the market reverses sharply without filling all pending orders. In price action terms, this can be seen as two candles at a local high or low with very similar or identical highs/lows. The maximum difference between these values is defined as Tolerance, with the default setting being 3 ticks. This setting is particularly useful for filtering out noise during slower market periods, like the Asian session.
Double Tops and Bottoms
A very popular concept not only from smart money concepts but also among price pattern traders is the double bottom and double top. This occurs when the market stops and reverses at a certain price twice in a row. In the tool, you can set how many candles apart these bottoms/tops can be by adjusting the Length parameter. According to some theories, double bottoms are more effective when there is a significant peak between the two bottoms. You can set this in the tool as the Swing value, which defines how large the movement (expressed in ticks) must be between the two peaks/bottoms. The final parameter you can adjust is Tolerance, which defines the possible price difference between the two peaks/bottoms, also expressed in ticks.
Range or Cluster Liquidity
When the market stays within a certain price range, there’s a chance that breakout orders and stop-losses are accumulating outside of this range. Our tool defines ranges in two ways:
Candle balance calculates the average price within a candle (open, high, low, and close), and it defines consolidation when the centers of candles are within a certain distance from each other.
Overlap confirms consolidation when a candle overlaps with the previous one by a set percentage.
Daily, Weekly, and Monthly Highs or Lows
These options simply define liquidity as the previous day’s, week’s, or month’s highs or lows.
Visual Settings
You can easily adjust how liquidity is displayed on the chart, choosing line style, color, and thickness. To display only uncollected liquidity, select "Delete grabbed liquidity."
Liquidity Duration
This setting allows you to control how long liquidity areas remain valid. You can cancel liquidity at the end of the day, the second day, or after a specific number of candles.
🟪 Strategy
Now we come to the part of working with strategies.
Max # of bars after liquidity grab – This parameter allows you to define how many candles you can search for entry signals from the moment liquidity is grabbed. If you are using engulfing as an entry signal, which consists of 2 candles, keep in mind that this number must be at least 2. In general, if you want to test a quick and sharp reaction, set this number as low as possible. If you want to wait for a structural change after the liquidity grab, which may require more candles, set the number a bit higher.
🟪 Strategy - entries
In this section, we define the signals or situations where we can enter the market after liquidity has been taken out.
Liquidity grab - This setup triggers a trade immediately after liquidity is grabbed, meaning the trade opens as the next candle forms.
Close below, close above - This refers to situations where the price closes below liquidity, but then reverses and closes above liquidity again, suggesting the liquidity grab was a false breakout.
Over bar - This occurs when the entire candle (high and low) passes beyond the liquidity level but then experiences a pullback.
Engulfing - A popular price action pattern that is included in this tool.
2HL - weak, medium, strong - A variation of a popular candlestick pattern.
Strong bar - A strong reactionary candle that forms after a liquidity grab. If liquidity is grabbed at a low, this would be a strong long candle that closes near its high and is significantly larger compared to typical volatility.
Naked bar - A candlestick pattern we’ve tested that serves as a good confirmation of market movement.
FVG (Fair Value Gap) - A currently popular concept. This is the only signal with additional settings. “Pending FVG order valid” means if a fair value gap forms after a liquidity grab, a limit order is placed, which remains valid for a set number of candles. “FVG minimal tick size” allows you to filter based on the gap size, measured in ticks. “GAP entry model” lets you decide whether to place the limit order at the gap close or its edge.
🟪 Strategy - General
Long, short - You can choose whether to focus on long or short trades. It’s interesting to see how long and short trades yield different results across various markets.
Pyramiding - By default, the tool opens only one trade at a time. If a new signal arises while a trade is open, it won’t enter another position unless the pyramiding box is checked. You also need to set the maximum number of open trades in the Properties.
Position size - Simply set the size of the traded position.
🟪 Strategy - Time
In this section, you can set time parameters for the strategy being tested.
Test since year - As the name implies, you can limit the testing to start from a specific year.
Trading session - Define the trading session during which you want to test entries. You can also visualize the background (BG) for confirmation.
Exclude session - You can set a session period during which you prefer not to search for trades. For example, when the New York session opens, volatility can sharply increase, potentially reducing the long-term success rate of the tested setup.
🟪 Strategy - Exits
This section lets you define risk management rules.
PT & SL - Set the profit target (PT) and stop loss (SL) here.
Lowest/highest since grab - This option sets the stop loss at the lowest point after a liquidity grab at a low or at the highest point after a liquidity grab at a high. Since markets usually overshoot during liquidity grabs, it’s good practice to place the stop loss at the furthest point after the grab. You can also set your risk-reward ratio (RRR) here. A value of 1 sets an RRR of 1:1, 2 means 2:1, and so on.
Lowest/highest last # bars - Similar to the previous option, but instead of finding the extreme after a liquidity grab, it identifies the furthest point within the last number of candles. You can set how far back to look using the # bars field (for an engulfing pattern, 2 is optimal since it’s made of two candles, and the stop loss can be placed at the edge of the engulfing pattern). The RRR setting works the same way as in the previous option.
Other side liquidity grab - If this option is checked, the trade will exit when liquidity is grabbed on the opposite side (i.e., if you entered on a liquidity grab at a low, the trade will exit when liquidity is grabbed at a high).
Exit after # bars - A popular exit strategy where you close the position after a set number of candles.
Exit after # bars in profit - This option exits the trade once the position is profitable for a certain number of consecutive candles. For example, if set to 5, the position will close when 5 consecutive candles are profitable. You can also set a maximum number of candles (in the max field), ensuring the trade is closed after a certain time even if the profit condition hasn’t been met.
🟪 Alerts
Alerts are a key tool for traders to ensure they don’t miss trading opportunities. They also allow traders to manage their time effectively. Who would want to sit in front of the computer all day waiting for a trading opportunity when they could be attending to other matters? In our tool, you currently have two options for receiving alerts:
Liquidity grabs alert – if you enable this feature and set an alert, the alert will be triggered every time a candle on the current timeframe closes and intersects with the displayed liquidity line.
Entry signals alert – this feature triggers an alert when a signal for entry is generated based on the option you’ve selected in the Entry type. It’s an ideal way to be notified only when a trading opportunity appears according to your predefined rules.

ICT Unicorn | Flux Charts💎 GENERAL OVERVIEW
Introducing our new ICT Unicorn Indicator! This indicator is built around the ICT's "Unicorn" strategy. The strategy uses Breaker Blocks and Fair Value Gaps for entry confirmation. For more information about the process, check the "HOW DOES IT WORK" section.
Features of the new ICT Unicorn Indicator :
Implementation of ICT's Unicorn Strategy
Toggleable Retracement Entry Method
3 Different TP / SL Methods
Customizable Execution Settings
Customizable Backtesting Dashboard
Alerts for Buy, Sell, TP & SL Signals
📌 HOW DOES IT WORK ?
The ICT Unicorn entry model merges the concepts of Breaker Blocks and Fair Value Gaps (FVGs), offering a distinct method for identifying trade opportunities. By integrating these two elements, we can have a position entry with stop-loss and take-profit targets on the potential support & resistance zones. This model is particularly reliable for trade entry, as it combines two powerful entry techniques.
An ICT Unicorn Model consists of a FVG which is overlapping with a Breaker Block of the same type. Here is an example :
When a FVG overlaps with a Breaker Block of the same type, the indicator gives a Buy or Sell signal depending on the FVG type (Bullish & Bearish). If the "Require Retracement" option is enabled in the settings, the signals are not given immediately. Instead, the current price of the ticker will need to touch the FVG once more before the signals are given.
After the Buy or Sell signal, the indicator immediately draws the take-profit (TP) and stop-loss (SL) targets. The indicator has three different TP & SL modes, explained in the "Settings" section of this write-up.
You can set up alerts for entry and TP & SL signals, and also check the current performance of the indicator and adjust the settings accordingly to the current ticker using the backtesting dashboard.
🚩 UNIQUENESS
This indicator is an all-in-one suit for the ICT's Unicorn concept. It's capable of plotting the strategy, giving signals, a backtesting dashboard and alerts feature. Different and customizable algorithm modes will help the trader fine-tune the indicator for the asset they are currently trading. Three different TP / SL modes are available to suit your needs. The backtesting dashboard allows you to see how your settings perform in the current ticker. You can also set up alerts to get informed when the strategy is executable for different tickers.
⚙️ SETTINGS
1. General Configuration
FVG Detection Sensitivity -> You may select between Low, Normal, High or Extreme FVG detection sensitivity. This will essentially determine the size of the spotted FVGs, with lower sensitivies resulting in spotting bigger FVGs, and higher sensitivies resulting in spotting all sizes of FVGs.
Swing Length -> Swing length is used when finding order block formations. Smaller values will result in finding smaller order & breaker blocks.
Require Retracement ->
a) Disabled : The entry signal is given immediately once a FVG overlaps with a Breaker Block of the same type.
b) Enabled : The current price of the ticker will need to touch the FVG once more before the entry signal is given.
2. TP / SL
TP / SL Method ->
a) Unicorn : This is the default option. The SL will be set to the lowest low of the last 100 bars with an extra offset in a Buy signal. For Sell signals, the SL will be set to the highest high of the last 100 bars with an extra offset. The TP is then set to a value using the SL value and maintaining a risk-reward ratio.
b) Dynamic: The TP / SL zones will be auto-determined by the algorithm based on the Average True Range (ATR) of the current ticker.
c) Fixed : You can adjust the exact TP / SL ratios from the settings below.
Dynamic Risk -> The risk you're willing to take if "Dynamic" TP / SL Method is selected. Higher risk usually means a better winrate at the cost of losing more if the strategy fails. This setting is has a crucial effect on the performance of the indicator, as different tickers may have different volatility so the indicator may have increased performance when this setting is correctly adjusted.

Unicorn ICT Signals [TradingFinder] Breaker Block + FVG Zones🔵 Introduction
The "ICT Unicorn Model" trading strategy in the "Inner Circle Trader" (ICT) style is one of the well-known strategies in the world of Forex and financial market trading.
The ICT methodology was developed by Michael Huddleston and is based on technical analysis and Price Action concepts.
This style focuses specifically on interpreting price movements and identifying optimal entry and exit points in the market.
In the Unicorn strategy, traders seek points where the probability of price reversal or trend continuation is high. This strategy is primarily based on recognizing and analyzing Price Action patterns and market structure.
By understanding"ICT Unicorn Model", traders can make more informed decisions about where to enter or exit trades, thereby increasing their chances of success in the market.
🟣 Understanding the Breaker Block
A Breaker Block is a specialized form of an Order Block that changes its role after a key market level is broken. Typically, an Order Block is an area on the chart where large institutional orders are likely to be placed, providing strong support or resistance.
However, when this area is breached, and the price moves in the opposite direction, it transforms into what is known as a Breaker Block. This shift indicates a reversal in market sentiment, turning the previous support into resistance or vice versa, thereby signaling a potential trend change to traders.
🟣 The Significance of the Fair Value Gap (FVG)
The Fair Value Gap (FVG) refers to an area on a price chart where the price rapidly moves through a level, leaving behind a gap. This gap represents an imbalance between supply and demand and is often seen as a potential area for price to return and fill the gap.
These zones are crucial for traders as they can indicate future price movements, providing opportunities to enter or exit trades.
🟣 Defining the ICT Unicorn Model
When an FVG overlaps with a Breaker Block, it forms a highly significant trading area known as a Unicorn. This overlap creates an ideal zone for traders to enter the market, as it combines two powerful technical signals.
The Unicorn Model is therefore considered an optimal strategy for identifying precise entry and exit points in the financial markets.
Demand ICT Unicorn Model :
Supply ICT Unicorn Model :
🔵 How to Use
🟣 Bullish ICT Unicorn
The Bullish ICT Unicorn model is applicable when the market is in an uptrend, and traders are seeking buying opportunities.
Follow these steps to identify Bullish ICT Unicorn :
Identify the Bullish Breaker Block : Locate an area where the price moved upward after breaking an Order Block. This area now acts as a Breaker Block.
Identify the Bullish FVG : Look for a Fair Value Gap near the Breaker Block.
Confirm the Unicorn : When the Bullish Breaker Block and Bullish FVG overlap, a Bullish Unicorn is confirmed. Traders can enter a buy position when the price returns to this zone.
🟣Bearish ICT Unicorn
The Bearish ICT Unicorn model is used when the market is in a downtrend, and traders are looking for selling opportunities.
To identify Bearish ICT Unicorn, follow these steps :
Identify the Bearish Breaker Block : Find an area where the price moved downward after breaking an Order Block. This area now acts as a Breaker Block.
Identify the Bearish FVG : Check if a Fair Value Gap has formed near the Breaker Block.
Confirm the Unicorn : When the Bearish Breaker Block and Bearish FVG overlap, a Bearish Unicorn is confirmed. Traders can enter a sell position when the price returns to this zone.
🔵 Setting
🟣 Global Setting
Pivot Period of Order Blocks Detector : Enter the desired pivot period to identify the Order Block.
Order Block Validity Period (Bar) : You can specify the maximum time the Order Block remains valid based on the number of candles from the origin.
Mitigation Level Breaker Block : Determining the basic level of a Breaker Block. When the price hits the basic level, the Breaker Block due to mitigation.
Mitigation Level FVG : Determining the basic level of a FVG. When the price hits the basic level, the FVG due to mitigation.
Mitigation Level Unicorn : Determining the basic level of a Unicorn Block. When the price hits the basic level, the Unicorn Block due to mitigation.
🟣 Unicorn Block Display
Show All Unicorn Block : If it is turned off, only the last Order Block will be displayed.
Demand Unicorn Block : Show or not show and specify color.
Supply Unicorn Block : Show or not show and specify color.
🟣 Breaker Block Display
Show All Breaker Block : If it is turned off, only the last Breaker Block will be displayed.
Demand Main Breaker Block : Show or not show and specify color.
Demand Sub (Propulsion & BoS Origin) Breaker Block : Show or not show and specify color.
Supply Main Breaker Block : Show or not show and specify color.
Supply Sub (Propulsion & BoS Origin) Breaker Block : Show or not show and specify color.
🟣 Fair Value Gap Display
Show Bullish FVG : Toggles the display of demand-related boxes.
Show Bearish FVG : Toggles the display of supply-related boxes.
🟣 Logic Settings
🟣 Order Block Refinement
Refine Order Blocks : Enable or disable the refinement feature. Mode selection.
🟣 FVG Filter
FVG Filter : This refines the number of identified FVG areas based on a specified algorithm to focus on higher quality signals and reduce noise.
Types of FVG filters :
Very Aggressive Filter: Adds a condition where, for an upward FVG, the last candle's highest price must exceed the middle candle's highest price, and for a downward FVG, the last candle's lowest price must be lower than the middle candle's lowest price. This minimally filters out FVGs.
Aggressive Filter: Builds on the Very Aggressive mode by ensuring the middle candle is not too small, filtering out more FVGs.
Defensive Filter: Adds criteria regarding the size and structure of the middle candle, requiring it to have a substantial body and specific polarity conditions, filtering out a significant number of FVGs.
Very Defensive Filter: Further refines filtering by ensuring the first and third candles are not small-bodied doji candles, retaining only the highest quality signals.
🟣 Alert
Alert Name : The name of the alert you receive.
Alert ICT Unicorn Model Block Mitigation :
On / Off
Message Frequency :
This string parameter defines the announcement frequency. Choices include: "All" (activates the alert every time the function is called), "Once Per Bar" (activates the alert only on the first call within the bar), and "Once Per Bar Close" (the alert is activated only by a call at the last script execution of the real-time bar upon closing). The default setting is "Once per Bar".
Show Alert Time by Time Zone :
The date, hour, and minute you receive in alert messages can be based on any time zone you choose. For example, if you want New York time, you should enter "UTC-4". This input is set to the time zone "UTC" by default.
🔵Conclusion
The Unicorn Model in ICT, utilizing the concepts of Breaker Blocks and Fair Value Gaps, provides an effective tool for identifying entry and exit points in financial markets. By offering more precise signals, this model helps traders make better decisions and minimize trading risks.
Success in applying this model requires practice and a deep understanding of market structure, but it can significantly improve trading performance.

Fair Value Gap & Gap Profile [BigBeluga]This indicator is designed to help traders identify and utilize fair value gaps on price charts and analyze volume at these points. These gaps, formed by significant price movements, can act as key support and resistance levels. The indicator enhances trading strategies by visually representing these gaps, making it easier for traders to spot potential entry and exit points.
⦿ What Is A Fair Value Gap?
Before diving into the practical use of the Fair Value Gap in trading, it's crucial to have a clear understanding of what it is and how to identify it on your charts. The Fair Value Gap, or FVG , is a widely utilized tool among price action traders to detect market inefficiencies or imbalances. Sometimes you will even see them labeled as inefficiencies by other traders. These imbalances arise when buying or selling pressure is significant, resulting in a large upward or downward move, leaving behind an imbalance in the market.
The idea behind FVGs is that the market will eventually come back to these inefficiencies in the market before continuing in the same direction as the initial impulsive move. FVGs are important since traders can achieve an edge in the market. Price action traders can also use these imbalances as entry or exit points in the market.
By visually representing gaps and their profile, the Fair Value Gap (FVG) & Gap Profile indicator provides a historical overview of gaps within a specified lookback period, showing the distribution and density of gaps across different price levels. This insight helps traders identify zones where the price tends to move more fluidly, often encountering less resistance. High points on the Gap Profile indicate areas where gaps have occurred frequently in the past, which could serve as potential breakout or breakdown zones.
⦿ Key Features:
● Gap Detection and Visualization:
- Identifies Bullish and Bearish Gaps: Highlights gaps where the price moved significantly up or down along with a volume. Intensivity of color show strength of FVG by volume
- Filter for Significant Gaps: Allows users to filter out insignificant gaps, ensuring only relevant gaps are displayed.
● Customizable Display Options:
- Shows Filled Gaps: Option to display gaps that have been filled, aiding in the analysis of historical price movements.
- Displays Filled Gap Levels: Highlights the levels of filled gaps.
● Gap Profile:
Gap Profile Insight: The Gap Profile feature shows the distribution of gaps over a specified lookback period. High points on the FVG Profile indicate areas with a significant number of gaps in the past. These high points are signs of low resistance for price movement. Consequently, at these points, the price tends to move more easily without encountering strong resistance. Traders can use this information to identify potential breakout or breakdown zones where price action is likely to be more fluid.
● Grab Liquidity Detection:
- Collect liquidity Signals: Plots markers on the chart where price interacts with gap levels, providing potential trade signals based on liquidity.
⦿ How Traders Can Use This Indicator:
- Plan Trades: Use gaps as potential entry and exit points, based on whether the price is approaching, filling, or moving away from a gap.
- Analyze Market Trends: Understand historical price movements by analyzing filled gaps and their impact on current price action.
- Analyze Gap Profile: Identify zones where the price tends to move more fluidly, often encountering less resistance. High points on the Gap Profile indicate areas where gaps have occurred frequently in the past, which could serve as potential breakout or breakdown zones.
- Price imbalance: market will eventually come back to these inefficiencies and fill them. inefficiencies or imbalances in the market usually act as a magnet for price.
By incorporating the Fair Value Gap & Gap Profile indicator into their trading strategy, traders can gain a clearer understanding of market dynamics and make more informed trading decisions.
