TDI Fibonacci Volatility Bands Candle Coloring [cryptalent]"This is an advanced Traders Dynamic Index (TDI) candle coloring system, designed for traders seeking precise dynamic analysis. Unlike traditional TDI, which typically relies on a 50 midline with a single standard deviation band (±1 SD), this indicator innovatively incorporates Fibonacci golden ratio multiples (1.618, 2.618, 3.618 times standard deviation) to create multi-layered dynamic bands. It precisely divides the RSI fast line (green line) position into five distinct strength zones, instantly reflecting them on the candle colors, allowing you to grasp market sentiment in real-time without switching to a sub-chart.
Core Calculation Logic:
RSI Period (default 20), Band Length (default 50), and Fast MA Smoothing Period (default 1) are all adjustable.
The midline is the Simple Moving Average (SMA) of RSI, with upper and lower bands calculated by multiplying Fibonacci multiples with Standard Deviation (STDEV), generating three dynamic band sets: 1.618, 2.618, and 3.618.
Traders can quickly identify the following scenarios:
Extreme Overbought Zone (Strong Bullish, Red): Fast line exceeds custom threshold (default 82) and breaks above the specified band (default 2.618). This often signals overheating, potentially a profit-taking point or reversal short entry, especially at trend tops.
Extreme Oversold Zone (Strong Bearish, Green): Fast line drops below custom threshold (default 28) and breaks below the specified band (default 2.618). This is a potential strong rebound starting point, ideal for bottom-fishing or long entries.
Medium Bullish Zone (Yellow): Fast line surpasses medium threshold (default 66) and stands above the specified band (default 1.618), indicating bullish dominance in trend continuation.
Medium Bearish Zone (Orange): Fast line falls below medium threshold (default 33) and breaks below the specified band (default 1.618), signaling bearish control in segment transitions.
Neutral Zone (No Color Change): Fast line within custom upper and lower limits (default 34~65), retaining original candle colors to avoid noise interference during consolidation.
Color priority logic flows from strong to weak (Extreme > Medium > Neutral), ensuring no conflicts. All parameters are highly customizable, including thresholds, band selections (1.618/2.618/3.618/Midline/None), color schemes, and even optional semi-transparent background coloring (default off, transparency 90%) for enhanced visual layering.
Applicable Scenarios:
Intraday Trading: Capture extreme color shifts as entry/exit signals.
Swing Trading: Use medium colors to confirm trend extensions.
Long-Term Trend Following: Filter noise in neutral zones to focus on major trends.
Supports various markets like forex, stocks, and cryptocurrencies. After installation, adjust parameters in settings to match your strategy, and combine with other indicators like moving averages or support/resistance for improved accuracy.
If you're a TDI enthusiast, this will make your trading more intuitive and efficient!
Fibonnacci

ZigZag + Fibonacci
⚙️ Main Features
• Automatic ZigZag: Detects the latest high and low pivots based on an adjustable period.
• Dynamic Fibonacci: Automatically draws the 38.2%, 50%, and 61.8% levels based on the last ZigZag movement.
• Display Control:
o Enable or disable the blue line connecting the pivots (ZigZag line).
o Adjust the horizontal length of the Fibonacci lines (in number of bars).
• Customizable Colors:
o Choose different colors for each Fibonacci level.
o Customize the color of the ZigZag line.
________________________________________
🧑🏫 How to Use
1. Add the indicator to your chart on TradingView.
2. Configure the parameters according to your strategy:
o ZigZag Period: defines the sensitivity of the pivots (higher values = wider movements).
o Fibonacci Line Length: how many bars the horizontal lines should extend.
o Show ZigZag Line: check or uncheck to display the blue line between pivots.
o Colors: customize the visual appearance of the Fibonacci levels and ZigZag line.
3. Interpret the Fibonacci levels:
o Use the levels as possible support and resistance zones.
o Combine with other technical signals for more assertive entries and exits.

Fib Golden RatioDynamic Fib High → Low (0.5 & 0.618)
This indicator automatically tracks the current day’s High and Low and plots the key Fibonacci retracement levels 0.5 (50%) and 0.618 (Golden Ratio) based on the live intraday price range.
The tool is designed for traders who want simple, clean, and dynamic intraday Fibonacci levels without clutter on the chart.
How It Works
Detects the start of a new trading day
Tracks the highest high and lowest low of the current day
Continuously recalculates:
Fibonacci 0.5 (Midpoint)
Fibonacci 0.618 (Golden Ratio)
Plots clean continuous lines across the chart
Fib is calculated from High → Low, matching how typical intraday fib tools are visually applied
Why This Indicator
No drawings to manually adjust
No user configuration required
Extremely lightweight and fast
Automatically adjusts as the day progresses
Perfect for identifying intraday mean reversion zones, pullback zones, and reaction levels
Ideal Use Cases
Intraday directional trading
Scalping pullbacks
Mean reversion setups
Identifying dynamic support/resistance zones
Option scalping (CE/PE)

SCOTTGO ORB V1SCOTTGO ORB (Opening Range Breakout) Indicator
The ORB Indicator is a powerful tool for day traders and scalpers, designed to automatically identify and project key price levels based on the market's initial trading activity—the Opening Range (OR).
It helps you quickly visualize the market structure, potential breakout zones, and price targets for the day.
🔑 Key Features & Customization
1. Dynamic Opening Range Calculation
Flexible Time Periods: Easily define your Opening Range using preset times of 5, 15, or 30 minutes. You can also use the International Overrides to set a custom start and end time with a specified timezone.
Visual Range: The indicator automatically calculates and shades the range between the ORB High and ORB Low prices. The Opacity of this shaded box is fully adjustable.
2. Comprehensive Price Targets
The indicator projects multiple levels of price targets (PTs) based on the size of the initial Opening Range, enabling you to set profit targets and manage risk. Targets are grouped for easy toggling:
Default Targets (50%): Visualize the immediate $50\%$ price extension above and below the ORB.
Extended Targets (75%, 100%): View the $75\%$ and full $100\%$ extension levels.
Further Targets (150%, 200%): Explore extended targets for volatile or trending days.
Mid Point: Optional line to display the $50\%$ retracement/midpoint of the ORB itself.
3. Fibonacci Extensions
Access highly relevant price projections using classic Fibonacci ratios:27.2% and 61.8% Extensions: These provide additional high-probability price targets for breakout scenarios.
4. Breakout & Retest Signaling
Entry Signals: Displays on-chart labels for potential ORB Breakouts and subsequent
Retests (BRB), helping you identify high-probability entry points.
Alert Options: Set alerts for simple ORB level crosses or restrict alerts only to confirmed breakout scenarios (Alert only on ORB breakouts).
🎨 Style Customization
All main ORB lines, target levels, and Fibonacci lines can be individually styled (color, thickness, line type) directly within the TradingView Style tab for a personalized chart experience. Dedicated inputs are available for setting colors for 50%, 75%, 100%, and Fibonacci 27.2% / 61.8% levels.
💡 How to Use
1. Set Your ORB Period: Choose the time frame that best suits your market (e.g., 15 minutes is common for US indices).
2. Monitor the Breakout: Once the ORB session ends, wait for the price to break above the ORB High or below the ORB Low.
3. Target and Risk: Use the projected Price Targets to define your potential profit zones, and place stop-losses just inside the ORB range.
SCOTTGO

[MTX] Weekly Support & Resistance Weekly Support & Resistance
Overview
Discover key market structure with this all-in-one indicator:
Weekly Support & Resistance (SR) levels , Fair Value Gap (FVG) detection , and Automatic Fibonacci retracements .
Designed for MTX traders, it plots non-repainting weekly highs/lows/opens/closes, highlights unmitigated FVGs for potential imbalances, and auto-draws Fib levels, Perfect for swing/day traders on XAUUSD.
🚀 Key Features
- Weekly SR Levels : Plots previous week's High (resistance), Low (support), Open, and Close. Optional historical levels (Week -2/-3).
- SR Zones : Customizable % zones around levels for dynamic support/resistance bands. Fill colors for easy visualization.
- FVG Detection : Identifies bullish (green) and bearish (red) Fair Value Gaps on your chart timeframe.
- buy/sell Signals :
- Trend Filter : Optional EMA/SMA to filter signals
- Auto Fibonacci : auto-retracement with 20+ levels (0%, 23.6%, 38.2%, 50%, 61.8%, 100%, extensions to 423.6%, negatives). Custom colors, labels, and background fills.
- Alerts: Built-in for FVG creation/mitigation + all buy/sell signals. Set up once for real-time notifications.
⚠️ Important Disclaimer
This indicator is for educational and analysis purposes only. It provides visual tools and signals based on historical price action— not financial advice. Past performance ≠ future results. Trading involves risk; use proper risk management. Backtest thoroughly. No guarantees of profitability. Consult a financial advisor.
#tradingview #smc #MTX #fvg #fibonacci #supportresistance

fibonacci2Library "fibonacci2"
Useful methods to calculate and display fibonacci retracement
modelParamsNew(point_0, point_1)
Parameters:
point_0 (chart.point)
point_1 (chart.point)
modelParamsNew(this, point_0, point_1)
Parameters:
this (viewParams)
point_0 (chart.point)
point_1 (chart.point)
method toModelParams(this, point_0, point_1)
Namespace types: viewParams
Parameters:
this (viewParams)
point_0 (chart.point)
point_1 (chart.point)
method createModel(params)
Namespace types: modelParams
Parameters:
params (modelParams)
method createView(this, params)
Namespace types: model
Parameters:
this (model)
params (viewParams)
method delete(view)
Namespace types: view
Parameters:
view (view)
levelModelParams
Fields:
level (series float)
levelViewParams
Fields:
level (series float)
color (series color)
line_width (series int)
line_style (series lineStyleEnum enum from Hamster-Coder/drawing/1)
levelModel
Represents a Fibonacci retracement level
Fields:
level (series float) : The Fibonacci level ratio (e.g., 0.382, 0.5, 0.618)
value (series float) : The Y-coordinate on the chart corresponding to this level
modelParams
Represents the full parameter set for the Fibonacci retracement model
Fields:
point_1 (chart.point) : Coordinates of the anchor Point (1) of the model
point_0 (chart.point) : Coordinates of the anchor Point (0) of the model
levels (array) : List of levels to display for this model
model
Fields:
point_1 (chart.point)
point_0 (chart.point)
levels (array)
viewParams
Fields:
levels (array)
x1 (series int)
x2 (series int)
xloc (series string)
show_level_value (series bool)
value_format (series string)
force_overlay (series bool)
view
Fields:
model (model)
lines (array)
labels (array)

Dynamic Pivot Fibonacci v1.3Advanced Fibonacci Levels & Time Zones
This indicator provides a comprehensive suite for Fibonacci analysis, focusing on both price and time. It is designed for technical analysts who require a highly configurable tool to identify key levels of support, resistance, and temporal market rhythm.
📊 Core Price Level Features
The indicator's primary function is to draw Fibonacci price levels based on one of two user-defined calculation methods:
Pivot-Based Calculation: Automatically detects high/low pivot points using configurable Pivot Left and Pivot Right lookback periods.
Memory-Based Calculation: Identifies the highest high and lowest low over a specified Memory Length (lookback period).
🎨 Display & Customization
13 Configurable Levels: Users can enable, define, and color up to 13 distinct price levels.
Background Fill: Optional color filling between levels for enhanced visual clarity.
Line Extension: Full control over line drawing, including extending lines to the left, right, or both (either indefinitely or for a limited number of bars).
Historical Deletion: Option to automatically delete previous Fibonacci lines when a new range is detected.
⏳ Additional Analysis Tools
Fibonacci Time Zones: Renders vertical time markers based on the Fibonacci sequence, projected from the selected pivot points. This feature is designed to help identify potential turning points in time.
Trend Analysis (SMMA): Includes an optional module to display multiple Smoothed Moving Averages (SMMA) and an aggregate trend line, assisting in contextual market analysis.
🇮🇷 توضیحات فارسی
سطوح پیشرفته فیبوناچی و مناطق زمانی
این اندیکاتور مجموعهای جامع برای تحلیلهای فیبوناچی، با تمرکز همزمان بر قیمت و زمان، ارائه میدهد. این ابزار برای تحلیلگران فنی طراحی شده است که نیازمند ابزاری با قابلیت تنظیمات بالا جهت شناسایی سطوح کلیدی حمایت، مقاومت و ریتم زمانی بازار هستند.
📊 ویژگیهای اصلی سطوح قیمتی
عملکرد اصلی این اندیکاتور، ترسیم سطوح قیمتی فیبوناچی بر اساس یکی از دو متد محاسباتی قابل تعریف توسط کاربر است:
محاسبه مبتنی بر پیوت (Pivot-Based): به صورت خودکار نقاط پیوت سقف و کف را بر اساس دورههای بازبینی (Lookback) قابل تنظیم (Pivot Left و Pivot Right) شناسایی میکند.
محاسبه مبتنی بر حافظه (Memory-Based): بالاترین سقف و پایینترین کف را در یک طول حافظه (دوره بازبینی) مشخص، پیدا میکند.
🎨 نمایش و سفارشیسازی
۱۳ سطح قابل تنظیم: کاربران میتوانند تا ۱۳ سطح قیمتی مجزا را فعال، تعریف و رنگآمیزی کنند.
پُر کردن پسزمینه (Fill): قابلیت اختیاری پُر کردن فضای بین سطوح با رنگ، برای افزایش وضوح بصری.
امتداد خطوط: کنترل کامل بر ترسیم خطوط، شامل امتداد دادن به سمت چپ، راست یا هر دو طرف (به صورت نامحدود یا برای تعداد کندلهای معین).
حذف سطوح گذشته: گزینهای برای حذف خودکار خطوط فیبوناچی قبلی به هنگام شناسایی یک محدوده جدید.
⏳ ابزارهای تحلیلی جانبی
مناطق زمانی فیبوناچی (Fib Time Zones): نشانگرهای زمانی عمودی را بر اساس دنباله فیبوناچی ترسیم میکند که از نقاط پیوت منتخب، پروجکت (project) شدهاند. این ویژگی برای کمک به شناسایی نقاط عطف احتمالی در بستر زمان طراحی شده است.
تحلیل روند (SMMA): شامل یک ماژول اختیاری برای نمایش چندین میانگین متحرک هموارشده (SMMA) و یک خط روند کلی، جهت کمک به تحلیل زمینه بازار.

FV-Fibonacci+vegas# 功能简介
集成斐波那契自动绘制和vegas均线策略。
当前大版本3.0(基于1.0~2.0功能筛选做的精简版本,去除使用性不高功能,后续主要围绕菲薄纳妾功能做优化)
# 斐波那契
- 斐波那契策略主使用斐波回调(0.328~0.618) + 扩展(2~2.618) 重叠给出信号作为买区。
## 核心功能:
- 颈线1突破:告警和信号线标注辅助手动拉斐波那契,也可以设置自动绘制fibo线条和标签
- 目标区2实现:告警和box绘制显示
- 重叠区信号:斐波回调(0.328~0.618) + 扩展(2~2.618) ,其他重叠信号可选
# vegas
- vegas双通道策略:默认使用ema 12/144/169/576/676
## 核心功能:
- ema12收高收低通道:红色(空)蓝色(多)信号v显示和告警
- 单边突破:趋势保持单边趋势突破时显示信号和告警
- 通道支持:潜在通道支撑信号
# 拐点
- 拐点突破信显示号和告警
- 拐点吸铁石:潜在为实现预期黄色标记,失效灰色标记
# 其他
- 敬请探索
---- English version introduction ----
# Feature Overview Integrates automatic Fibonacci plotting and Vegas moving average strategy.
Current major version 3.0 (a streamlined version based on features from 1.0~2.0, removing less useful features; future optimizations will primarily focus on the Fibonacci plotting functionality).
# Fibonacci
- The Fibonacci strategy primarily uses the overlap of Fibonacci retracement (0.328~0.618) + extension (2~2.618) to provide buy signals.
## Core Functions:
- Neckline 1 Breakout: Alerts and signal lines assist in manually drawing Fibonacci lines; automatic Fibonacci line drawing and labeling can also be set.
- Target Zone 2 Implementation: Alerts and box drawing display.
- Overlapping Zone Signals: Fibonacci retracement (0.328~0.618) + extension (2~2.618); other overlapping signals are optional.
# Vegas
- Vegas Dual-Channel Strategy: Defaults to EMA 12/144/169/576/676
## Core Functions:
- EMA12 High/Low Channel: Red (Short) and Blue (Long) signal display and alerts.
- One-Sided Breakout: Displays signals and alerts when a one-sided trend breaks out.
- Channel Support: Potential channel support signals.
# Inflection Points
- Inflection point breakout signals and alerts.
- Inflection Point Magnet: Potentially expected to be achieved is marked in yellow; failure is marked in gray.
# Others
- Please explore.

Period Range AnalyzerThis indicator analyzes a specific periodic range, which can start from a fixed date or a defined lookback period. It draws percentage levels and colored zones between the highest and lowest price. It also displays a detailed information table, which shows the price's position within the range in "Trend" mode, and the relative strength of currency pairs in "Forex" mode. The current price position is also indicated by a label with a percentage value and the name of the corresponding zone.
User Guide
Calculation Method
This setting determines how the indicator defines the range used for the calculation.
Lookback Period: In this mode, the indicator uses the last N candles (the number can be specified in the "Lookback Period (bars)" field). The range (the highest and lowest price) is "floating," meaning it is recalculated with each new candle based on the last N candles.
Date Based: In this mode, the calculation starts from a fixed date and time you select. The indicator finds the opening price of the start date and continuously tracks the highest and lowest price from that point on. This mode is ideal for measuring performance from a specific event (e.g., start of a week/month/year, news).
Data Handling Note: If you select a date in "Date Based" mode for which no data is available on the current timeframe (e.g., switching to a very low timeframe), the indicator will automatically use the earliest available candle as the starting point. All calculations (Open, Max, Min, Range, Percentage, Change, Trend) are based on this actual start date.
Start Date & Time
This setting is only active in "Date Based" mode.
Here you can specify the fixed starting point for the calculation.
The specified time is in the Exchange timezone.
Important limitation: Due to TradingView platform limits, visual elements (levels, zones) are only drawn for a maximum of 250 candles back. If the set date is older than this, the calculation still applies to the entire period (from the set date), but the drawing only covers the last 250 candles. The table always displays accurate data for the entire period.
When switching to a higher timeframe, the range may restart from a slightly later bar due to TradingView's bar alignment. For best accuracy, set your timeframe first, then select the start date.
Table Mode
This setting controls what data the information table displays.
Trend: This is the default mode, which works on any symbol (stock, index, crypto, etc.). It displays information related to the trend and the range.
Forex: This is a special mode used to measure the strength of currency and crypto pairs. It only works on symbols with exactly 6 characters (e.g., "EURUSD", "BTCUSD"). It treats the first 3 characters as the base currency (e.g., EUR) and the last 3 as the quote currency (e.g., USD). If the symbol does not have 6 characters, the table will automatically display in "Trend" mode.
Trend
This trend determination operates based on the formation order of the high and low within the analyzed range:
Its switch is located in the “Table Additional Rows” menu.
Bullish: Indicated if the low was formed before the high (on different candles). Or if they formed on the same candle, it was a bullish candle.
Bearish: Indicated if the high was formed before the low (on different candles). Or if they formed on the same candle, it was a bearish candle.
Neutral: Indicated if the high and low formed on the same candle, and it was a "doji" candle (close = open).
Upper & Lower Threshold
These settings (Upper Threshold (%) and Lower Threshold (%) in the "Label Coloring" section) primarily determine the state (Bullish/Bearish/Neutral) of the top row of the table.
The logic is not based on the percentage change of the price movement, but on the current price's position within the range, where the bottom of the range is 0% and the top is 100%.
Upper Threshold (%): The percentage level (e.g., 60.0) above which the indicator considers the price position "Bullish" (or "Strong").
Lower Threshold (%): The percentage level (e.g., 40.0) below which the indicator considers the price position "Bearish" (or "Weak").
If the price is between the two (e.g., between 40% and 60%), the signal is Neutral.
Secondary function: These thresholds also control the color of the label next to the price, provided the "Dynamic Label Coloring" option is enabled.

Fib OscillatorWhat is Fib Oscillator and How to Use it?
🔶 1. Conceptual Overview
The Fib Oscillator is a Fibonacci-based relative position oscillator.
Instead of measuring momentum (like RSI or MACD), it measures where price currently sits between the recent swing high and swing low, expressed as a percentage within the Fibonacci range.
In other words:
It answers: “Where is price right now within its most recent dynamic range?”
It visualizes retracement and extension zones numerically, providing continuous feedback between 0% and 100% (and beyond if extended).
🔶 2. What the Script Does
The indicator:
Automatically detects recent high and low levels using an adaptive lookback window, which depends on ATR volatility.
Calculates the current price’s position between those levels as a percentage (0–100).
Plots that percentage as an oscillator — showing visually whether price is near the top, middle, or bottom of its recent range.
Overlays Fibonacci retracement levels (23.6%, 38.2%, 50%, 61.8%, 78.6%) as reference zones.
Generates alerts when the oscillator crosses key Fib thresholds — which can signal retracement completion, breakout potential, or pullback exhaustion.
🔶 3. Technical Flow Breakdown
(a) Inputs
Input Description Default Notes
atrLength ATR period used for volatility estimation 14 Used to dynamically tune lookback sensitivity
minLookback Minimum lookback window (candles) 20 Ensures stability even in low volatility
maxLookback Maximum lookback window 100 Limits over-expansion during high volatility
isInverse Inverts chart orientation false Useful for inverse markets (e.g. shorts or inverse BTC view)
(b) Volatility-Adaptive Lookback
Instead of using a fixed lookback, it calculates:
lookback
=
SMA(ATR,10)
/
SMA(Close,10)
×
500
lookback=SMA(ATR,10)/SMA(Close,10)×500
Then it clamps this between minLookback and maxLookback.
This makes the oscillator:
More reactive during high volatility (shorter lookback)
More stable during calm markets (longer lookback)
Essentially, it self-adjusts to market rhythm — you don’t have to constantly tweak lookback manually.
(c) High-Low Reference Points
It takes the highest and lowest points within the dynamic lookback window.
If isInverse = true, it flips the candle logic (useful if viewing inverse instruments like stablecoin pairs or when analyzing bearish setups invertedly).
(d) Oscillator Core
The main oscillator line:
osc
=
(
close
−
low
)
(
high
−
low
)
×
100
osc=
(high−low)
(close−low)
×100
0% = Price is at the lookback low.
100% = Price is at the lookback high.
50% = Midpoint (balanced).
Between Fibonacci percentages (23.6%, 38.2%, 61.8%, etc.), the oscillator indicates retracement stages.
(e) Fibonacci Levels as Reference
It overlays horizontal reference lines at:
0%, 23.6%, 38.2%, 50%, 61.8%, 78.6%, 100%
These act as support/resistance bands in oscillator space.
You can read it similar to how traders use Fibonacci retracements on charts, but compressed into a single line oscillator.
(f) Alerts
The script includes built-in alert conditions for crossovers at each major Fibonacci level.
You can set TradingView alerts such as:
“Oscillator crossed above 61.8%” → possible bullish continuation or breakout.
“Oscillator crossed below 38.2%” → possible pullback or correction starting.
This allows automated monitoring of fib retracement completions without manually drawing fib levels.
🔶 4. How to Use It
🔸 Visual Interpretation
Oscillator Value Zone Market Context
0–23.6% Deep Retracement Potential exhaustion of a down-move / early reversal
23.6–38.2% Shallow retracement zone Possible continuation phase
38.2–50% Mid retracement Neutral or indecisive structure
50–61.8% Key pivot region Common trend resumption zone
61.8–78.6% Late retracement Often “last pullback” area
78.6–100% Near high range Possible overextension / profit-taking
>100% Range breakout New leg formation / expansion
🔸 Practical Application Steps
Load the indicator on your chart (set overlay = false, so it’s below the main price chart).
Observe oscillator position relative to fib bands:
Use it to determine retracement depth.
Combine with structure tools:
Trend lines, swing points, or HTF market structure.
Use crossovers for timing:
Crossing above 61.8% in an uptrend often confirms breakout continuation.
Crossing below 38.2% in a downtrend signals renewed downside momentum.
For range markets, oscillator swings between 23.6% and 78.6% can define accumulation/distribution boundaries.
🔶 5. When to Use It
During Retracements: To gauge how deep the pullback has gone.
During Range Markets: To identify relative overbought/oversold positions.
Before Breakouts: Crossovers of 61.8% or 78.6% often precede impulsive moves.
In Multi-Timeframe Contexts:
LTF (15M–1H): Detect intraday retracement exhaustion.
HTF (4H–1D): Confirm major range expansions or key reversal zones.
🔶 6. Ideal Companion Indicators
The Fib Oscillator works best when contextualized with structure, volatility, and trend bias indicators.
Below are optimal pairings:
Companion Indicator Purpose Integration Insight
Market Structure MTF Tool Identify active trend direction Use Fib Oscillator only in trend direction for cleaner signals
EMA Ribbon / Supertrend Trend confirmation Align oscillator crossovers with EMA bias
ATR Bands / Volatility Envelope Validate breakout strength If oscillator >78.6% & ATR rising → valid breakout
Volume Oscillator Confirm retracement strength Volume contraction + oscillator under 38.2% → potential reversal
HTF Fib Retracement Tool Combine LTF oscillator with HTF fib confluence Powerful multi-timeframe setups
RSI or Stochastic Measure momentum relative to position RSI divergence while oscillator near 78.6% → exhaustion clue
🔶 7. Understanding the Settings
Setting Function Practical Impact
ATR Period (14) Controls volatility sampling Higher = smoother lookback adaptation
Min Lookback (20) Smallest window allowed Lower = more reactive but noisier
Max Lookback (100) Largest window allowed Higher = smoother but slower to react
Inverse Candle Chart Flips oscillator vertically Useful when analyzing bearish or inverse scenarios (e.g. short-side fib mapping)
Recommended Configs:
For scalping/intraday: ATR 10–14, lookback 20–50
For swing/position trading: ATR 14–21, lookback 50–100
🔶 8. Example Trade Logic (Practical Use)
Scenario: Uptrend on 4H chart
Oscillator drops to below 38.2% → retracement zone
Price consolidates → oscillator stabilizes
Oscillator crosses above 50% → pullback ending
Entry: Long when oscillator crosses above 61.8%
Exit: Near 78.6–100% zone or upon divergence with RSI
For Short Bias (Inverse Setup):
Enable isInverse = true to visually flip the oscillator (so lows become highs).
Use the same thresholds inversely.
🔶 9. Strengths & Limitations
✅ Strengths
Dynamic, self-adapting to volatility
Quantifies Fib retracement as a continuous function
Compact oscillator view (no clutter on chart)
Works well across all timeframes
Compatible with both trending and ranging markets
⚠️ Limitations
Doesn’t define trend direction — must be used with structure filters
Can whipsaw during choppy consolidations
The “lookback auto-adjust” may lag in sudden volatility shifts
Shouldn’t be used standalone for entries without structural confluence
🔶 10. Summary
The “Fib Oscillator” is a dynamic Fibonacci-relative positioning tool that merges retracement theory with adaptive volatility logic.
It gives traders an intuitive, quantified view of where price sits within its recent fib range, allowing anticipation of pullbacks, reversals, or breakout momentum.
Think of it as a "Fibonacci RSI", but instead of momentum strength, it shows positional depth — the vibrational location of price within its natural swing cycle.

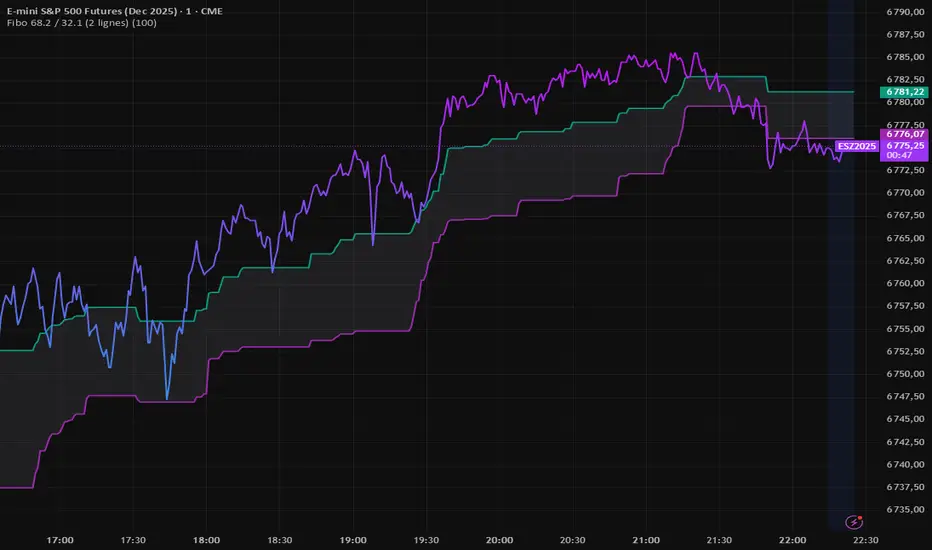
Fibo 68.2 / 32.1 (2 lignes)FIBO indicator that automatically plots two retracement lines (38.2 and 61.8).
Metallic Retracement ToolI made a version of the Metallic Retracement script where instead of using automatic zig-zag detection, you get to place the points manually. When you add it to the chart, it prompts you to click on two points. These two points become your swing range, and the indicator calculates all the metallic retracement levels from there and plots them on your chart. You can drag the points around afterwards to adjust the range, or just add the indicator to the chart again to place a completely new set of points.
The mathematical foundation is identical to the original Metallic Retracement indicator. You're still working with metallic means, which are the sequence of constants that generalize the golden ratio through the equation x² = kx + 1. When k equals 1, you get the golden ratio. When k equals 2, you get silver. Bronze is 3, and so on forever. Each metallic number generates its own set of retracement ratios by raising alpha to various negative powers, where alpha equals (k + sqrt(k² + 4)) / 2. The script algorithmically calculates these levels instead of hardcoding them, which means you can pick any metallic number you want and instantly get its complete retracement sequence.
What's different here is the control. Automatic zig-zag detection is useful when you want the indicator to find swings for you, but sometimes you have a specific price range in mind that doesn't line up with what the zig-zag algorithm considers significant. Maybe you're analyzing a move that's still developing and hasn't triggered the zig-zag's reversal thresholds yet. Maybe you want to measure retracements from an arbitrary high to an arbitrary low that happened weeks apart with tons of noise in between. Manual placement lets you define exactly which two points matter for your analysis without fighting with sensitivity settings or waiting for confirmation.
The interactive placement system uses TradingView's built-in drawing tools, so clicking the two points feels natural and works the same way as drawing a trendline or fibonacci retracement. First click sets your starting point, second click sets your ending point, and the indicator immediately calculates the range and draws all the metallic levels extending from whichever point you chose as the origin. If you picked a swing low and then a swing high, you get retracement levels projecting upward. If you went from high to low, they project downward.
Moving the points after placement is as simple as grabbing one of them and dragging it to a new location. The retracement levels recalculate in real-time as you move the anchor points, which makes it easy to experiment with different range definitions and see how the levels shift. This is particularly useful when you're trying to figure out which swing points produce retracement levels that line up with other technical features like previous support or resistance zones. You can slide the points around until you find a configuration that makes sense for your analysis.
Adding the indicator to the chart multiple times lets you compare different metallic means on the same price range, or analyze multiple ranges simultaneously with different metallic numbers. You could have golden ratio retracements on one major swing and silver ratio retracements on a smaller correction within that swing. Since each instance of the indicator is independent, you can mix and match metallic numbers and ranges however you want without one interfering with the other.
The settings work the same way as the original script. You select which metallic number to use, control how many power ratios to display above and below the 1.0 level, and adjust how many complete retracement cycles you want drawn. The levels extend from your manually placed swing points just like they would from automatically detected pivots, showing you where price might react based on whichever metallic mean you've selected.
What this version emphasizes is that retracement analysis is subjective in terms of which swing points you consider significant. Automatic detection algorithms make assumptions about what constitutes a meaningful reversal, but those assumptions don't always match your interpretation of the price action. By giving you manual control over point placement, this tool lets you apply metallic retracement concepts to exactly the price ranges you care about, without requiring those ranges to fit someone else's definition of a valid swing. You define the context, the indicator provides the mathematical framework.

HTF Fibonacci on intraday ChartThis indicator plots Higher Timeframe (HTF) Fibonacci retracement levels directly on your intraday chart, allowing you to visualize how the current price action reacts to key retracement zones derived from the higher timeframe trend.
Concept
Fibonacci retracement levels are powerful tools used to identify potential support and resistance zones within a price trend.
However, these levels are often calculated on a higher timeframe (like Daily or Weekly), while most traders execute entries on lower timeframes (like 15m, 30m, or 1H).
This indicator bridges that gap — it projects the higher timeframe’s Fibonacci levels onto your current intraday chart, helping you see where institutional reactions or swing pivots might occur in real time.
How It Works
Select the Higher Timeframe (HTF)
You can choose which higher timeframe the Fibonacci structure is derived from — default is Daily.
Define the Lookback Period
The script looks back over the chosen number of bars on the higher timeframe to find the highest high and lowest low — the base for Fibonacci calculations.
Plots Key Fibonacci Levels Automatically:
0% (Low)
23.6%
38.2%
50.0%
61.8%
78.6%
100% (High)
Dynamic Labels
Each Fibonacci level is labelled on the latest bar, updating in real time as new data forms on the higher timeframe.
Best Used For
Intraday traders who want to align lower-timeframe entries with higher-timeframe structure.
Swing traders confirming price reactions around major Fibonacci retracement zones.
Contextual analysis for pullback entries, breakout confirmations, or retests of key levels.
Recommended Settings
Higher Timeframe: Daily (for intraday analysis)
Lookback: 50 bars (adjust based on volatility)
Combine with MACD, RSI, CPR, or Pivots for confluence.
License & Credits
Created and published for educational and analytical purposes.
Inspired by standard Fibonacci analysis practices.

Metallic Retracement LevelsThere's something that's always bothered me about how traders use Fibonacci retracements. Everyone treats the golden ratio like it's the only game in town, but mathematically speaking, it's completely arbitrary. The golden ratio is just the first member of an infinite family of metallic means, and there's no particular reason why 1.618 should be special for markets when we have the silver ratio at 2.414, the bronze ratio at 3.303, and literally every other metallic mean extending to infinity. We just picked one and decided it was magical.
The metallic means are a sequence of mathematical constants that generalize the golden ratio. They're defined by the equation x² = kx + 1, where k is any positive integer. When k equals 1, you get the golden ratio. When k equals 2, you get the silver ratio. When k equals 3, you get bronze, and so on forever. Each metallic mean generates its own set of ratios through successive powers, just like how the golden ratio gives you 0.618, 0.382, 0.236 and so forth. The silver ratio produces a completely different set of retracement levels, as does bronze, as does any arbitrary metallic number you want to choose.
This indicator calculates these metallic means using the standard alpha and beta formulas. For any metallic number k, alpha equals (k + sqrt(k² + 4)) / 2, and we generate retracement ratios by raising alpha to various negative powers. The script algorithmically generates these levels instead of hardcoding them, which is how it should have been done from the start. It's genuinely silly that most fib tools just hardcode the ratios when the math to generate them is straightforward. Even worse, traditional fib retracements use 0.5 as a level, which isn't even a fibonacci ratio. It's just thrown in there because it seems like it should be important.
The indicator works by first detecting swing points using the Sylvain Zig-Zag . The zig-zag identifies significant price swings by combining percentage change with ATR adjustments, filtering out noise and connecting major pivot points. This is what drives the retracement levels. Once a new swing is confirmed, the script calculates the range between the last two pivot points and generates metallic retracement levels from the most recent swing low or high.
You can adjust which metallic number to use (golden, silver, bronze, or any positive integer), control how many power ratios to display above and below the 1.0 level, and set how many complete retracement cycles you want drawn. The levels extend from the swing point and show you where price might react based on whichever metallic mean you've selected. The zig-zag settings let you tune the sensitivity of swing detection through ATR period, ATR multiplier, percentage reversal, and additional absolute or tick-based reversal values.
What this really demonstrates is that retracement analysis is more flexible than most traders realize. There's no mathematical law that says markets must respect the golden ratio over any other metallic mean. They're all valid mathematical constructs with the same kind of recursive properties. By making this tool, I wanted to highlight that using fibonacci retracements involves an arbitrary choice, and maybe that choice should be more deliberate or at least tested against alternatives. You can experiment with different metallic numbers and see which ones seem to work better for your particular market or timeframe, or just use this to understand that the standard fib levels everyone uses aren't as fundamental as they appear.

VWAP + Multi-Condition RSI Signals + FibonacciPlatform / System
Platform: TradingView
Language: Pine Script® v6
Purpose: This script is an overlay indicator for technical analysis on charts. It combines multiple tools: VWAP, RSI signals, and Fibonacci levels.
1️⃣ VWAP (Volume Weighted Average Price)
What it does:
Plots the VWAP line on the chart, which is a weighted average price based on volume.
Can be anchored to different periods: Session, Week, Month, Quarter, Year, Decade, Century, or corporate events like Earnings, Dividends, Splits.
Optionally plots bands above and below VWAP based on standard deviation or a percentage.
Supports up to 3 bands with customizable multipliers.
Will not display if the timeframe is daily or higher and the hideonDWM option is enabled.
Visual on chart: A main VWAP line with optional shaded bands.
2️⃣ RSI (Relative Strength Index) Signals
What it does:
Calculates RSI with a configurable period.
Identifies overbought and oversold zones using user-defined levels.
Generates buy/sell signals based on:
RSI crossing above oversold → Buy
RSI crossing below overbought → Sell
Detects strong signals using divergences:
Bullish divergence: Price makes lower low, RSI makes higher low → Strong Buy
Bearish divergence: Price makes higher high, RSI makes lower high → Strong Sell
Optional momentum signals when RSI crosses 50 after recent overbought/oversold conditions.
Visual on chart:
Triangles for buy/sell
Different color triangles/circles for strong and momentum signals
Background shading in RSI overbought/oversold zones
Alerts: The script can trigger alerts when any of these signals occur.
3️⃣ Fibonacci Levels
What it does:
Calculates Fibonacci retracement and extension levels based on the highest high and lowest low over a configurable lookback period.
Plots standard Fibonacci levels: 0.146, 0.236, 0.382, 0.5, 0.618, 0.786, 1.0
Plots extension levels: 1.272, 1.618, 2.0, 2.618
Helps identify potential support/resistance zones.
Visual on chart: Horizontal lines at each Fibonacci level, shaded with different transparencies.
Summary
This script is essentially a multi-tool trading indicator that combines:
VWAP with dynamic bands for trend analysis and price positioning
RSI signals with divergences for entry/exit points
Fibonacci retracement and extension levels for support/resistance
It is interactive and visual, providing both chart overlays and alert functionality for active trading strategies.
This code is provided for training and educational purposes only. It is not financial advice and should not be used for live trading without proper testing and professional guidance.

MACD cu RSI 7 Fibonacci color levelsMACD with RSI info
The RSI is display as value with changing color as Fibonacci levels.
Trend Fib Zone Bounce (TFZB) [KedArc Quant]Description:
Trend Fib Zone Bounce (TFZB) trades with the latest confirmed Supply/Demand zone using a single, configurable Fib pullback (0.3/0.5/0.6). Trade only in the direction of the most recent zone and use a single, configurable fib level for pullback entries.
• Detects market structure via confirmed swing highs/lows using a rolling window.
• Draws Supply/Demand zones (bearish/bullish rectangles) from the latest MSS (CHOCH or BOS) event.
• Computes intra zone Fib guide rails and keeps them extended in real time.
• Triggers BUY only inside bullish zones and SELL only inside bearish zones when price touches the selected fib and closes back beyond it (bounce confirmation).
• Optional labels print BULL/BEAR + fib next to the triangle markers.
What it does
Finds structure using confirmed swing highs/lows (you choose the confirmation length).
Builds the latest zone (bullish = demand, bearish = supply) after a CHOCH/BOS event.
Draws intra-zone “guide rails” (Fib lines) and extends them live.
Signals only with the trend of that zone:
BUY inside a bullish zone when price tags the selected Fib and closes back above it.
SELL inside a bearish zone when price tags the selected Fib and closes back below it.
Optional labels print BULL/BEAR + Fib next to triangles for quick context
Why this is different
Most “zone + fib + signal” tools bolt together several indicators, or fire counter-trend signals because they don’t fully respect structure. TFZB is intentionally minimal:
Single bias source: the latest confirmed zone defines direction; nothing else overrides it.
Single entry rule: one Fib bounce (0.3/0.5/0.6 selectable) inside that zone—no counter-trend trades by design.
Clean visuals: you can show only the most recent zone, clamp overlap, and keep just the rails that matter.
Deterministic & transparent: every plot/label comes from the code you see—no external series or hidden smoothing
How it helps traders
Cuts decision noise: you always know the bias and the only entry that matters right now.
Forces discipline: if price isn’t inside the active zone, you don’t trade.
Adapts to volatility: pick 0.3 in strong trends, 0.5 as the default, 0.6 in chop.
Non-repainting zones: swings are confirmed after Structure Length bars, then used to build zones that extend forward (they don’t “teleport” later)
How it works (details)
*Structure confirmation
A swing high/low is only confirmed after Structure Length bars have elapsed; the dot is plotted back on the original bar using offset. Expect a confirmation delay of about Structure Length × timeframe.
*Zone creation
After a CHOCH/BOS (momentum shift / break of prior swing), TFZB draws the new Supply/Demand zone from the swing anchors and sets it active.
*Fib guide rails
Inside the active zone TFZB projects up to five Fib lines (defaults: 0.3 / 0.5 / 0.7) and extends them as time passes.
*Entry logic (with-trend only)
BUY: bar’s low ≤ fib and close > fib inside a bullish zone.
SELL: bar’s high ≥ fib and close < fib inside a bearish zone.
*Optionally restrict to one signal per zone to avoid over-trading.
(Optional) Aggressive confirm-bar entry
When do the swing dots print?
* The code confirms a swing only after `structureLen` bars have elapsed since that candidate high/low.
* On a 5-min chart with `structureLen = 10`, that’s about 50 minutes later.
* When the swing confirms, the script plots the dot back on the original bar (via `offset = -structureLen`). So you *see* the dot on the old bar, but it only appears on the chart once the confirming bar arrives.
> Practical takeaway: expect swing markers to appear roughly `structureLen × timeframe` later. Zones and signals are built from those confirmed swings.
Best timeframe for this Indicator
Use the timeframe that matches your holding period and the noise level of the instrument:
* Intraday :
* 5m or 15m are the sweet spots.
* Suggested `structureLen`:
* 5m: 10–14 (confirmation delay \~50–70 min)
* 15m: 8–10 (confirmation delay \~2–2.5 hours)
* Keep Entry Fib at 0.5 to start; try 0.3 in strong trends, 0.6 in chop.
* Tip: avoid the first 10–15 minutes after the open; let the initial volatility set the early structure.
* Swing/overnight:
* 1h or 4h.
* `structureLen`:
* 1h: 6–10 (6–10 hours confirmation)
* 4h: 5–8 (20–32 hours confirmation)
* 1m scalping: not recommended here—the confirmation lag relative to the noise makes zones less reliable.
Inputs (all groups)
Structure
• Show Swing Points (structureTog)
o Plots small dots on the bar where a swing point is confirmed (offset back by Structure Length).
• Structure Length (structureLen)
o Lookback used to confirm swing highs/lows and determine local structure. Higher = fewer, stronger swings; lower = more reactive.
Zones
• Show Last (zoneDispNum)
o Maximum number of zones kept on the chart when Display All Zones is off.
• Display All Zones (dispAll)
o If on, ignores Show Last and keeps all zones/levels.
• Zone Display (zoneFilter): Bullish Only / Bearish Only / Both
o Filters which zone types are drawn and eligible for signals.
• Clean Up Level Overlap (noOverlap)
o Prevents fib lines from overlapping when a new zone starts near the previous one (clamps line start/end times for readability).
Fib Levels
Each row controls whether a fib is drawn and how it looks:
• Toggle (f1Tog…f5Tog): Show/hide a given fib line.
• Level (f1Lvl…f5Lvl): Numeric ratio in . Defaults active: 0.3, 0.5, 0.7 (0 and 1 off by default).
• Line Style (f1Style…f5Style): Solid / Dashed / Dotted.
• Bull/Bear Colors (f#BullColor, f#BearColor): Per-fib color in bullish vs bearish zones.
Style
• Structure Color: Dot color for confirmed swing points.
• Bullish Zone Color / Bearish Zone Color: Rectangle fills (transparent by default).
Signals
• Entry Fib for Signals (entryFibSel): Choose 0.3, 0.5 (default), or 0.6 as the trigger line.
• Show Buy/Sell Signals (showSignals): Toggles triangle markers on/off.
• One Signal Per Zone (oneSignalPerZone): If on, suppresses additional entries within the same zone after the first trigger.
• Show Signal Text Labels (Bull/Bear + Fib) (showSignalLabels): Adds a small label next to each triangle showing zone bias and the fib used (e.g., BULL 0.5 or BEAR 0.3).
How TFZB decides signals
With trend only:
• BUY
1. Latest active zone is bullish.
2. Current bar’s close is inside the zone (between top and bottom).
3. The bar’s low ≤ selected fib and it closes > selected fib (bounce).
• SELL
1. Latest active zone is bearish.
2. Current bar’s close is inside the zone.
3. The bar’s high ≥ selected fib and it closes < selected fib.
Markers & labels
• BUY: triangle up below the bar; optional label “BULL 0.x” above it.
• SELL: triangle down above the bar; optional label “BEAR 0.x” below it.
Right-Panel Swing Log (Table)
What it is
A compact, auto-updating log of the most recent Swing High/Low events, printed in the top-right of the chart.
It helps you see when a pivot formed, when it was confirmed, and at what price—so you know the earliest bar a zone-based signal could have appeared.
Columns
Type – Swing High or Swing Low.
Date – Calendar date of the swing bar (follows the chart’s timezone).
Swing @ – Time of the original swing bar (where the dot is drawn).
Confirm @ – Time of the bar that confirmed that swing (≈ Structure Length × timeframe after the swing). This is also the earliest moment a new zone/entry can be considered.
Price – The swing price (high for SH, low for SL).
Why it’s useful
Clarity on repaint/confirmation: shows the natural delay between a swing forming and being usable—no guessing.
Planning & journaling: quick reference of today’s pivots and prices for notes/backtesting.
Scanning intraday: glance to see if you already have a confirmed zone (and therefore valid fib-bounce entries), or if you’re still waiting.
Context for signals: if a fib-bounce triangle appears before the time listed in Confirm @, it’s not a valid trade (you were too early).
Settings (Inputs → Logging)
Log swing times / Show table – turn the table on/off.
Rows to keep – how many recent entries to display.
Show labels on swing bar – optional tags on the chart (“Swing High 11:45”, “Confirm SH 14:15”) that match the table.
Recommended defaults
• Structure Length: 10–20 for intraday; 20–40 for swing.
• Entry Fib for Signals: 0.5 to start; try 0.3 in stronger trends and 0.6 in choppier markets.
• One Signal Per Zone: ON (prevents over trading).
• Zone Display: Both.
• Fib Lines: Keep 0.3/0.5/0.7 on; turn on 0 and 1 only if you need anchors.
Alerts
Two alert conditions are available:
• BUY signal – fires when a with trend bullish bounce at the selected fib occurs inside a bullish zone.
• SELL signal – fires when a with trend bearish bounce at the selected fib occurs inside a bearish zone.
Create alerts from the chart’s Alerts panel and select the desired condition. Use Once Per Bar Close to avoid intrabar flicker.
Notes & tips
• Swing dots are confirmed only after Structure Length bars, so they plot back in time; zones built from these confirmed swings do not repaint (though they extend as new bars form).
• If you don’t see a BUY where you expect one, check: (1) Is the active zone bullish? (2) Did the candle’s low actually pierce the selected fib and close above it? (3) Is One Signal Per Zone suppressing a second entry?
• You can hide visual clutter by reducing Show Last to 1–3 while keeping Display All Zones off.
Glossary
• CHOCH (Change of Character): A shift where price breaks beyond the last opposite swing while local momentum flips.
• BOS (Break of Structure): A cleaner break beyond the prior swing level in the current momentum direction.
• MSS: Either CHOCH or BOS – any event that spawns a new zone.
Extension ideas (optional)
• Add fib extensions (1.272 / 1.618) for target lines.
• Zone quality score using ATR normalization to filter weak impulses.
• HTF filter to only accept zones aligned with a higher timeframe trend.
⚠️ Disclaimer This script is provided for educational purposes only.
Past performance does not guarantee future results.
Trading involves risk, and users should exercise caution and use proper risk management when applying this strategy.

Fibonacci Ret/Ext ProFibonacci Ret/Ext Pro - Advanced Fibonacci Retracement & Extension Tool
Transform your technical analysis with this professional-grade Fibonacci indicator that automatically detects market structure and draws precise retracement and extension levels.
Key Features:
🎯 Smart Market Structure Detection
Automatic pivot high/low identification with customizable periods
CHoCH (Change of Character) visualization
Real-time swing tracking with intelligent structure recognition
Bullish/bearish market structure highlighting
📊 Comprehensive Fibonacci Levels
Standard levels: 0, 23.6%, 38.2%, 50%, 61.8%, 78.6%, 100%
Extension levels: 127.2%, 161.8%
Negative retracement levels: -27.2%, -38.2%, -61.8%, -100%, -161.8%, -200%
Fully customizable level values and colors
⚙️ Advanced Customization
Individual level toggles - show only what you need
Custom colors for each Fibonacci level
Adjustable line widths and styles
Smart label positioning with price display
Golden Zone highlighting (customizable fill areas)
🔄 Dynamic Display Options
Real-time level extension to current bar
Swing line connections between pivots
Automatic level updates on structure changes
Clean chart display - old levels are automatically cleared
📍 Professional Labeling
Configurable label positions (left/right, above/below/on-line)
Multiple size options (tiny to large)
Price values displayed alongside Fibonacci ratios
Clean, professional appearance
How It Works:
The indicator automatically identifies significant swing highs and lows based on your chosen structure period. When market structure changes from bullish to bearish (or vice versa), it instantly calculates and displays Fibonacci levels from the most recent swing points. No manual drawing required - the algorithm handles everything automatically.
Perfect For:
Swing traders identifying key support/resistance levels
Day traders looking for precise entry/exit points
Position traders planning long-term entries
Anyone seeking professional Fibonacci analysis without manual plotting
Settings Presets:
Short (8 bars) - For intraday/scalping
Medium (21 bars) - For swing trading
Long (55 bars) - For position trading
Custom - Define your own structure period
This indicator provides clean, professional Fibonacci analysis that updates automatically as market structure evolves. No more manual Fibonacci drawing - let the algorithm identify the key levels for you.
Want to take your trading to the next level?
This Fibonacci tool is just one component of a complete trading system. For the full professional experience, check out my Optimus Indicator - a comprehensive full-stack trading system that includes:
Multi-timeframe trend analysis
Advanced buy/sell signals with filtering
Win/loss tracking and statistics
Stop loss management
Real-time alerts and notifications
And much more...
The Optimus Indicator provides everything a serious trader needs in one integrated platform. If you're ready for professional-grade trading tools, reach out privately for access to the complete system.
Disclaimer: This indicator is for educational and informational purposes only. Past performance does not guarantee future results. Always use proper risk management and never risk more than you can afford to lose.

Dynamic EMA Stack Support & ResistanceEvery trader needs reliable support and resistance — but static zones and lagging indicators won't cut it in fast-moving markets. This script combines a Fibonacci-based 5-EMA stacking system and left/right pivots that create dynamic support & resistance logic to uncover real-time structural shifts & momentum zones that actually adapt to price action. This isn’t just a mashup — it’s a complete built-from-the-ground-up support & resistance engine designed for scalpers, intraday traders, and trend followers alike.
🧠 🧠 🧠What It Does🧠 🧠 🧠
This script uses two powerful engines working in sync:
1️⃣ EMA Stack (5-EMA Framework)
Built on Fibonacci-based lengths: 5, 8, 13, 21, 34, (configurable) this stack identifies:
🔹 Bullish Stack: EMAs aligned from fastest to slowest (uptrend confirmation)
🔹 Bearish Stack: EMAs aligned inversely (downtrend confirmation)
🟡 Narrowing Zones: When EMAs compress within ATR thresholds → possible breakout or reversal zone
🎯 Labels identify key transitions like:
✅"Begin Bear Trend?"
✅"Uptrend SPRT"
✅"RES?" (resistance test)
2️⃣ Pivot-Based Projection Engine
Using classic Left/Right Bar pivot logic, the script:
📌 Detects early-stage swing highs/lows before full confirmation
📈 Projects horizontal S/R lines that adapt to market structure
🔁 Keeps lines active until a new pivot replaces them
🧩 Syncs beautifully with EMA stack for confluence zones
🎯🎯🎯Key Features for Traders🎯🎯🎯
✅ Trend Detection
→ EMA order reveals real-time bias (bullish, bearish, compression)
✅ Dynamic S/R Zones
→ Historical support/resistance levels auto-draw and extend
✅ Smart Labeling
→ “SPRT”, “RES”, and “Trend?” labels for live context + testing logic
✅ Custom Candle Coloring
→ Choose from Bar Color or Full Candle Overlay modes
✅ Scalper & Swing Compatible
→ Use fast confirmations for scalping or stack consistency for longer trends
⚙️⚙️⚙️How to Use⚙️⚙️⚙️
✅Use Top/Bottom (trend state) Line Colors to quickly read trend conditions.
✅Use Pivot-based support/resistance projections to anticipate where price might pause or reverse.
✅Watch for yellow/blue zones to prepare for volatility shifts/reversals.
✅Combine with volume or momentum indicators for added confirmation.
📐📐📐Customization Options📐📐📐
✅EMA lengths (5, 8, 13, 21, 34) — fully configurable - try 21,34,55, 89, 144 for longer term trend states
✅Left/Right bar pivot settings (default: 21/5)
✅Label size, visibility, and color themes
✅Toggle line and label visibility for clean layouts
✅“Max Bars Back” to control how deep history is scanned safely
🛠🛠🛠Built-In Safeguards🛠🛠🛠
✅ATR-based filters to stabilize compression logic
✅Guarded lookback (max_bars_back) to avoid runtime errors
✅Works on any asset, any timeframe
🏁🏁🏁Final Word🏁🏁🏁
This script is not just a visual tool, it’s a complete trend and structure framework. Whether you're looking for clean trend alignment, dynamic support/resistance, or early warning labels, this system is tuned to help you react with confidence — not hindsight.
Rembember, no single indicator should be used in isolation. For best results, combine it with price action analysis, higher-timeframe context, and complementary tools like trendlines, moving averages etc Use it as part of a well-rounded trading approach to confirm setups — not to define them alone.
💡💡💡Turn logic into clarity. Structure into trades. And uncertainty into confidence.💡💡💡

Argentum Flag [AGP] Ver.2.5Central Purpose and Concept
The Argentum Flag script is a multifunctional tool that integrates and visualizes multiple key indicators to provide a detailed and unified perspective of the market. The core concept is to analyze price from different angles—volatility, volume, and momentum—to identify confluences and patterns that may be difficult to see with separate indicators. This "mashup" is not a simple fusion of indicators, but a strategic combination of tools that complement each other to offer a comprehensive view of asset behavior.
Components and Their Functionality
This script combines and visualizes the following elements:
EMA Percentage Bands (EMA Bands):
Uses an Exponential Moving Average (EMA) as a baseline.
Calculates and draws several volatility bands that deviate from the central EMA by fixed percentages (0.47%, 0.94%, 2.36%). These bands are inspired by Fibonacci ratios and the cyclical nature of the market.
The bands are colored with a dynamic gradient that reflects the current state of volatility.
Utility: These bands act as dynamic support and resistance areas. The price entering or exiting these zones can indicate a change in volatility or a possible exhaustion of the movement.
Volatility Signals (Vortex & Prime Signals):
The script generates visual signals when the price stays outside the volatility bands for a specific number of bars.
Vortex Signals (diamond ⍲): Appear when the price crosses and stays outside the Prime bands, suggesting a high volatility or a possible continuation of the trend.
Exit/Entry Signals (circle ⌾): Are activated when the price stays outside the Vortex bands, indicating an extreme extension of volatility. These can be interpreted as potential reversal or profit-taking zones.
Utility: They help traders quickly identify moments of high and low volatility and potential turning points in price action.
Volume Analysis (Volume Bar Colors):
The script changes the color of the bars based on the relationship between the current volume and the average volume over a 50-bar period.
Utility: This feature allows the trader to immediately visualize the strength behind a price movement. For example, a bullish candle with "extreme" volume suggests strong buying interest, while a bearish candle with "low" volume could indicate a weak correction.
Summary Tables (Dashboard):
EMA-Fibo Table: Displays the values of 12 EMAs based on the Fibonacci sequence (5, 8, 13, 21...) in an easy-to-access table. The background color of each value indicates if the current price is above (bullish) or below (bearish) that EMA.
Multi-Timeframe RSI Table: Displays the Relative Strength Index (RSI) values across multiple timeframes (from 1 minute to monthly). The text color changes to highlight if the RSI is in overbought (orange) or oversold (white) areas, according to the established levels.
Utility: These tables condense a large amount of data into a simple format, allowing traders to perform a quick, multi-timeframe market analysis without constantly switching charts.
How to Use the Script
This script is a contextual analysis tool that works best when its different components are combined. It is not a "buy and sell signal" system on its own, but a tool for informed decision-making.
Trend Identification: Use the EMA table to see the general trend direction across different timeframes. A price above most of the EMAs in the table suggests a bullish bias.
Volatility Reading: Observe the EMA bands. If the price stays within the bands, volatility is low. A strong move that breaks out of the bands, accompanied by an "extreme" volume color (blue), suggests strong momentum that could continue.
Momentum Analysis: Use the RSI table to confirm movements. An overbought 15m RSI could support a reversal signal from the Vortex bands, while a 1D RSI in a neutral zone may indicate that the main trend has not changed.
Signal Confirmation: Visual signals (diamond and circle) should not be used in isolation. They must be confirmed by volume analysis and dashboard readings. For example, an "Exit Signal" (circle) with low volume may be less reliable than one with high volume and a clear reversal candle.
Disclaimer
This script is for informational and educational purposes only. It is not financial advice, nor is it a recommendation to buy or sell any financial instrument. All trading involves risk, and past performance is not indicative of future results. The user is solely responsible for their own trading decisions.

Sentinel Nexus Dashboard [AGP] Ver.1.5Sentinel Nexus Dashboard is a versatile Pine Script designed as a comprehensive technical analysis tool. It condenses a variety of key indicators and metrics into a single, intuitive visual dashboard, providing an integrated view of market trends, momentum, volatility, and liquidity, all neatly organized on your TradingView chart.
Key Features and Benefits
All-in-One Dashboard: This script centralizes relevant information, offering a clean, efficient control panel that helps you make quick decisions without cluttering your chart with multiple overlays.
Trend Analysis with ADX: It incorporates the Average Directional Index (ADX) to measure trend strength. The dashboard displays ADX, DI+, and DI- values with dynamic color-coding to highlight trend intensity (e.g., blue for a very strong trend).
Momentum Analysis with MACD: The dashboard shows MACD line and signal line values in a table. The background color of the MACD values reflects the histogram's direction, allowing you to quickly identify crosses and shifts in market momentum.
Multi-Timeframe RSI Analysis: The RSI (Relative Strength Index) dashboard displays values across multiple timeframes (from 1 minute to 1 month). Overbought (77) and oversold (23) levels are color-coded for immediate identification of market conditions, making it an ideal tool for multi-timeframe analysis.
Smart and Dynamic Volume: The script uses a bar coloring algorithm based on average volume. Chart bars change color according to volume magnitude (extreme, high, average, or low) relative to the average, distinguishing between bullish and bearish bars. This helps you identify significant, liquidity-driven price movements.
Fair Value Analysis: The script calculates an asset's "fair value" using a noise filter (similar to a Kalman filter) on recent highs and lows to determine a midpoint. The price dashboard's background color changes to indicate if the current price is above or below this fair value.
Fibonacci EMA Analysis: A table displays several Exponential Moving Averages (EMAs) based on the Fibonacci sequence. The values are color-coded to show whether the current price is above (white) or below (orange) each EMA, helping you quickly identify dynamic support and resistance levels.
CME Futures Data Integration: For Bitcoin, the script can show a chart label with the Bitcoin futures price (CME:BTC1!), allowing you to compare the spot price with the CME futures market.
Potential Uses and Applications
The Sentinel Nexus Dashboard is an excellent support tool for trading. It is not a signal system but rather a suite of confirmation tools that can be used to:
Confirm Trend Strength: Before entering a trade, use the ADX data to ensure the trend has enough strength for your expected move.
Detect Reversal Points: Multi-timeframe RSI data can alert you to potential overbought or oversold conditions, indicating possible exhaustion of a price move.
Validate Price Movements: Bar coloring based on volume helps you determine if a price move is genuine and supported by strong market participation. High volume can confirm a breakout or reversal.
Identify Support and Resistance: The Fibonacci EMAs allow you to quickly visualize key levels where price might find support or resistance, aiding in planning entries and exits.
In short, this script is perfect for traders who want a comprehensive market overview without chart clutter. It efficiently integrates trend, momentum, and volume analysis in one place.
Legal Disclaimer
RISK WARNING:
This Pine Script is a technical analysis tool and should not be considered financial advice. Past performance of any indicator is no guarantee of future results. Trading in financial markets involves a high risk of loss and is not suitable for all investors. By using this indicator, you accept full responsibility for your trading decisions and acknowledge that any financial loss is your sole responsibility.
IMPORTANT:
Some script functions, such as the CME price label, may not work correctly if your TradingView subscription plan is not a paid one. Please check your plan's limitations to ensure the indicator's optimal functionality.

Weekly Fibonacci Pivot Levelsthis indicator in simple ways, draw the weekly fibo zones based on calculations
weekly zones are drawn automatically based on previous week, and are updated once a new week is opened
you can use it the way you like or adapt to your trading strategy
i really use it at extremes and when a divergence is occurring in these zones

Fibonacci Momentum CascadeThe Foundation: FMC Indicator:
The Fibonacci Momentum Cascade (FMC) is an AI-enhanced technical indicator that automates Fibonacci analysis, removing the guesswork and doubt that plagues manual drawing. Instead of relying on subjective human input, the FMC uses a proprietary Momentum Cascade Engine™ that constantly analyzes market strength to detect significant shifts in buying and selling pressure. When confirmed, it automatically identifies the most relevant market trend, cascades fresh Fibonacci levels, and grades potential technical setups. It features 100% automated swings, adaptive real-time analysis, and professional setup grading with Primary Setups (▲P / ▼P) for A+ formations and Secondary Setups (▲S / ▼S) for supplementary patterns.
The Adaptive Edge: AI Co-Pilot:
Our AI analyzes multiple data sources including market sentiment, technical patterns, fundamental factors, and news events to generate comprehensive market insights. It also fine-tunes the FMC indicator inputs for today's market, outputting personalized settings optimized for multiple timeframes (1d, 4h, 1h, 15m, 5m) — removing guesswork and maximizing precision for your asset.
The Force Multiplier: The Hub:
The Hub is our community intelligence platform where users share market analyses and insights. When you or others request AI analyses, they become available in The Hub for everyone to access without using credits. This creates a growing library of market insights across all asset classes. You can browse community analyses, discover trending assets, and benefit from the collective wisdom of experienced traders—essentially getting free analyses beyond your monthly credits.
