4 diffs (CB & IBIT Premium)📊 Script Name: 4 diffs (CB & IBIT Premium)
Version: Pine Script® v6
Overlay: Yes (table displayed on chart)
🧠 What it Does:
This script tracks four important Bitcoin price differentials to monitor spot/perpetual/futures price inefficiencies and ETF premium/discounts, and displays them in a live table on the chart. It helps traders identify arbitrage opportunities or institutional pricing signals.
📈 Displayed Metrics:
Coinbase Premium
→ Difference between Coinbase spot and Binance spot prices.
→ Use case: US vs. offshore spot market divergence.
Coinbase Spot vs Binance Perpetual
→ Difference between Coinbase spot and Binance perpetual price.
→ Use case: Spot-perp basis, often used for funding rate insights or market stress.
Bybit vs Binance Perpetual
→ Difference between Bybit perp and Binance perp price.
→ Use case: Compare derivative pricing across major offshore exchanges.
IBIT Premium (CME vs ETF-implied)
→ Compares CME futures price vs. IBIT’s implied spot BTC value
→ IBIT implied BTC = IBIT ETF price ÷ (BTC held / shares outstanding)
→ Use case: Gauge institutional premium/discount and ETF arbitrage clues.
🛠️ Customization:
Text color of the table is adjustable via the input setting.
📌 Visual Output:
A fixed 2×4 table appears in the top-right corner of the chart.
Each row shows a label and the live price difference in USD.
FLOW

Chaikin Money Flow (CMF) [ParadoxAlgo]OVERVIEW
This indicator implements the Chaikin Money Flow oscillator as an overlay on the price chart, designed to help traders identify institutional money flow patterns. The Chaikin Money Flow combines price and volume data to measure the flow of money into and out of a security, making it particularly useful for detecting accumulation and distribution phases.
WHAT IS CHAIKIN MONEY FLOW?
Chaikin Money Flow was developed by Marc Chaikin and measures the amount of Money Flow Volume over a specific period. The indicator oscillates between +1 and -1, where:
Positive values indicate money flowing into the security (accumulation)
Negative values indicate money flowing out of the security (distribution)
Values near zero suggest equilibrium between buying and selling pressure
CALCULATION METHOD
Money Flow Multiplier = ((Close - Low) - (High - Close)) / (High - Low)
Money Flow Volume = Money Flow Multiplier × Volume
CMF = Sum of Money Flow Volume over N periods / Sum of Volume over N periods
KEY FEATURES
Big Money Detection:
Identifies significant institutional activity when CMF exceeds user-defined thresholds
Requires volume confirmation (volume above average) to validate signals
Uses battery icon (🔋) for institutional buying and lightning icon (⚡) for institutional selling
Visual Elements:
Background coloring based on money flow direction
Support and resistance levels calculated using Average True Range
Real-time dashboard showing current CMF value, volume strength, and signal status
Customizable Parameters:
CMF Period: Calculation period for the money flow (default: 20)
Signal Smoothing: EMA smoothing applied to reduce noise (default: 5)
Big Money Threshold: CMF level required to trigger institutional signals (default: 0.15)
Volume Threshold: Volume multiplier required for signal confirmation (default: 1.5x)
INTERPRETATION
Signal Types:
🔋 (Battery): Indicates strong institutional buying when CMF > threshold with high volume
⚡ (Lightning): Indicates strong institutional selling when CMF < -threshold with high volume
Background color: Green tint for positive money flow, red tint for negative money flow
Dashboard Information:
CMF Value: Current Chaikin Money Flow reading
Volume: Current volume as a multiple of 20-period average
Big Money: Status of institutional activity (BUYING/SELLING/QUIET)
Signal: Strength assessment (STRONG/MEDIUM/WEAK)
TRADING APPLICATIONS
Trend Confirmation: Use CMF direction to confirm price trends
Divergence Analysis: Look for divergences between price and money flow
Volume Validation: Confirm breakouts with corresponding money flow
Accumulation/Distribution: Identify phases of institutional activity
PARAMETER RECOMMENDATIONS
Day Trading: CMF Period 14-21, higher sensitivity settings
Swing Trading: CMF Period 20-30, moderate sensitivity
Position Trading: CMF Period 30-50, lower sensitivity for major trends
ALERTS
Optional alert system notifies users when:
Big money buying is detected (CMF above threshold with volume confirmation)
Big money selling is detected (CMF below negative threshold with volume confirmation)
LIMITATIONS
May generate false signals in low-volume conditions
Best used in conjunction with other technical analysis tools
Effectiveness varies across different market conditions and timeframes
EDUCATIONAL PURPOSE
This open-source indicator is provided for educational purposes to help traders understand money flow analysis. It demonstrates the practical application of the Chaikin Money Flow concept with visual enhancements for easier interpretation.
TECHNICAL SPECIFICATIONS
Overlay indicator (displays on price chart)
No repainting - all calculations are based on closed bar data
Suitable for all timeframes and asset classes
Minimal resource usage for optimal performance
DISCLAIMER
This indicator is for educational and informational purposes only. Past performance does not guarantee future results. Always conduct your own analysis and consider risk management before making trading decisions.

VolumeFlowOscillatorLibVolume Flow Oscillator Library
Overview
The Volume Flow Oscillator library provides a comprehensive framework for analyzing directional volume flow in financial markets. It creates a multi-band oscillator system that transforms price and volume data into a spectrum of sensitivity bands, revealing the underlying buying and selling pressure.
Technical Approach
The library combines price direction with trading volume to generate an oscillator that fluctuates around a zero line, with positive values indicating buying pressure and negative values showing selling pressure. Using sophisticated ALMA (Arnaud Legoux Moving Average) smoothing techniques with asymmetric sensitivity, the library creates seven distinct bands that help identify various intensity levels of volume flow.
Key Features
Multi-band oscillator system with seven sensitivity levels
Directional volume flow analysis combining price movement and volume
Zero-line oscillation showing the balance between buying and selling pressure
Asymmetric ALMA smoothing for different sensitivity on positive/negative bands
Customizable lookback periods and multipliers for fine-tuning
Color-coded visualization for intuitive chart reading
Applications
This library offers developers a versatile foundation for creating volume-based indicators that go beyond simple volume measurement to reveal the directional force behind market movements. Ideal for confirming price trends, detecting divergences, identifying volume climaxes, and assessing overall market strength.

Machine Learning: MFI Heat Map [YinYangAlgorithms]Overview:
MFI Heat Maps are a visually appealing way to display the values of 29 different MFIs at the same time while being able to make sense of it. Each plot within the Indicator represents a different MFI value. The higher you get up, the longer the length that was used for this MFI. This Indicator also features the use of Machine Learning to help balance the MFI levels. It doesn’t solely rely upon Machine Learning but instead incorporates a growing length MFI averaged with the Machine Learning MFI at any given index.
For instance, say we are calculating the 10th plot from the bottom, the MFI would be an average of:
MFI(source, 11)
Machine Learning MFI at Index of 10
We do it this way as they both help smooth each other out without relying solely on just one calculation method.
Due to plot limitations, you are capped at 28 Plot Amounts within this indicator, but that is still quite a bit of information you can glean from a Heat Map.
The Machine Learning used in this indicator is of the K-Nearest Neighbor (KNN). It uses a Fast and Slow MFI calculation then sorts through them over Machine Learning Length and calculates the differences between them. It then slices off KNN length to create our Max/Min Distances allotted. It adds the average between Fast and Slow MFIs to a Viable Distances array if their distances are within the KNN Min/Max distance. It then averages all distances in the Viable Distances array and returns the result.
The result of the KNN Function is saved to another ML Data array whose length is that of Plot Amount (Heat Map Size). This way each Index of the ML Data array can be indexed according to the Heat Map Size.
The Average of the ML Data array is the MFI line (white) that you’ll see plotted on the Indicator. There is also the SMA of the MFI Average (orange) which is likewise plotted. These plots allow you to visualize where the ML MFI is sitting and can potentially be useful for seeing when the MFI Average and SMA cross over and under each other.
We’ve heard many people talk highly of RSI, but sadly not too many even refer to MFI. MFI oftentimes may be overlooked, especially with new traders who may not even know what it is. Essentially MFI is an RSI but it also incorporates Volume into its calculations, which in our opinion leads to a more accurate reading; afterall, what is price movement without Volume.
Tutorial:
You may be thinking, this Indicator looks appealing to the eye, but how do I benefit from it trading wise?
Before we get into our visual examples, let's talk briefly about what makes Heat Maps in general a useful tool for trading. Heat Maps give us the ability to visualize and understand lots of data while removing the clutter. We can understand the data of 29 different MFIs without having to look at and decipher 29 different MFI plots. When you overlay too many MFI lines on top of each other, they can be very difficult to read and oftentimes end up actually hindering your Technical Analysis. For this reason, we have a simple solution to this problem; Heat Maps. This MFI Heat Map allows you to easily know (in a relative %) what the MFI level is for varying lengths. For Instance, the First (bottom) plot indexes an MFI of (K(0) (loop of Plot Amount) + Smoothing Length (default 1)) = 1. Since this is indexing (usually) a very low length, it will change much quicker. Whereas the Last (top) plot indexes an MFI of (K(27) (loop of Plot Amount) + Smoothing Length (default 1)) = 28. This is indexing a much higher length of MFI which results in the MFI the higher you go up in the Heat Map to move much slower.
Heat Maps give us the ability to see changes happening over multiple MFIs at the same time, which can be very useful for seeing shifts in MFI / Momentum. Remember, MFI incorporates Volume, so even if the price goes up a lot, if there was low volume, the MFI won’t move as much as an RSI would. However, likewise, if there is high volume but low price movement, the MFI will move slightly more than the RSI.
Heat Maps change color based on their MFI level. If the MFI is >= 90 it is HOT (red), if the MFI <= 9 it is COLD (teal, think of ICE). Green represents an MFI of 50-59 and Dark Blue represents an MFI of 40-49. Green and Dark blue are the most common colors as all the others are more ‘Extreme’ MFI levels.
Okay, time to get to the Examples :
Since there is so much going on in Heat Maps, we’ve decided to focus this tutorial to this specific area and talk about individual locations before talking about it as a whole.
If you refer to the example above where there are 2 white circles; these white circles are highlighting a key location you’ll be wanting to identify within your Heat Maps, many things are happening here:
The MFI crossed over the SMA (bullish).
The Heat Map started changing from mid/dark Blue (30-50 MFI) to Green (50-59 MFI) around the midline (the 50% dashed like).
The Lower levels of the Heat Map are turning Yellow/Orange/Red (60-100 MFI).
The Upper Levels of the Heat Map are still Light Blue - Green (10-50 MFI).
The 4 Key points above, all point towards potential Bullish Momentum changes. You’re likely wondering, but why? Let's discuss about each one in more specific detail:
1. The MFI crossed over the SMA (bullish): What this tells us is that the current MFI Average is now greater than its average over the last (default) 16 bars. This means there's been a large amount of Money Flow (Price and Volume) recently (subjectively based on the last (default) 16 average). This is one of the leading Bullish / Bearish signals you will see within this Indicator. You can enable Signals within the Settings and/or even add Alerts for when these crossings occur.
2. The Heat Map started changing from mid/dark Blue (30-50 MFI) to Green (50-59 MFI) around the midline (the 50% dashed like): This shows us that the index’s in the mid (if using all 28 heat map plots it would be at 14) has already received some of this momentum change. If you look at the second white circle (right), you’ll also notice the higher MFI plot indexes are also green. This is because since their length is long they still have some momentum and strength from the first white circle (left). Just because the first white circle failed in its bullish push, doesn’t mean it didn’t achieve momentum that would later on help to push the price up.
3. The Lower levels of the Heat Map are turning Yellow/Orange/Red (60-100 MFI): It occurred somewhat in the left white circle, but mainly in the right white circle. This shows us the MFI is very high on the lower lengths, this may lead to the current, middle and higher length MFIs following suit soon. Remember it has to work its way up, the higher levels can’t go red unless the lower levels go red first and the higher levels can also lag quite a bit behind and take awhile to catch up, this is normal, expected and meant to happen. Vice versa is also true with getting higher levels to go cold (light teal (think of ICE)).
4. The Upper Levels of the Heat Map are still Light Blue - Green (10-50 MFI): You might think at first that this is a bad thing, but it's not! Remember you want to be Fearful when others are Greedy and Greedy when others are Fearful! You don’t want to buy when the higher levels have a high MFI, you want to buy when you see the momentum pushing up in the lower MFI levels (getting yellow/orange/red in the low levels) while it is still Cold in the higher levels (BLUE OR GREEN, nothing higher than green as it is already slightly too high). There will be many times that it is Yellow or possibly Orange in the high levels and the bullish push still happens, but this is much more risky! The key to trading is to minimize risks while maximizing potential.
Hopefully now you’re getting an idea of how to spot potential bullish momentum changes, but what about bearish momentum changes? Technically they are the exact opposite, so we don’t need to go into as much detail, but lets still take a look at a few examples:
In the example above we marked the 3 times where it was displaying overly bullish characteristics. We marked the bullish momentum occurring with arrows. If you look closely at the start of the arrow to where it finishes, you’ll notice how the heat (HOT)(RED) works its way up from the lower levels to the higher levels. We then see the MFI to SMA cross under. In all 3 of these examples the heat made it all the way to the top of the chart. These are all very bearish signals that represent a bearish momentum movement that may occur soon.
Also, please note, the level the MFI is at DOES matter! That line isn’t there simply for you to see when there are crosses over and under. The MFI is considered to be Overbought when it is greater than 70 (the upper white dashed line, it is just formatted to be on a different scale cause there are 28 plots, but it represents 70). The MFI is considered to be Oversold when it is less than 30 (the lower white dashed line).
If we look to the left a little here where a big drop in price occurred shortly after our MFI and SMA crossed, would we have been able to identify it using the Heat Maps? Likely, No. There was some color change in the lower levels a few bars prior that went yellow/orange/red but before this cross happened they all went back to Dark Blue. In the middle section when the cross happened it was only Green and Yellow and in the upper section we are Blue. This would be a very risky trade to go on as the only real Bearish Indication was the MFI to SMA cross under. Remember, you want to reduce risk, you don’t want to simply trade on everytime the MFI and SMA cross each other or you’ll be getting yourself into many risky trades based on false signals.
Based on what you’ve learned above, can you see the signs that are indicating where this white circle may have potential for a bullish momentum change?
Now that we are more zoomed in, you may also be noticing there are colors to the price bars. This can be disabled in the settings, but just so you know what they mean, let’s zoom in a little more and talk about it.
We’ve condensed the Indicator a bit so you can see the bars better here. The colors that are displayed on these bars are the Heat Map value for your MFI (the white line in the Indicator). This way you can better see when the Price is Hot and Cold. As you may see while looking, the colors generally go from cold to hot when bullish momentum is happening and hot to cold when bearish momentum is happening. We don’t recommend solely looking at the bars as indicators to MFI momentum change, as seeing the Heat Map will give you much more data; however it can be nice to see the Heat Map projected on the bars rather than trying to eyeball it yourself or hover over each bar specifically to see their levels.
We will conclude our Tutorial here. Hopefully this has given you some insight to how useful Heat Maps can be and why it works well with a Machine Learning (KNN) Model applied to the MFI.
PLEASE NOTE: You can adjust the line width for the Heat Map within the settings. If you condense the Indicator a lot or have a small screen, likely use a length of 1-2. If you have it stretched out or a large screen, a length of 2-3 will work nice. You just don’t want to have the lines overlapping or it defeats the purpose of a Heat Map. Also, the bigger the linewidth, generally you’ll want to increase the Transparency within the Settings also as it can get quite bright and hurt your eyes over time.
Settings:
MFI:
Show MFI and SMA Crossing Signals: MFI and SMA Crossing is one of the leading Bullish and Bearish Signals in this Indicator. You can also add alerts for these signals.
Plot Amount: How many plots are used in this Heat Map. (2 - 28).
Source: The Source to use in all MFI calculations.
Smooth Initial MFI Length: How much to smooth the Fast and Slow MFI calculation by. 1 = No smoothing.
MFI SMA Length: What length we smooth the MFI Average over to get our MFI SMA.
Machine Learning:
Average MFI data by adding a lookback to the Source: While populating our Heat Map with the MFI's, should use use the Source each MFI Length increase or should we also lookback a Source each MFI Length Increase.
KNN Distance Requirement: To be a valid KNN, it needs to abide by a Distance calculation. Generally only Max is used, but you can change it if it suits your trading style better.
Machine Learning Length: How much ML data should we store? The longer the length generally the smoother the result; which may not be as accurate for something like a Heat Map, so keeping this relatively low may lead to more accurate results.
KNN Length: How many KNN are used in the slice to calculate max/min distance allowed.
Fast Length: Fast MFI length used in KNN to calculate distances by comparing its distance with the Slow MFI Length.
Slow Length: Slow MFI length used in KNN to calculate distances by comparing its distance with the Fast MFI Length.
Smoothing Length: When populating our Heat Map, at what length do we start our MFI calculations with (A Higher value with result in a slower and more smoothed MFI / Heat Map).
Colors:
Change Bar Color: Change bar colors to MFI Avg Color.
Heat Map Transparency: If there isn't any transparency it can be a little hard on the eyes. The Greater the Line Width, generally the more transparency you'll want for your eyes.
Line Width: Set how wide the Heat Map lines are
MFI 90-100 Color: Color when the MFI is between these levels.
MFI 80-89 Color: Color when the MFI is between these levels.
MFI 70-79 Color: Color when the MFI is between these levels.
MFI 60-69 Color: Color when the MFI is between these levels.
MFI 50-59 Color: Color when the MFI is between these levels.
MFI 40-49 Color: Color when the MFI is between these levels.
MFI 30-39 Color: Color when the MFI is between these levels.
MFI 20-29 Color: Color when the MFI is between these levels.
MFI 10-19 Color: Color when the MFI is between these levels.
MFI 0-100 Color: Color when the MFI is between these levels.
If you have any questions, comments, ideas or concerns please don't hesitate to contact us.
HAPPY TRADING!

EMAFlowLibrary "EMAFlow"
Functions that manipulate a set of 5 MAs created within user-supplied maximum and minimum lengths. The MAs are spaced out (within the range) in a way that approximates how Fibonnaci numbers are spaced.
Using MA flow, as opposed to simple crosses of the minimum and maximum lengths, gives more detail, and can result in faster changes and more resistance to chop, depending how you use it.
f_emaFlowBias()
@function f_emaFlowBias: Gives a bullish or bearish bias reading based on the EMA flow from the user-supplied range.
@param int _min: The minimum length of the EMA set.
@param int _max: The maximum length of the EMA set.
@param: string _source: The source for the EMA set. Must be in standard format (open, close, ohlc4, etc.)
@returns: An integer, representing the bias: 1 is bearish, 2 is slightly bearish, 3 is neutral, 4 is slightly bullish, 5 is bullish.

Equity Bond Currency DashboardDepicts demand-flow between Equities, Bonds and Currencies of 6 countries. Useful in tracking the flow of smart money and checking the dynamics of inter-connected markets.
Principle:
DXY lies at the heart of the diagram with usd-currency pairs of 5 countries connected to it. When demand for a currency increases it strengthens against Dollar. This is depicted by a line from DXY to the currency indicating demand flow from Dollar to the currency (DXY is only an indicative symbol for Dollar, the currency may not be part of the dollar index). Similarly when Dollar strengthens against the currency, demand flow is depicted by a line from the currency to DXY. Currency blocks are connected to Equity and Bond Yields of the respective countries. Equities and Bonds, when bought, takes the demand from the respective currencies and vice versa.
Overall, the demand flows in the direction of arrows. The flow is incomplete without commodities, import/export, interest/inflation rates of countries, however, the diagram most of the times explains why an asset class is performing the way it is.
Left side bar of each block is very similar to OHLC candles except for the following -
Instead of wicks, top and bottom of the bar represents high and low for the selected time-frame
Open and close are normalised for high and low
Bar border is red if close < prev.close, green if close >= prev.close
Other notes:
The diagram requires at least 200 bars in the chart to render. Please select the symbol and time-frame that contain at least 200 bars.
The diagram requires a live market to render the flow. To check flows on historical bars, set the option from settings.
Desired indices could be selected for countries of choice. Default settings point to futures wherever possible to have the markets live simultaneously across the countries.

UFO + Realtime Divergences (UO x MFI)UFO + Realtime Divergences (UO x MFI) + Alerts
The UFO is a hybrid of two powerful oscillators - the Ultimate Oscillator (UO) and the Money Flow Index (MFI)
Features of the UFO include:
- Optional divergence lines drawn directly onto the oscillator in realtime.
- Configurable alerts to notify you when divergences occur, as well as centerline crossovers.
- Configurable lookback periods to fine tune the divergences drawn in order to suit different trading styles and timeframes.
- Background colouring option to indicate when the oscillator has crossed its centerline.
- Alternate timeframe feature allows you to configure the oscillator to use data from a different timeframe than the chart it is loaded on.
- 2x MTF triple-timeframe Stochastic RSI overbought and oversold confluence signals painted at the top of the panel for use as a confluence for reversal entry trades.
The core calculations of the UFO+ combine the factory settings of the Ultimate Oscillator and Money Flow Index, taking an average of their combined values for its output eg:
UO_Value + MFI_Value / 2
The result is a powerful oscillator capable of detecting high quality divergences, including on very low timeframes and highly volatile markets, it benefits from the higher weighting of the most recent price action provided by the Ultimate Oscillators calculations, as well as the calculation of the MFI, which incorporates volume data. The UFO and its incorporated 2x triple-timeframe MTF Stoch RSI overbought and oversold signals makes it well adapted for low timeframe scalping and regular divergence trades in particular.
The Ultimate Oscillator (UO)
Tradingview describes the Ultimate Oscillator as follows:
“The Ultimate Oscillator indicator (UO) is a technical analysis tool used to measure momentum across three varying timeframes. The problem with many momentum oscillators is that after a rapid advance or decline in price, they can form false divergence trading signals. For example, after a rapid rise in price, a bearish divergence signal may present itself, however price continues to rise. The Ultimate Oscillator attempts to correct this by using multiple timeframes in its calculation as opposed to just one timeframe which is what is used in most other momentum oscillators.”
You can read more about the UO and its calculations here
The Money Flow Index ( MFI )
Investopedia describes the True Strength Indicator as follows:
“The Money Flow Index ( MFI ) is a technical oscillator that uses price and volume data for identifying overbought or oversold signals in an asset. It can also be used to spot divergences which warn of a trend change in price. The oscillator moves between 0 and 100. Unlike conventional oscillators such as the Relative Strength Index ( RSI ), the Money Flow Index incorporates both price and volume data, as opposed to just price. For this reason, some analysts call MFI the volume-weighted RSI .”
You can read more about the MFI and its calculations here
The Stochastic RSI (relating to the built-in MTF Stoch RSI feature)
The popular oscillator has been described as follows:
“The Stochastic RSI is an indicator used in technical analysis that ranges between zero and one (or zero and 100 on some charting platforms) and is created by applying the Stochastic oscillator formula to a set of relative strength index ( RSI ) values rather than to standard price data. Using RSI values within the Stochastic formula gives traders an idea of whether the current RSI value is overbought or oversold. The Stochastic RSI oscillator was developed to take advantage of both momentum indicators in order to create a more sensitive indicator that is attuned to a specific security's historical performance rather than a generalized analysis of price change.”
You can read more about the Stochastic RSI and its calculations here
How do traders use overbought and oversold levels in their trading?
The oversold level, that is when the Stochastic RSI is above the 80 level is typically interpreted as being 'overbought', and below the 20 level is typically considered 'oversold'. Traders will often use the Stochastic RSI at an overbought level as a confluence for entry into a short position, and the Stochastic RSI at an oversold level as a confluence for an entry into a long position. These levels do not mean that price will necessarily reverse at those levels in a reliable way, however. This is why this version of the Stoch RSI employs the triple timeframe overbought and oversold confluence, in an attempt to add a more confluence and reliability to this usage of the Stoch RSI .
What are divergences?
Divergence is when the price of an asset is moving in the opposite direction of a technical indicator, such as an oscillator, or is moving contrary to other data. Divergence warns that the current price trend may be weakening, and in some cases may lead to the price changing direction.
There are 4 main types of divergence, which are split into 2 categories;
regular divergences and hidden divergences. Regular divergences indicate possible trend reversals, and hidden divergences indicate possible trend continuation.
Regular bullish divergence: An indication of a potential trend reversal, from the current downtrend, to an uptrend.
Regular bearish divergence: An indication of a potential trend reversal, from the current uptrend, to a downtrend.
Hidden bullish divergence: An indication of a potential uptrend continuation.
Hidden bearish divergence: An indication of a potential downtrend continuation.
How do traders use divergences in their trading?
A divergence is considered a leading indicator in technical analysis , meaning it has the ability to indicate a potential price move in the short term future.
Hidden bullish and hidden bearish divergences, which indicate a potential continuation of the current trend are sometimes considered a good place for traders to begin, since trend continuation occurs more frequently than reversals, or trend changes.
When trading regular bullish divergences and regular bearish divergences, which are indications of a trend reversal, the probability of it doing so may increase when these occur at a strong support or resistance level . A common mistake new traders make is to get into a regular divergence trade too early, assuming it will immediately reverse, but these can continue to form for some time before the trend eventually changes, by using forms of support or resistance as an added confluence, such as when price reaches a moving average, the success rate when trading these patterns may increase.
Typically, traders will manually draw lines across the swing highs and swing lows of both the price chart and the oscillator to see whether they appear to present a divergence, this indicator will draw them for you, quickly and clearly, and can notify you when they occur.
Setting alerts.
With this indicator you can set alerts to notify you when any/all of the above types of divergences occur, on any chart timeframe you choose.
Configurable pivot period.
You can adjust the default pivot lookback values to suit your prefered trading style and timeframe. If you like to trade a shorter time frame, lowering the default lookback values will make the divergences drawn more sensitive to short term price action.
Disclaimer: This script includes code from the stock UO and MFI by Tradingview as well as the Divergence for Many Indicators v4 by LonesomeTheBlue.

MFI + Realtime DivergencesMoney Flow Index (MFI) + Realtime Divergences + Alerts
This version of the MFI indicator adds the following 5 additional features to the stock MFI:
- Optional divergence lines drawn directly onto the oscillator in realtime.
- Configurable alerts to notify you when divergences occur.
- Configurable lookback periods to fine tune the divergences drawn in order to suit different trading styles and timeframes, including the ability to enable automatic adjustment of pivot period per chart timeframe.
- Background colouring option to indicate when the MFI oscillator has crossed above or below its centerline, or optionally when both the MFI has crossed its centerline and an external oscillator, which can be linked via the settings, has also crossed its centerline.
- Alternate timeframe feature allows you to configure the oscillator to use data from a different timeframe than the chart it is loaded on.
This indicator adds additional features onto the standard MFI , whose core calculations remain unchanged. Namely the configurable option to automatically, quickly and clearly draw divergence lines onto the oscillator for you as they occur in realtime. It also has the addition of unique alerts, so you can be notified when divergences occur without spending all day watching the charts. Furthermore, this version of the TSI comes with configurable lookback periods, which can be configured in order to adjust the sensitivity of the divergences, in order to suit shorter or higher timeframe trading approaches.
What is the Money Flow Index ( MFI )?
Investopedia describes the True Strength Indicator as follows:
“The Money Flow Index ( MFI ) is a technical oscillator that uses price and volume data for identifying overbought or oversold signals in an asset. It can also be used to spot divergences which warn of a trend change in price. The oscillator moves between 0 and 100.
Unlike conventional oscillators such as the Relative Strength Index ( RSI ), the Money Flow Index incorporates both price and volume data, as opposed to just price. For this reason, some analysts call MFI the volume-weighted RSI .”
What are divergences?
Divergence is when the price of an asset is moving in the opposite direction of a technical indicator, such as an oscillator, or is moving contrary to other data. Divergence warns that the current price trend may be weakening, and in some cases may lead to the price changing direction.
There are 4 main types of divergence, which are split into 2 categories;
regular divergences and hidden divergences. Regular divergences indicate possible trend reversals, and hidden divergences indicate possible trend continuation.
Regular bullish divergence: An indication of a potential trend reversal, from the current downtrend, to an uptrend.
Regular bearish divergence: An indication of a potential trend reversal, from the current uptrend, to a downtrend.
Hidden bullish divergence: An indication of a potential uptrend continuation.
Hidden bearish divergence: An indication of a potential downtrend continuation.
Setting alerts.
With this indicator you can set alerts to notify you when any/all of the above types of divergences occur, on any chart timeframe you choose.
Configurable pivot periods.
You can adjust the default pivot periods to suit your prefered trading style and timeframe. If you like to trade a shorter time frame, lowering the default lookback values will make the divergences drawn more sensitive to short term price action.
How do traders use divergences in their trading?
A divergence is considered a leading indicator in technical analysis , meaning it has the ability to indicate a potential price move in the short term future.
Hidden bullish and hidden bearish divergences, which indicate a potential continuation of the current trend are sometimes considered a good place for traders to begin, since trend continuation occurs more frequently than reversals, or trend changes.
When trading regular bullish divergences and regular bearish divergences, which are indications of a trend reversal, the probability of it doing so may increase when these occur at a strong support or resistance level . A common mistake new traders make is to get into a regular divergence trade too early, assuming it will immediately reverse, but these can continue to form for some time before the trend eventually changes, by using forms of support or resistance as an added confluence, such as when price reaches a moving average, the success rate when trading these patterns may increase.
Typically, traders will manually draw lines across the swing highs and swing lows of both the price chart and the oscillator to see whether they appear to present a divergence, this indicator will draw them for you, quickly and clearly, and can notify you when they occur.
Disclaimer: This script includes code from the stock MFI by Tradingview as well as the Divergence for Many Indicators v4 by LonesomeTheBlue.

Money Flow LineWhat is this? The Money Flow Line (MFL) indicator is at its core a more even-tempered version of the Price-Volume-Trend (PVT). The primary difference is the usage of `hlc3` ((high + low + close) / 3) rather than `close` to use the "typical price" that it critical to the calculation of the Money Flow Index (MFI). Other similar indicators include the Accumulation Distribution Line (ADL) and the On Balance Volume (OBV) indicators. The purpose of all of these indicators is to attempt to measure the strength of the money flow by combining price and volume into a rolling measurement that can be compared over time to look for confirmations and divergences.
The indicator also includes an optional averaging (smoothing) line that can be enabled in the display settings. Enabling this smoothing line with a desired period allows for simpler trend comparisons and also allows the user to view how far the line has diverged from the mean. This creates an indicator very similar to Elder's Force Index (EFI), which is also a `close * volume` style indicator.
Why is this important? After an extreme movement or volume spike the MFI will "snap back" sharply as that bar eventually exits the set period. This produces a result that is meaningless and skews the indicator away from the market structure. Because of this behavior, range clamping, and the loss of comparative history I prefer to shy away from oscillator style indicators. The Money Flow Line instead gives you all of the history so you may compare and see the broader trend without sharp snaps in history based on an arbitrary period setting.
Why is this better? This produces a no-lag indicator that isn't subject to the harsh skewing produced by they Money Flow Index's period calculation. It doesn't lose history like MFI or EFI, is clear about the trend direction, and prefers a "typical price" (averaging the entire range of each bar) rather than whatever happens to be the closing price for a given bar.
How can I use it? The indicator is attempting to measure supply and demand in the markets. No indicator is perfect, but we can use all of the information we have available to make our best predictions. There are only 3 pieces of data the market gives us:
1. Price (action)
2. Volume
3. Time
The Money Flow Line combines all of these data points into a readable rolling data set that attempts to show subtle balance of power shifts based on changes in volume and "smart money" (or "big money") stepping in and out of the picture. Much like PVT, we look for the same things:
- Trend Identification: an up or down trend appears in the MFL
- Confirmations: the MFL agrees with price action in direction and magnitude
- Divergence: the MFL disagrees with price action, indicating a reversal may be coming soon
When applying the smoothing line we can also look for similar things we would with EFI. The primary case would be to look for the MFL to jump very far away from the mean (a high magnitude movement) which indicates that price may be reverting towards the mean soon (a "mean reversion"). On the other hand, it may indicate strength in the current price direction. All of these predictions depend heavily on price action and market structure. Good luck!

Flow of RangeThe Flow of Range is calculated by averaging the range for the given bars for the short term oscillations, then averaging the average to determine long term runs.
Above 0 indicates bullish momentum, below 0 indicates bearish momentum.
Notice the behavior of the market when the range is increasing and decreasing - both on the long and short term oscillations.
The indicator should be used in a discretionary manner along with your usual preferred tools.

Volume Pressure AnalysisVolume Pressure Analysis is a new concept I have been working on designed to show the effort required to move price. An ideal tool for confirming trends or locating reversals early. This indicator can highlight whale action and market manipulation. It calculates volume vs volatility and displays the results as a meter:
Above 0 shows how easy price action is traveling, the bigger these bars the less volume and effort is required to push price. These are indicated with a teal or red arrows and can confirm the beginning or continuation of a trend. This is the natural direction the chart wants to travel at that time.
Below 0 shows how hard price is to move. The bigger these bars the more volume and effort is required to push price. When whales and market makers push price against its will these bars will get bigger.
Yellow arrows signal pressure in that direction and excessive amounts of volume is required to move price. These signals can lead to reversal/ pivot points as price action struggles to continue its trend. These signals can be turned on in settings or use the overlay version of this script to display signals on chart. This is a very powerful tool when used with relative volume.


Dziwne MFI Overlay (with highlight)It is simply your traditional MFI , except that your 50 line became the actual price.
Why and how could it be useful? This indicator helps to spot more easily and efficiently divergences .
You could also use it for trend reversals as you usually do with your 50 line, but I would suggest to set a higher length for the MFI, like 155 or something like that.

Angle & Price FlowThis is a simple end of the day indicator based on open and close values.
Angles:
Identifying narrow angles helps to find breakouts
Maximum angle = High chance of reversal
Minimum angle = Chance of breakouts on the next day or upcoming days.
Price Flow:
I personally use price flow to simplify the flow of candlestick chart and to identify breakouts using rounding bottoms and rounding top patterns, sharp corners for reversals.
Features:
Multi time frame
Labels
Hide previous period
Combine it with other indicators for better result.

Volatility Stop Flow [AR]The indicator is designed to scan cross multiple timeframes and display the Volatility Stop Value.
NYSE Volume UP FLOW VS Down FLOW ULTIMATE VOLDNYSE Volume UP FLOW VS Down FLOW ULTIMATE StokedStocks
BASED OFF THE VOLD INDEX
The VOLD (also $VOLD) is the difference between the up volume and down volume on the NYSE. i.e. NYSE $UVOL minus $DVOL; the net up volume.
If you consider that VOLD is the net value between UVOL (up volume) and DVOL (down volume) then you need to understand these two to understand VOLD.
UVOL or DVOL are a total of the volume on all stocks that are up or down in price. Up or down is based on the previous session's closing price. The size of the stock's price change is irrelevant.
If the stock is up only $.01, then its volume is grouped into the UVOL total. If that stock's price then drops by $.02 it will be down $.01 and the day's volume for that stock will now be grouped with the DVOL total.
Note that when a stock moves from being an up stock to a down stock its volume will be removed from the UVOL total and added to the DVOL total. Say the stocks volume is 1 million shares when it moves from up to down. The DVOL will increase by 1 million and the UVOL will decrease by 1 million which means that VOLD will decrease by 2 million.
NYSE Up/Down Volume Ratio is often used as a barometer for stocks trading on all U.S. Exchanges even though it is calculated based on stocks listed on the New York Stock Exchange.
NYSE Up/Down ratio represents the volume of NYSE stocks that are advancing divided by the volume of declining stocks.
The volume of advancing stocks or upside volume is the sum of the volume or the number of shares traded associated with stocks that closed higher.
The downside volume is the total number of shares traded that are associated with stocks that closed lower.
The interpretation of the NYSE Up/Down ratio is rather simple. A value higher than one indicates that there is more volume associated with up stocks than with down stocks and it is usually interpreted as a bullish signal.
Obviously, a bearish signal occurs when the NYSE Up/Down ratio is lower than one, which tells us that there are more volume associated with down stocks than with up stocks.
Check out my other indicators and website stokedstocks.wordpress.com for tons of free stock training books and pictures and settings


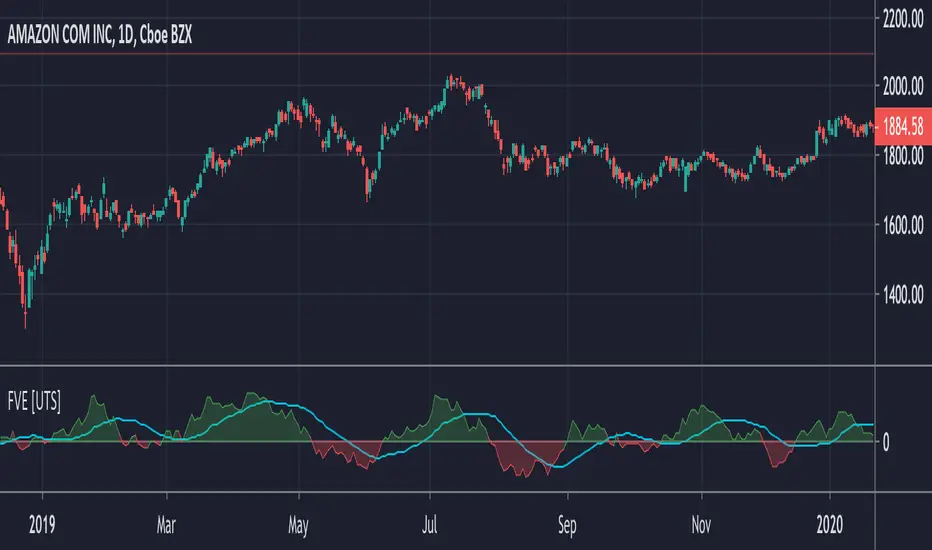
FVE - Finite Volume Elements [UTS]FVE is a money flow indicator but with two important differences from existing money flow indicators:
It resolves contradictions between intraday money flow indicators (such as Chaikin’s money flow) and interday money flow indicators (like On Balance Volume) by taking into account both intra- and interday price action.
Unlike other money flow indicators which add or subtract all volume even if the security closed just 1 cent higher than the previous close, FVE uses a volatility threshold to take into account minimal price changes.
General Usage
The FVE provides 3 types of signals:
The strongest signal is divergence between price and the indicator. Divergence can provide leading signals of breakouts or warnings of impending corrections. The classic method for detecting divergence is for FVE to make lower highs while price makes higher highs (negative divergence). An alternative method is to draw the linear regression line on both charts, and compare the slopes. A logical buy signal would be for FVE, diverging from price, to rise sharply and make a series higher highs and/or higher lows.
The most obvious and coincident signal is the slope of the FVE line. An upward slope indicates that the bulls are in control and the opposite for downward.
This is a unique and very important property of this indicator. Values above zero are bullish and indicate accumulation while values below zero indicate distribution. FVE crossing the zero line indicates that the short to intermediate balance of power is changing from the bulls to the bears or vice versa. The best scenario is when a stock is in the process of building a base, and FVE diverges from price and rises to cross the zero line from below, at a sharp angle. Conversely the crossing of the zero line from above is a bearish signal to liquidate positions or initiate a short trade.
Trend Visualisation
Optional: If the trend direction is DOWN the moving average is painted red. If the trend direction is UP the moving average is painted in green.
If the movement is FLAT then the color is grey.
Moving Averages
Five different types of Moving Averages are available for both FVE and the optional moving average of the FVE.
ALMA (Arnaud Legoux Moving Average)
Average Value
EMA (Exponential Moving Average)
SMA (Simple Moving Average)
WMA (Weighted Moving Average)
Calculation Methods
Since Markos Katsanos presented the first version of the FVE in April 2003.
Since then there have been various adaptions and improvements on this indicator.
The following are choosable for calculating the FVE:
Thinkscript usethinkscript.com
Linnsoft www.linnsoft.com
Volatility Adapted traders.com
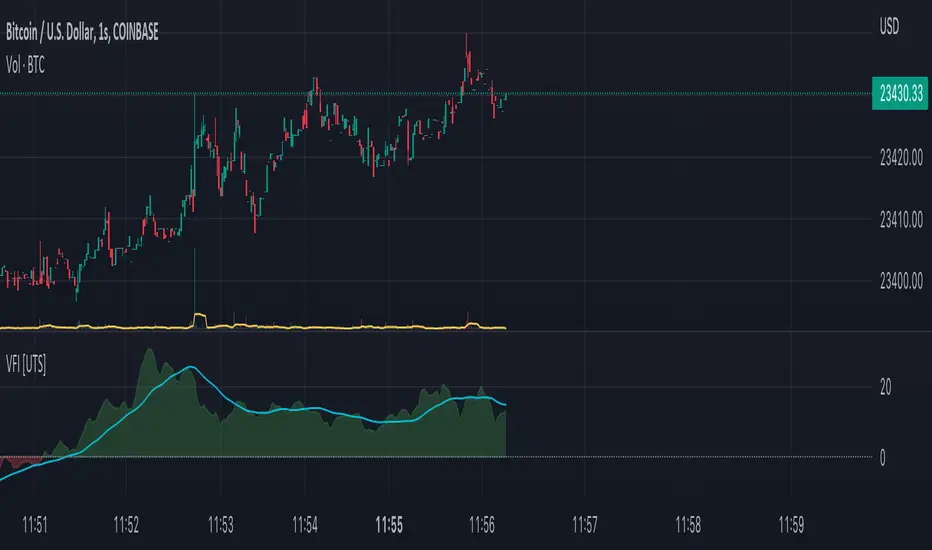
VFI - Volume Flow Indicator [UTS]The Volume Flow Indicator (VFI) indicator was first introduced in my June 2004 and is is based on the popular On Balance Volume (OBV) but with three very important modifications:
Unlike the OBV, indicator values are no longer meaningless. Positive readings are bullish and negative bearish.
The calculation is based on the day's median instead of the closing price.
A volatility threshold takes into account minimal price changes and another threshold eliminates excessive volume.
The indicator takes into account only the latest 6 month volume action and not the entire data loaded in the chart.
General Usage
A simplified interpretation of the VFI is that values above zero indicate a bullish state and the crossing of the zero line is the trigger or buy signal.
The strongest signal with all money flow indicators is of course divergence.
The classic form of divergence is when the indicator refuses to follow the price action and makes lower highs while price makes higher highs (negative divergence). If price reaches a new low but the indicator fails to do so, then price probably traveled lower than it should have. In this instance, you have positive divergence.
Default settings
130 VFI Length
0.2 Coef
2.5 Volume cutoff
3 Smoothing Period
Further setting examples can be found on www.precisiontradingsystems.com
Trend Visualisation
Optional Setting:
If the trend direction is DOWN the moving average is painted red. If the trend direction is UP the moving average is painted in green.
If the movement is FLAT then the color is grey.
Moving Averages
4 different types of Moving Averages are available for both FVI and the optional Moving Average of the FVI.
ALMA (Arnaud Legoux Moving Average)
EMA (Exponential Moving Average)
SMA (Simple Moving Average)
WMA (Weighted Moving Average)
Notes
This indicator is using the exact formula from mkatsanos.com where EMA has been taken as default value for FVI smoothing calculation.
CMF Osc - Chaikin Money Flow Oscillator [UTS]The well known Chaikin Money Flow Indicator as oscillator version.
General Usage
The indicator runs both above and below zero, made to denote whether an asset is in a bullish (above zero) or bearish (below zero) trend.
It can be used to confirm trends, as well as spot possible trading signals due to divergences.
A benefit of the oscillator version is that it can produce LONG or SHORT signals on zero line cross.
Moving Averages
4 different Moving Averages are available:
EMA (Exponential Moving Average)
SMA (Simple Moving Average)
VWMA (Volume Weighted Moving Average)
WMA (Weighted Moving Average)

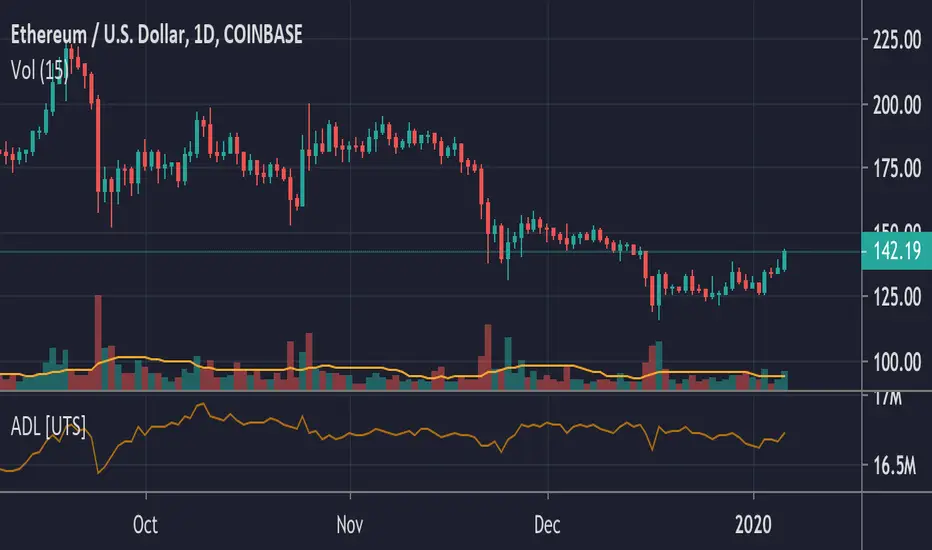
ADL - Accumulation Distribution Line [UTS]an underlying asset.
It is determined by the changes in price and volume. The volume acts as a weighting coefficient at the change of price — the higher the coefficient (the volume) is the greater the contribution of the price change (for this period of time) will be in the value of the indicator. The indicator is also known as Accumulation / Distribution Index.
Common known variants of this type of indicator are the On Balance Volume, Chaikin Oscillator or Chaikin Money Flow.
Based on www.metatrader5.com
Volume Flow v3 (Rescaled Update)This is a rescaled version of the script (www.tradingview.com...) by oh92. Rescaling allows to represent data in a more contrastive way. All thanks, bells and whistles are to be attributed to the author.))
