Indicatore Pine Script®
FLOW

Dziwne MFI Overlay (with highlight)It is simply your traditional MFI , except that your 50 line became the actual price.
Why and how could it be useful? This indicator helps to spot more easily and efficiently divergences .
You could also use it for trend reversals as you usually do with your 50 line, but I would suggest to set a higher length for the MFI, like 155 or something like that.
Indicatore Pine Script®

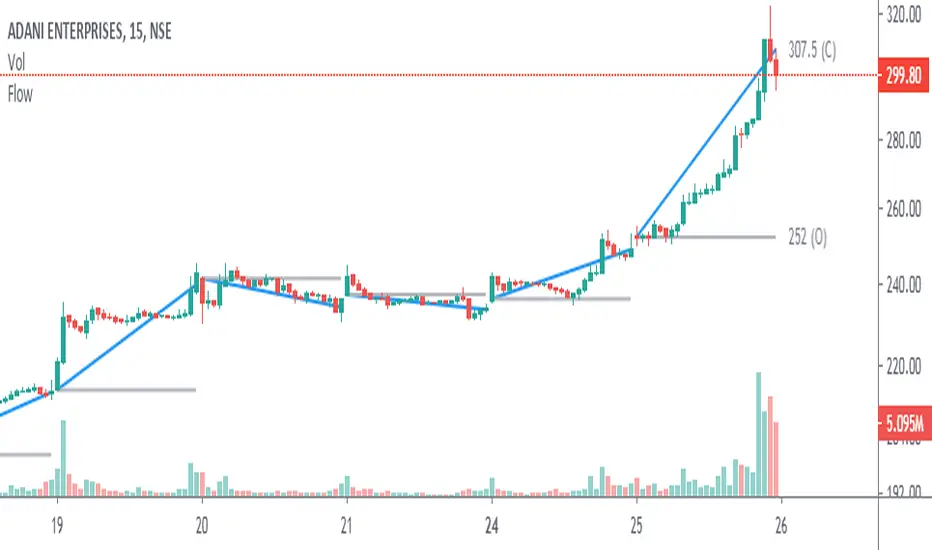
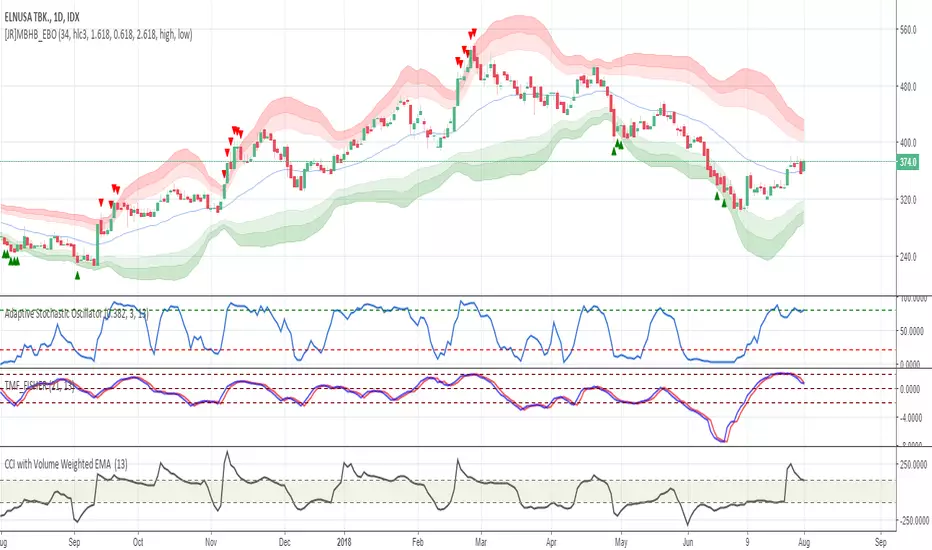
Angle & Price FlowThis is a simple end of the day indicator based on open and close values.
Angles:
Identifying narrow angles helps to find breakouts
Maximum angle = High chance of reversal
Minimum angle = Chance of breakouts on the next day or upcoming days.
Price Flow:
I personally use price flow to simplify the flow of candlestick chart and to identify breakouts using rounding bottoms and rounding top patterns, sharp corners for reversals.
Features:
Multi time frame
Labels
Hide previous period
Combine it with other indicators for better result.
Indicatore Pine Script®

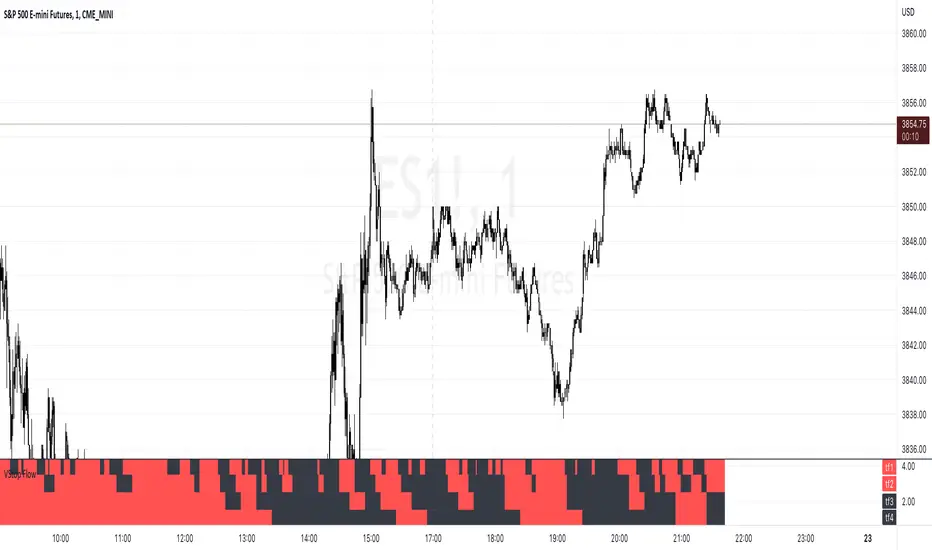
Volatility Stop Flow [AR]The indicator is designed to scan cross multiple timeframes and display the Volatility Stop Value.
Indicatore Pine Script®
NYSE Volume UP FLOW VS Down FLOW ULTIMATE VOLDNYSE Volume UP FLOW VS Down FLOW ULTIMATE StokedStocks
BASED OFF THE VOLD INDEX
The VOLD (also $VOLD) is the difference between the up volume and down volume on the NYSE. i.e. NYSE $UVOL minus $DVOL; the net up volume.
If you consider that VOLD is the net value between UVOL (up volume) and DVOL (down volume) then you need to understand these two to understand VOLD.
UVOL or DVOL are a total of the volume on all stocks that are up or down in price. Up or down is based on the previous session's closing price. The size of the stock's price change is irrelevant.
If the stock is up only $.01, then its volume is grouped into the UVOL total. If that stock's price then drops by $.02 it will be down $.01 and the day's volume for that stock will now be grouped with the DVOL total.
Note that when a stock moves from being an up stock to a down stock its volume will be removed from the UVOL total and added to the DVOL total. Say the stocks volume is 1 million shares when it moves from up to down. The DVOL will increase by 1 million and the UVOL will decrease by 1 million which means that VOLD will decrease by 2 million.
NYSE Up/Down Volume Ratio is often used as a barometer for stocks trading on all U.S. Exchanges even though it is calculated based on stocks listed on the New York Stock Exchange.
NYSE Up/Down ratio represents the volume of NYSE stocks that are advancing divided by the volume of declining stocks.
The volume of advancing stocks or upside volume is the sum of the volume or the number of shares traded associated with stocks that closed higher.
The downside volume is the total number of shares traded that are associated with stocks that closed lower.
The interpretation of the NYSE Up/Down ratio is rather simple. A value higher than one indicates that there is more volume associated with up stocks than with down stocks and it is usually interpreted as a bullish signal.
Obviously, a bearish signal occurs when the NYSE Up/Down ratio is lower than one, which tells us that there are more volume associated with down stocks than with up stocks.
Check out my other indicators and website stokedstocks.wordpress.com for tons of free stock training books and pictures and settings
Indicatore Pine Script®

Indicatore Pine Script®

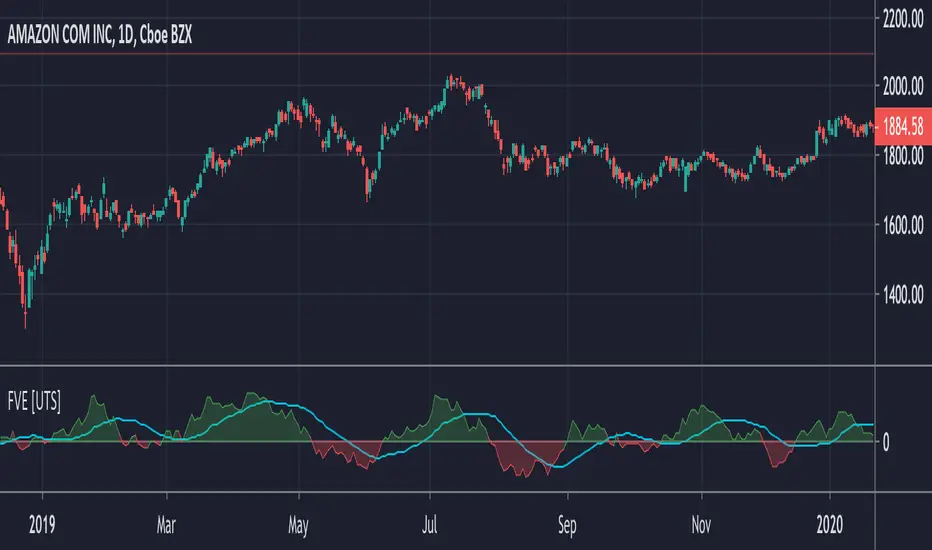
FVE - Finite Volume Elements [UTS]FVE is a money flow indicator but with two important differences from existing money flow indicators:
It resolves contradictions between intraday money flow indicators (such as Chaikin’s money flow) and interday money flow indicators (like On Balance Volume) by taking into account both intra- and interday price action.
Unlike other money flow indicators which add or subtract all volume even if the security closed just 1 cent higher than the previous close, FVE uses a volatility threshold to take into account minimal price changes.
General Usage
The FVE provides 3 types of signals:
The strongest signal is divergence between price and the indicator. Divergence can provide leading signals of breakouts or warnings of impending corrections. The classic method for detecting divergence is for FVE to make lower highs while price makes higher highs (negative divergence). An alternative method is to draw the linear regression line on both charts, and compare the slopes. A logical buy signal would be for FVE, diverging from price, to rise sharply and make a series higher highs and/or higher lows.
The most obvious and coincident signal is the slope of the FVE line. An upward slope indicates that the bulls are in control and the opposite for downward.
This is a unique and very important property of this indicator. Values above zero are bullish and indicate accumulation while values below zero indicate distribution. FVE crossing the zero line indicates that the short to intermediate balance of power is changing from the bulls to the bears or vice versa. The best scenario is when a stock is in the process of building a base, and FVE diverges from price and rises to cross the zero line from below, at a sharp angle. Conversely the crossing of the zero line from above is a bearish signal to liquidate positions or initiate a short trade.
Trend Visualisation
Optional: If the trend direction is DOWN the moving average is painted red. If the trend direction is UP the moving average is painted in green.
If the movement is FLAT then the color is grey.
Moving Averages
Five different types of Moving Averages are available for both FVE and the optional moving average of the FVE.
ALMA (Arnaud Legoux Moving Average)
Average Value
EMA (Exponential Moving Average)
SMA (Simple Moving Average)
WMA (Weighted Moving Average)
Calculation Methods
Since Markos Katsanos presented the first version of the FVE in April 2003.
Since then there have been various adaptions and improvements on this indicator.
The following are choosable for calculating the FVE:
Thinkscript usethinkscript.com
Linnsoft www.linnsoft.com
Volatility Adapted traders.com
Indicatore Pine Script®
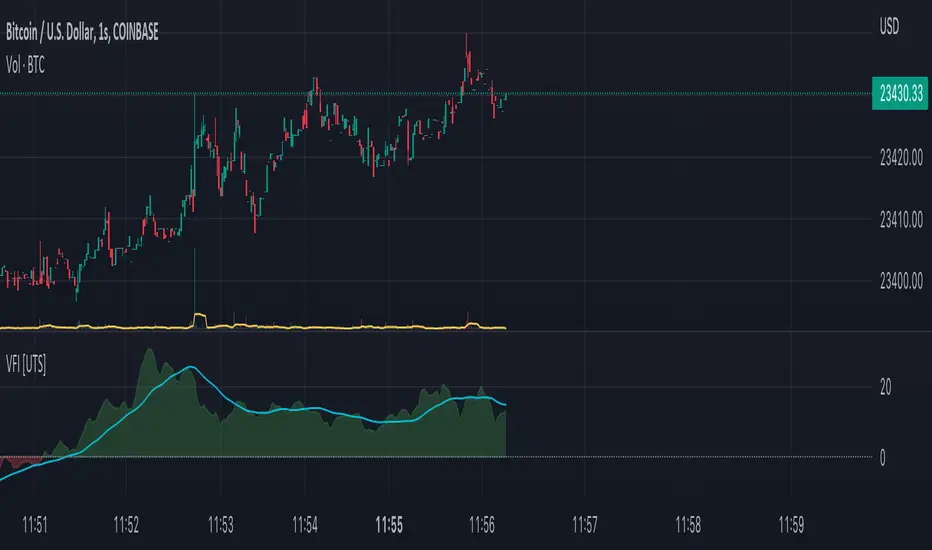
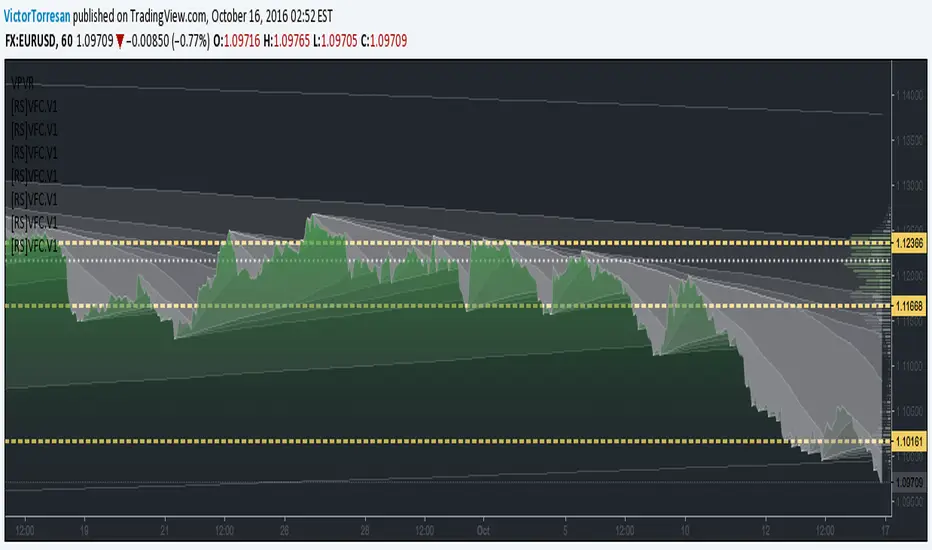
VFI - Volume Flow Indicator [UTS]The Volume Flow Indicator (VFI) indicator was first introduced in my June 2004 and is is based on the popular On Balance Volume (OBV) but with three very important modifications:
Unlike the OBV, indicator values are no longer meaningless. Positive readings are bullish and negative bearish.
The calculation is based on the day's median instead of the closing price.
A volatility threshold takes into account minimal price changes and another threshold eliminates excessive volume.
The indicator takes into account only the latest 6 month volume action and not the entire data loaded in the chart.
General Usage
A simplified interpretation of the VFI is that values above zero indicate a bullish state and the crossing of the zero line is the trigger or buy signal.
The strongest signal with all money flow indicators is of course divergence.
The classic form of divergence is when the indicator refuses to follow the price action and makes lower highs while price makes higher highs (negative divergence). If price reaches a new low but the indicator fails to do so, then price probably traveled lower than it should have. In this instance, you have positive divergence.
Default settings
130 VFI Length
0.2 Coef
2.5 Volume cutoff
3 Smoothing Period
Further setting examples can be found on www.precisiontradingsystems.com
Trend Visualisation
Optional Setting:
If the trend direction is DOWN the moving average is painted red. If the trend direction is UP the moving average is painted in green.
If the movement is FLAT then the color is grey.
Moving Averages
4 different types of Moving Averages are available for both FVI and the optional Moving Average of the FVI.
ALMA (Arnaud Legoux Moving Average)
EMA (Exponential Moving Average)
SMA (Simple Moving Average)
WMA (Weighted Moving Average)
Notes
This indicator is using the exact formula from mkatsanos.com where EMA has been taken as default value for FVI smoothing calculation.
Indicatore Pine Script®
CMF Osc - Chaikin Money Flow Oscillator [UTS]The well known Chaikin Money Flow Indicator as oscillator version.
General Usage
The indicator runs both above and below zero, made to denote whether an asset is in a bullish (above zero) or bearish (below zero) trend.
It can be used to confirm trends, as well as spot possible trading signals due to divergences.
A benefit of the oscillator version is that it can produce LONG or SHORT signals on zero line cross.
Moving Averages
4 different Moving Averages are available:
EMA (Exponential Moving Average)
SMA (Simple Moving Average)
VWMA (Volume Weighted Moving Average)
WMA (Weighted Moving Average)
Indicatore Pine Script®

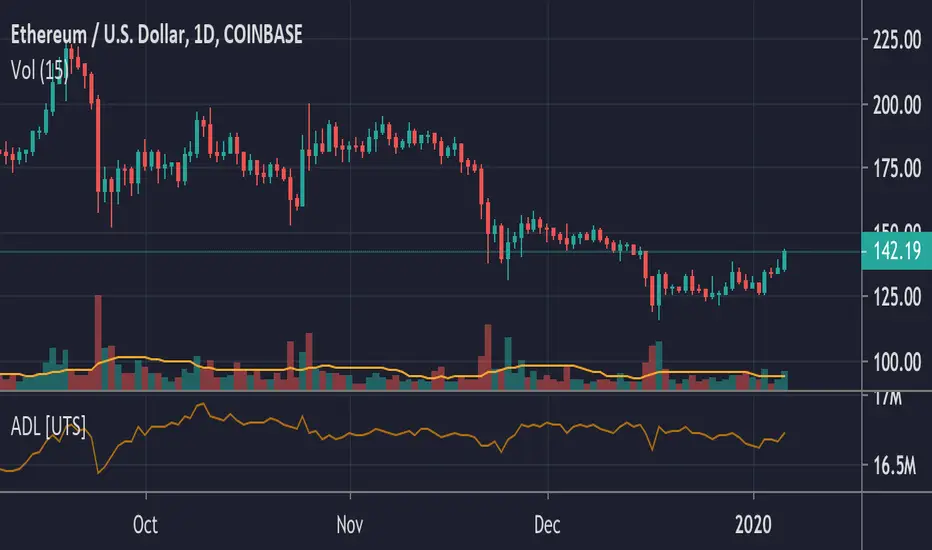
ADL - Accumulation Distribution Line [UTS]an underlying asset.
It is determined by the changes in price and volume. The volume acts as a weighting coefficient at the change of price — the higher the coefficient (the volume) is the greater the contribution of the price change (for this period of time) will be in the value of the indicator. The indicator is also known as Accumulation / Distribution Index.
Common known variants of this type of indicator are the On Balance Volume, Chaikin Oscillator or Chaikin Money Flow.
Based on www.metatrader5.com
Indicatore Pine Script®
Volume Flow v3 (Rescaled Update)This is a rescaled version of the script (www.tradingview.com...) by oh92. Rescaling allows to represent data in a more contrastive way. All thanks, bells and whistles are to be attributed to the author.))
Indicatore Pine Script®

Chaikin Money FlowThis script plots the original Chaikin Money Flow in addition of highlighting positive/negative pressure areas.
Indicatore Pine Script®

Stoch Money Flow (ADMF) & Absolute Strength Index (ASI) [cI8DH]This indicator can apply my previous indicator, Historical and Standard Stochastic, to Money Flow (ADMF) or Absolute Strength Index (ASI) or both at the same time. It can also display those two indicators in regular mode as well as showing visual cues when the indicators make new ATH or ATL.
ASI is basically a new name I am giving to my Gain/Loss Moving Average indicator. If you normalize ASI with the moving average of all the changes in price, it becomes identical to RSI. So ASI is basically non-normalized RSI, that is why it should be a more accurate representation of price momentum.
ADMF is an accumulation/distribution and money flow momentum indicator. Both ASI and ADMF are not range-bound so it is not easy to compare them against each other. When stochastic equation is applied to them, they both become range-bound and comparable. The gaps between the two indicator can reveal valuable information about market dynamics. The chart below shows some examples (note the settings).
For conventional usages of stochastic, please read www.tradingview.com(STOCH) and www.tradingview.com(STOCH_RSI). I recommend you to find the optimal length by playing with the stoch length in the indicator settings. If this parameter is calibrated properly, this indicator can be a powerful tool for identifying market cycle.
You can get these features ( ATH , ATL detection and historical stochastic) for any other indicator using the script below:
Indicatore Pine Script®

Twiggs Money Flow Fisher Transform// Credits to @LazyBear
// This is an experimental indicator (Originaly coded by Lazybear) modified by @haidinurhasfi by applying the Fisher Transform to Twiggs Money Flow.
// Tune the length according to your trading style and instrument
Indicatore Pine Script®
Indicatore Pine Script®
Indicatore Pine Script®
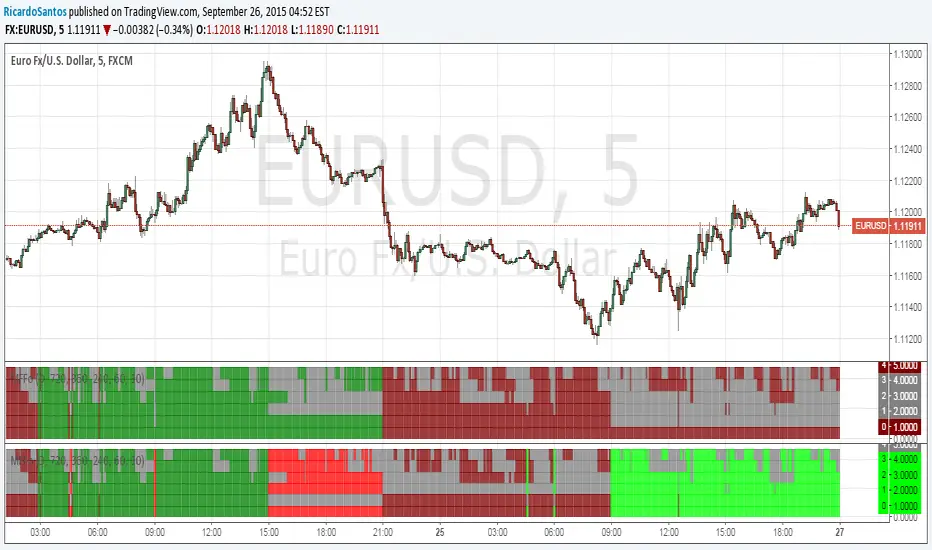
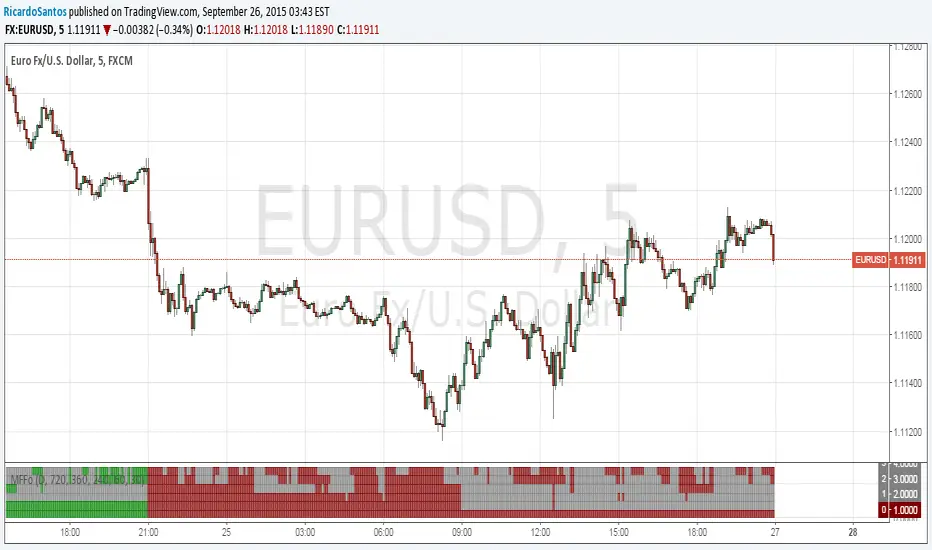
[RS]Market Fractility Flow Oscillator V0EXPERIMENTAL:
same as MTF-BIAS. but slightly more practical, reads market fractality flow into a oscillator.
Indicatore Pine Script®
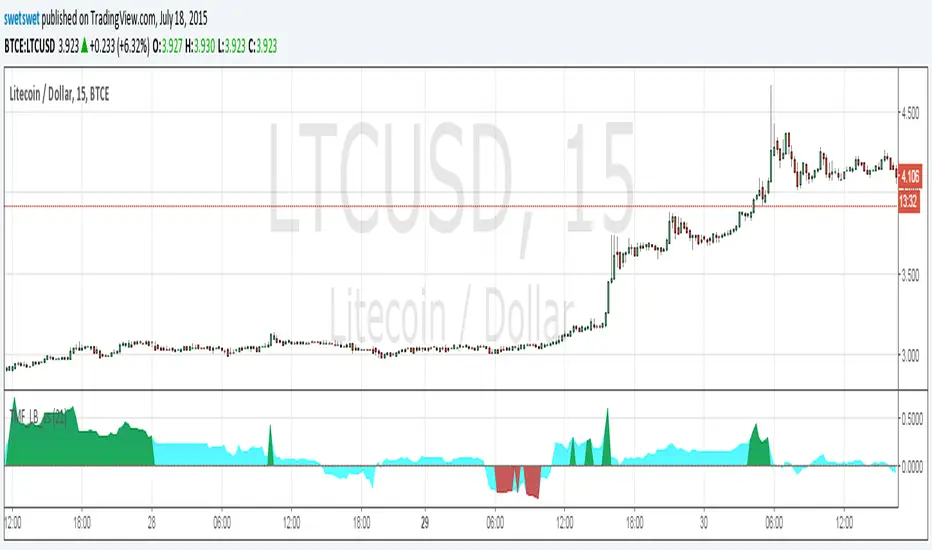
Twiggs Money Flow_LB [SwetSwet]The modified indicator Twiggs Money Flow more convenient. The critical value is colored in green or red.
Indicatore Pine Script®
Indicatore Pine Script®

CM_Twiggs Money FlowFull Credit goes to LazyBear for publishing Original Code.
I added:
Threshold lines that changes the color of Histogram based on if it exceeds Threshold lines. Ability to turn off and on.
Ability to Turn Histogram Off/On
Ability to turn Twiggs Money Flow Line Off/On
Indicatore Pine Script®
