ATR RopeATR Rope is inspired by DonovanWall's "Range Filter". It implements a similar concept of filtering out smaller market movements and adjusting only for larger moves. In addition, this indicator goes one step deeper by producing actionable zones to determine market state. (Trend vs. Consolidation)
> Background
When reading up on the Range Filter indicator, it reminded me exactly of a Rope stabilization drawing tool in a program I use frequently. Rope stabilization essentially attaches a fixed length "rope" to your cursor and an anchor point (Brush). As you move your cursor, you are pulling the brush behind it. The cursor (of course) will not pull the brush until the rope is fully extended, this behavior filters out jittery movements and is used to produce smoother drawing curves.
If compared visually side-by-side, you will notice that this indicator bears striking resemblance to its inspiration.
> Goal
Other than simply distinguishing price movements between meaningful and noise, this indicator strives to create a rigid structure to frame market movements and lack-there-of, such as when to anticipate trend, and when to suspect consolidation.
Since the indicator works based on an ATR range, the resulting ATR Channel does well to get reactions from price at its extremes. Naturally, when consolidating, price will remain within the channel, neither pushing the channel significantly up or down. Likewise, when trending, price will continue to push the channel in a single direction.
With the goal of keeping it quick and simple, this indicator does not do any smoothing of data feeds, and is simply based on the deviation of price from the central rope. Adjusting the rope when price extends past the threshold created by +/- ATR from the rope.
> Features & Behaviors
- ATR Rope
ATR Rope is displayed as a 3 color single line.
This can be considered the center line, or the directional line, whichever you'd prefer.
The main point of the Rope display is to indicate direction, however it also is factually the center of the current working range.
- ATR Rope Color
When the rope's value moves up, it changes to green (uptrend), when down, red (downtrend).
When the source crosses the rope, it turns blue (flat).
With these simple rules, we've formed a structure to view market movements.
- Consolidation Zones
Consolidation Zones generate from "Flat" areas, and extend into subsequent trend areas. Consolidation is simply areas where price has crossed the Rope and remains inside the range. Over these periods, the upper and lower values are accumulated and averaged together to form the "Consolidation Zone" values. These zones are draw live, so values are averaged as the flat areas progress and don't repaint, so all values seen historically are as they would appear live.
- ATR Channel
ATR Channel displays the upper and lower bounds of the working range.
When the source moves beyond this range, the rope is adjusted based on the distance from the source to the channel. This range can be extremely useful to view, but by default it is hidden.
> Application
This indicator is not created to provide signals, or serve as a "complete" system.
(People who didn't read this far will still comment for signals. :) )
This is created to be used alongside manual interpretation and intuition. This indicator is not meant to constrain any users into a box, and I would actually encourage an open mind and idea generation, as the application of this indicator can take various forms.
> Examples
As you would probably already know, price movement can be fast impulses, and movement can be slow bleeds. In the screenshot below, we are using movements from and to consolidation zones to classify weak trend and strong trend. As you can see, there are also areas of consolidation which get broken out of and confirmed for the larger moves.
Author's Note: In each of these examples, I have outlined the start and end of each session. These examples come from 1 Min Future charts, and have specifically been framed with day trading in mind.
"Breakout Retest" or "Support/Resistance Flips" or "Structure Retests" are all generally the same thing, with different traders referring to them by different names, all of which can be seen throughout these examples.
In the next example, we have a day which started with an early reversal leading into long, slow, trend. Notice how each area throughout the trend essentially moves slightly higher, then consolidates while holding support of the previous zone. This day had a few sharp movements, however there was a large amount of neutrality throughout this day with continuous higher lows.
In contrast to the previous example, next up, we have a very choppy day. Throughout which we see a significant amount of retests before fast directional movements. We also see a few examples of places where previous zones remained relevant into the future. While the zones only display into the resulting trend area, they do not become immediately meaningless once they stop drawing.
> Abstract
In the screenshot below, I have stacked 2 of these indicators, using the high as the source for one and the low as the source for the other. I've hidden lines of the high and low channels to create a 4 lined channel based on the wicks of price.
This is not necessary to use the indicator, but should help provide an idea of creative ways the simple indicator could be used to produce more complicated analysis.
If you've made it this far, I would hope it's clear to you how this indicator could provide value to your trading.
Thank you to DonovonWall for the inspiration.
Enjoy!
Function

MathSpecialFunctionsConvolve1DLibrary "MathSpecialFunctionsConvolve1D"
Convolution is one of the most important mathematical operations used in signal processing. This simple mathematical operation pops up in many scientific and industrial applications, from its use in a billion-layer large CNN to simple image denoising.
___
Reference:
www.algorithm-archive.org
numpy.org
lloydrochester.com
www.geeksforgeeks.org
f(signal, filter)
Convolve
Parameters:
signal (array) : List with signal data.
filter (array) : List with weights to apply to the signal data.
Returns: Discrete, linear convolution of `signal` and `filter`.

FunctionSurvivalEstimationLibrary "FunctionSurvivalEstimation"
The Survival Estimation function, also known as Kaplan-Meier estimation or product-limit method, is a statistical technique used to estimate the survival probability of an individual over time. It's commonly used in medical research and epidemiology to analyze the survival rates of patients with different treatments, diseases, or risk factors.
What does it do?
The Survival Estimation function takes into account censored observations (i.e., individuals who are still alive at a certain point) and calculates the probability that an individual will survive beyond a specific time period. It's particularly useful when dealing with right-censoring, where some subjects are lost to follow-up or have not experienced the event of interest by the end of the study.
Interpretation
The Survival Estimation function provides a plot of the estimated survival probability over time, which can be used to:
1. Compare survival rates between different groups (e.g., treatment arms)
2. Identify patterns in the data that may indicate differences in mortality or disease progression
3. Make predictions about future outcomes based on historical data
4. In a trading context it may be used to ascertain the survival ratios of trading under specific conditions.
Reference:
www.global-developments.org
"Beyond GDP" ~ www.aeaweb.org
en.wikipedia.org
www.kdnuggets.com
survival_probability(alive_at_age, initial_alive)
Kaplan-Meier Survival Estimator.
Parameters:
alive_at_age (int) : The number of subjects still alive at a age.
initial_alive (int) : The Total number of initial subjects.
Returns: The probability that a subject lives longer than a certain age.
utility(c, l)
Captures the utility value from consumption and leisure.
Parameters:
c (float) : Consumption.
l (float) : Leisure.
Returns: Utility value from consumption and leisure.
welfare_utility(age, b, u, s)
Calculate the welfare utility value based age, basic needs and social interaction.
Parameters:
age (int) : Age of the subject.
b (float) : Value representing basic needs (food, shelter..).
u (float) : Value representing overall well-being and happiness.
s (float) : Value representing social interaction and connection with others.
Returns: Welfare utility value.
expected_lifetime_welfare(beta, consumption, leisure, alive_data, expectation)
Calculates the expected lifetime welfare of an individual based on their consumption, leisure, and survival probability over time.
Parameters:
beta (float) : Discount factor.
consumption (array) : List of consumption values at each step of the subjects life.
leisure (array) : List of leisure values at each step of the subjects life.
alive_data (array) : List of subjects alive at each age, the first element is the total or initial number of subjects.
expectation (float) : Optional, `defaut=1.0`. Expectation or weight given to this calculation.
Returns: Expected lifetime welfare value.

Weierstrass Function (Fractal Cycles)THE WEIERSTRASS FUNCTION
f(x) = ∑(n=0)^∞ a^n * cos(b^n * π * x)
The Weierstrass Function is the sum of an infinite series of cosine functions, each with increasing frequency and decreasing amplitude. This creates powerful multi-scale oscillations within the range ⬍(-2;+2), resembling a system of self-repetitive patterns. You can zoom into any part of the output and observe similar proportions, mimicking the hidden order behind the irregularity and unpredictability of financial markets.
IT DOESN’T RELY ON ANY MARKET DATA, AS THE OUTPUT IS BASED PURELY ON A MATHEMATICAL FORMULA!
This script does not provide direct buy or sell signals and should be used as a tool for analyzing the market behavior through fractal geometry. The function is often used to model complex, chaotic systems, including natural phenomena and financial markets.
APPLICATIONS:
Timing Aspect: Identifies the phases of market cycles, helping to keep awareness of frequency of turning points
Price-Modeling features: The Amplitude, frequency, and scaling settings allow the indicator to simulate the trends and oscillations. Its nowhere-differentiable nature aligns with the market's inherent uncertainty. The fractured oscillations resemble sharp jumps, noise, and dips found in volatile markets.
SETTINGS
Amplitude Factor (a): Controls the size of each wave. A higher value makes the waves larger.
Frequency Factor (b): Determines how fast the waves oscillate. A higher value creates more frequent waves.
Ability to Invert the output: Just like any cosine function it starts its journey with a decline, which is not distinctive to the behavior of most assets. The default setting is in "inverted mode".
Scale Factor: Adjusts the speed at which the oscillations grow over time.
Number of Terms (n_terms): Increases the number of waves. More terms add complexity to the pattern.

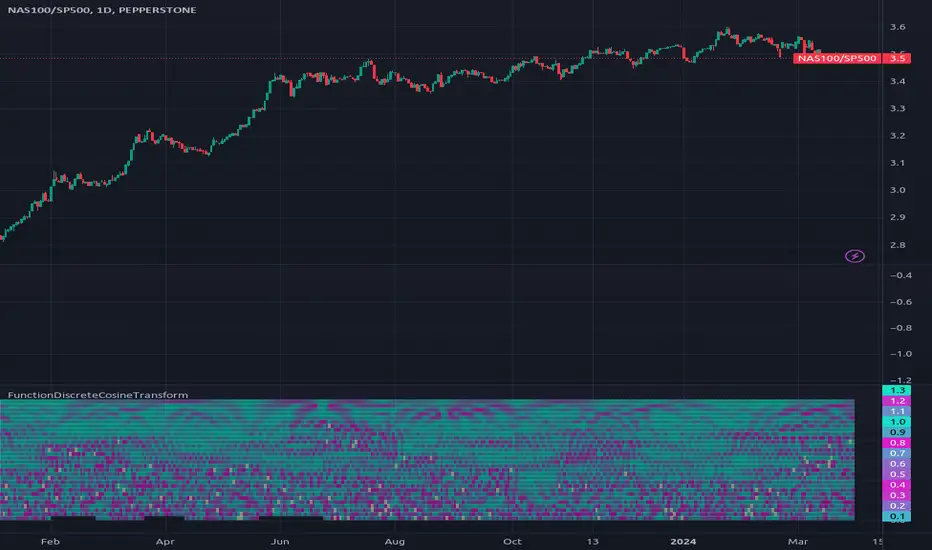
FunctionDiscreteCosineTransformLibrary "FunctionDiscreteCosineTransform"
Discrete Cosine Transform (DCT)
The Discrete Cosine Transform (DCT) is a mathematical algorithm that converts a series of samples of a signal, typically in the time domain, into another domain called the frequency or spectral domain. It's commonly used for data compression and image/video coding applications such as JPEG and MPEG standards.
The DCT works by multiplying the input sequence with specific cosine functions that are pre-defined and then summing up these products to obtain a new series of values, which represent the frequency components of the original signal. The main advantage of the DCT over other transforms like Fourier Transform is its ability to handle non-stationary signals (i.e., signals with varying statistical properties) more effectively due to its localized basis functions.
In simple terms, the DCT can be thought of as a way to break down an image or video into different frequency components and then compress them without losing too much information. This compression technique is essential for efficient transmission and storage of digital media files over the internet or on devices with limited memory capacity.
~Mixtral4x7b
___
Reference:
lcamtuf.substack.com
dct(data, len)
Discrete Cosine Transform.
Parameters:
data (array) : Data source.
len (int) : Length of the sampling window.
Returns: List with frequency domain transformed information.
dct(data, len)
Discrete Cosine Transform.
Parameters:
data (float) : Data source.
len (int) : Length of the sampling window.
Returns: List with frequency domain transformed information.
idct(data, len)
Inverse Discrete Cosine Transform.
Parameters:
data (array) : Data source.
len (int) : Length of the sampling window.
Returns: List with time domain transformed information.
idct(data, len)
Inverse Discrete Cosine Transform.
Parameters:
data (float) : Data source.
len (int) : Length of the sampling window.
Returns: List with time domain transformed information.
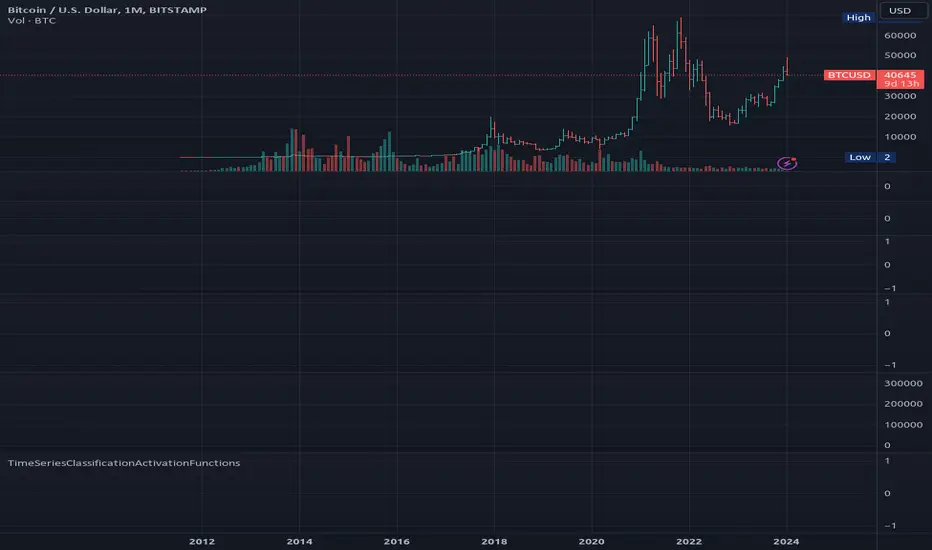
TimeSeriesClassificationActivationFunctionsLibrary "TimeSeriesClassificationActivationFunctions"
Provides some activation functions useful in time series classification.
___
reference:
github.com
method scale(dist, weights)
Activate values by a normalized scale.
Namespace types: map
Parameters:
dist (map) : Source distribution map.
weights (map) : Weights distribution map.
Returns: Normalized distribution map.
method softmax(dist, weights)
Activate values with a softmax algorithm.
Namespace types: map
Parameters:
dist (map) : Source distribution map.
weights (map) : Weights distribution map.
Returns: Normalized distribution map.
method argmax(dist, weights)
Activate values with a argmax algorithm.
Namespace types: map
Parameters:
dist (map) : Source distribution map.
weights (map) : Weights distribution map.
Returns: first key of argmax value of the transformed distribution.
FunctionsLibrary "Functions"
half_candle()
Half Candles
Returns: half candles (difference between open and close)
super_smoother(source, len)
Ehlers Super Smoother
Parameters:
source (float) : Source
len (int)
Returns: super smoothed moving average
quotient(length, K)
Ehlers early onset trend
Parameters:
length (int) : Length (default = 1)
K (float) : Factor (default = 0.8)
Returns: Ehlers early onset trend
butterworth_2Pole(src, length)
Ehlers 2 Pole Butterworth Filter
Parameters:
src (float) : Source
length (int) : Length
Returns: Ehlers 2 Pole Butterworth Filter
hann_ma(src, length)
Ehler's Hann Moving Average
Parameters:
src (float) : Source
length (int) : Length
Returns: Ehler's Hann Moving Average
oef(src)
Ehlers Optimum Elliptic Filter
Parameters:
src (float) : Source
Returns: Ehlers Optimum Elliptic Filter
moef(src)
Ehlers Modified Optimum Elliptic Filter
Parameters:
src (float) : Source
Returns: Ehlers Modified Optimum Elliptic Filter
arsi(src, length)
Advanced RSI
Parameters:
src (float) : Source
length (simple int) : Length (default = 14)
Returns: ARSI
smoothrng(src, length, multi)
Smooth Range
Parameters:
src (float) : Source
length (simple int) : Length
multi (float) : Multiplikator (default 3.0)
Returns: Smooth Range

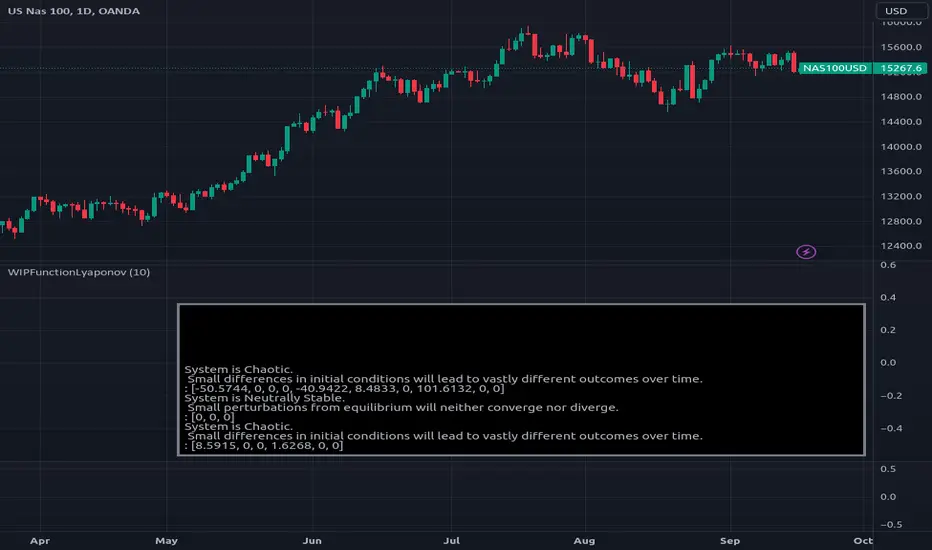
WIPFunctionLyaponovLibrary "WIPFunctionLyaponov"
Lyapunov exponents are mathematical measures used to describe the behavior of a system over
time. They are named after Russian mathematician Alexei Lyapunov, who first introduced the concept in the
late 19th century. The exponent is defined as the rate at which a particular function or variable changes
over time, and can be positive, negative, or zero.
Positive exponents indicate that a system tends to grow or expand over time, while negative exponents
indicate that a system tends to shrink or decay. Zero exponents indicate that the system does not change
significantly over time. Lyapunov exponents are used in various fields of science and engineering, including
physics, economics, and biology, to study the long-term behavior of complex systems.
~ generated description from vicuna13b
---
To calculate the Lyapunov Exponent (LE) of a given Time Series, we need to follow these steps:
1. Firstly, you should have access to your data in some format like CSV or Excel file. If not, then you can collect it manually using tools such as stopwatches and measuring tapes.
2. Once the data is collected, clean it up by removing any outliers that may skew results. This step involves checking for inconsistencies within your dataset (e.g., extremely large or small values) and either discarding them entirely or replacing with more reasonable estimates based on surrounding values.
3. Next, you need to determine the dimension of your time series data. In most cases, this will be equal to the number of variables being measured in each observation period (e.g., temperature, humidity, wind speed).
4. Now that we have a clean dataset with known dimensions, we can calculate the LE for our Time Series using the following formula:
λ = log(||M^T * M - I||)/log(||v||)
where:
λ (Lyapunov Exponent) is the quantity that will be calculated.
||...|| denotes an Euclidean norm of a vector or matrix, which essentially means taking the square root of the sum of squares for each element in the vector/matrix.
M represents our Jacobian Matrix whose elements are given by:
J_ij = (∂fj / ∂xj) where fj is the jth variable and xj is the ith component of the initial condition vector x(t). In other words, each element in this matrix represents how much a small change in one variable affects another.
I denotes an identity matrix whose elements are all equal to 1 (or any constant value if you prefer). This term essentially acts as a baseline for comparison purposes since we want our Jacobian Matrix M^T * M to be close to it when the system is stable and far away from it when the system is unstable.
v represents an arbitrary vector whose Euclidean norm ||v|| will serve as a scaling factor in our calculation. The choice of this particular vector does not matter since we are only interested in its magnitude (i.e., length) for purposes of normalization. However, if you want to ensure that your results are accurate and consistent across different datasets or scenarios, it is recommended to use the same initial condition vector x(t) as used earlier when calculating our Jacobian Matrix M.
5. Finally, once we have calculated λ using the formula above, we can interpret its value in terms of stability/instability for our Time Series data:
- If λ < 0, then this indicates that the system is stable (i.e., nearby trajectories will converge towards each other over time).
- On the other hand, if λ > 0, then this implies that the system is unstable (i.e., nearby trajectories will diverge away from one another over time).
~ generated description from airoboros33b
---
Reference:
en.wikipedia.org
www.collimator.ai
blog.abhranil.net
www.researchgate.net
physics.stackexchange.com
---
This is a work in progress, it may contain errors so use with caution.
If you find flaws or suggest something new, please leave a comment bellow.
_measure_function(i)
helper function to get the name of distance function by a index (0 -> 13).\
Functions: SSD, Euclidean, Manhattan, Minkowski, Chebyshev, Correlation, Cosine, Camberra, MAE, MSE, Lorentzian, Intersection, Penrose Shape, Meehl.
Parameters:
i (int)
_test(L)
Helper function to test the output exponents state system and outputs description into a string.
Parameters:
L (float )
estimate(X, initial_distance, distance_function)
Estimate the Lyaponov Exponents for multiple series in a row matrix.
Parameters:
X (map)
initial_distance (float) : Initial distance limit.
distance_function (string) : Name of the distance function to be used, default:`ssd`.
Returns: List of Lyaponov exponents.
max(L)
Maximal Lyaponov Exponent.
Parameters:
L (float ) : List of Lyapunov exponents.
Returns: Highest exponent.
CommonTypesMapUtilLibrary "CommonTypesMapUtil"
Common type Container library, for central usage across other reference libraries.
ArrayBool
Fields:
v (bool )
ArrayBox
Fields:
v (box )
ArrayPoint
Fields:
v (chart.point )
ArrayColor
Fields:
v (color )
ArrayFloat
Fields:
v (float )
ArrayInt
Fields:
v (int )
ArrayLabel
Fields:
v (label )
ArrayLine
Fields:
v (line )
ArrayLinefill
Fields:
v (linefill )
ArrayString
Fields:
v (string )
ArrayTable
Fields:
v (table )

SimilarityMeasuresLibrary "SimilarityMeasures"
Similarity measures are statistical methods used to quantify the distance between different data sets
or strings. There are various types of similarity measures, including those that compare:
- data points (SSD, Euclidean, Manhattan, Minkowski, Chebyshev, Correlation, Cosine, Camberra, MAE, MSE, Lorentzian, Intersection, Penrose Shape, Meehl),
- strings (Edit(Levenshtein), Lee, Hamming, Jaro),
- probability distributions (Mahalanobis, Fidelity, Bhattacharyya, Hellinger),
- sets (Kumar Hassebrook, Jaccard, Sorensen, Chi Square).
---
These measures are used in various fields such as data analysis, machine learning, and pattern recognition. They
help to compare and analyze similarities and differences between different data sets or strings, which
can be useful for making predictions, classifications, and decisions.
---
References:
en.wikipedia.org
cran.r-project.org
numerics.mathdotnet.com
github.com
github.com
github.com
Encyclopedia of Distances, doi.org
ssd(p, q)
Sum of squared difference for N dimensions.
Parameters:
p (float ) : `array` Vector with first numeric distribution.
q (float ) : `array` Vector with second numeric distribution.
Returns: Measure of distance that calculates the squared euclidean distance.
euclidean(p, q)
Euclidean distance for N dimensions.
Parameters:
p (float ) : `array` Vector with first numeric distribution.
q (float ) : `array` Vector with second numeric distribution.
Returns: Measure of distance that calculates the straight-line (or Euclidean).
manhattan(p, q)
Manhattan distance for N dimensions.
Parameters:
p (float ) : `array` Vector with first numeric distribution.
q (float ) : `array` Vector with second numeric distribution.
Returns: Measure of absolute differences between both points.
minkowski(p, q, p_value)
Minkowsky Distance for N dimensions.
Parameters:
p (float ) : `array` Vector with first numeric distribution.
q (float ) : `array` Vector with second numeric distribution.
p_value (float) : `float` P value, default=1.0(1: manhatan, 2: euclidean), does not support chebychev.
Returns: Measure of similarity in the normed vector space.
chebyshev(p, q)
Chebyshev distance for N dimensions.
Parameters:
p (float ) : `array` Vector with first numeric distribution.
q (float ) : `array` Vector with second numeric distribution.
Returns: Measure of maximum absolute difference.
correlation(p, q)
Correlation distance for N dimensions.
Parameters:
p (float ) : `array` Vector with first numeric distribution.
q (float ) : `array` Vector with second numeric distribution.
Returns: Measure of maximum absolute difference.
cosine(p, q)
Cosine distance between provided vectors.
Parameters:
p (float ) : `array` 1D Vector.
q (float ) : `array` 1D Vector.
Returns: The Cosine distance between vectors `p` and `q`.
---
angiogenesis.dkfz.de
camberra(p, q)
Camberra distance for N dimensions.
Parameters:
p (float ) : `array` Vector with first numeric distribution.
q (float ) : `array` Vector with second numeric distribution.
Returns: Weighted measure of absolute differences between both points.
mae(p, q)
Mean absolute error is a normalized version of the sum of absolute difference (manhattan).
Parameters:
p (float ) : `array` Vector with first numeric distribution.
q (float ) : `array` Vector with second numeric distribution.
Returns: Mean absolute error of vectors `p` and `q`.
mse(p, q)
Mean squared error is a normalized version of the sum of squared difference.
Parameters:
p (float ) : `array` Vector with first numeric distribution.
q (float ) : `array` Vector with second numeric distribution.
Returns: Mean squared error of vectors `p` and `q`.
lorentzian(p, q)
Lorentzian distance between provided vectors.
Parameters:
p (float ) : `array` Vector with first numeric distribution.
q (float ) : `array` Vector with second numeric distribution.
Returns: Lorentzian distance of vectors `p` and `q`.
---
angiogenesis.dkfz.de
intersection(p, q)
Intersection distance between provided vectors.
Parameters:
p (float ) : `array` Vector with first numeric distribution.
q (float ) : `array` Vector with second numeric distribution.
Returns: Intersection distance of vectors `p` and `q`.
---
angiogenesis.dkfz.de
penrose(p, q)
Penrose Shape distance between provided vectors.
Parameters:
p (float ) : `array` Vector with first numeric distribution.
q (float ) : `array` Vector with second numeric distribution.
Returns: Penrose shape distance of vectors `p` and `q`.
---
angiogenesis.dkfz.de
meehl(p, q)
Meehl distance between provided vectors.
Parameters:
p (float ) : `array` Vector with first numeric distribution.
q (float ) : `array` Vector with second numeric distribution.
Returns: Meehl distance of vectors `p` and `q`.
---
angiogenesis.dkfz.de
edit(x, y)
Edit (aka Levenshtein) distance for indexed strings.
Parameters:
x (int ) : `array` Indexed array.
y (int ) : `array` Indexed array.
Returns: Number of deletions, insertions, or substitutions required to transform source string into target string.
---
generated description:
The Edit distance is a measure of similarity used to compare two strings. It is defined as the minimum number of
operations (insertions, deletions, or substitutions) required to transform one string into another. The operations
are performed on the characters of the strings, and the cost of each operation depends on the specific algorithm
used.
The Edit distance is widely used in various applications such as spell checking, text similarity, and machine
translation. It can also be used for other purposes like finding the closest match between two strings or
identifying the common prefixes or suffixes between them.
---
github.com
www.red-gate.com
planetcalc.com
lee(x, y, dsize)
Distance between two indexed strings of equal length.
Parameters:
x (int ) : `array` Indexed array.
y (int ) : `array` Indexed array.
dsize (int) : `int` Dictionary size.
Returns: Distance between two strings by accounting for dictionary size.
---
www.johndcook.com
hamming(x, y)
Distance between two indexed strings of equal length.
Parameters:
x (int ) : `array` Indexed array.
y (int ) : `array` Indexed array.
Returns: Length of different components on both sequences.
---
en.wikipedia.org
jaro(x, y)
Distance between two indexed strings.
Parameters:
x (int ) : `array` Indexed array.
y (int ) : `array` Indexed array.
Returns: Measure of two strings' similarity: the higher the value, the more similar the strings are.
The score is normalized such that `0` equates to no similarities and `1` is an exact match.
---
rosettacode.org
mahalanobis(p, q, VI)
Mahalanobis distance between two vectors with population inverse covariance matrix.
Parameters:
p (float ) : `array` 1D Vector.
q (float ) : `array` 1D Vector.
VI (matrix) : `matrix` Inverse of the covariance matrix.
Returns: The mahalanobis distance between vectors `p` and `q`.
---
people.revoledu.com
stat.ethz.ch
docs.scipy.org
fidelity(p, q)
Fidelity distance between provided vectors.
Parameters:
p (float ) : `array` 1D Vector.
q (float ) : `array` 1D Vector.
Returns: The Bhattacharyya Coefficient between vectors `p` and `q`.
---
en.wikipedia.org
bhattacharyya(p, q)
Bhattacharyya distance between provided vectors.
Parameters:
p (float ) : `array` 1D Vector.
q (float ) : `array` 1D Vector.
Returns: The Bhattacharyya distance between vectors `p` and `q`.
---
en.wikipedia.org
hellinger(p, q)
Hellinger distance between provided vectors.
Parameters:
p (float ) : `array` 1D Vector.
q (float ) : `array` 1D Vector.
Returns: The hellinger distance between vectors `p` and `q`.
---
en.wikipedia.org
jamesmccaffrey.wordpress.com
kumar_hassebrook(p, q)
Kumar Hassebrook distance between provided vectors.
Parameters:
p (float ) : `array` 1D Vector.
q (float ) : `array` 1D Vector.
Returns: The Kumar Hassebrook distance between vectors `p` and `q`.
---
github.com
jaccard(p, q)
Jaccard distance between provided vectors.
Parameters:
p (float ) : `array` 1D Vector.
q (float ) : `array` 1D Vector.
Returns: The Jaccard distance between vectors `p` and `q`.
---
github.com
sorensen(p, q)
Sorensen distance between provided vectors.
Parameters:
p (float ) : `array` 1D Vector.
q (float ) : `array` 1D Vector.
Returns: The Sorensen distance between vectors `p` and `q`.
---
people.revoledu.com
chi_square(p, q, eps)
Chi Square distance between provided vectors.
Parameters:
p (float ) : `array` 1D Vector.
q (float ) : `array` 1D Vector.
eps (float)
Returns: The Chi Square distance between vectors `p` and `q`.
---
uw.pressbooks.pub
stats.stackexchange.com
www.itl.nist.gov
kulczynsky(p, q, eps)
Kulczynsky distance between provided vectors.
Parameters:
p (float ) : `array` 1D Vector.
q (float ) : `array` 1D Vector.
eps (float)
Returns: The Kulczynsky distance between vectors `p` and `q`.
---
github.com

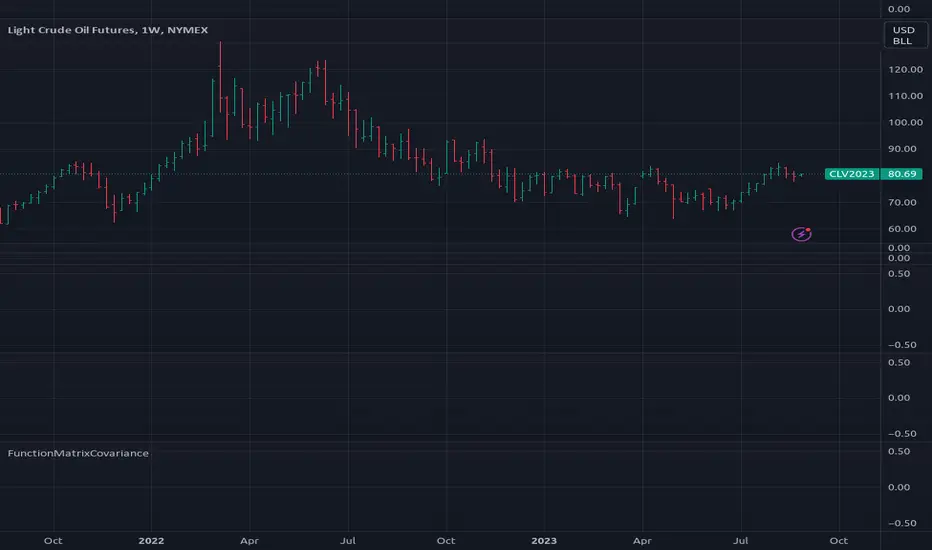
FunctionMatrixCovarianceLibrary "FunctionMatrixCovariance"
In probability theory and statistics, a covariance matrix (also known as auto-covariance matrix, dispersion matrix, variance matrix, or variance–covariance matrix) is a square matrix giving the covariance between each pair of elements of a given random vector.
Intuitively, the covariance matrix generalizes the notion of variance to multiple dimensions. As an example, the variation in a collection of random points in two-dimensional space cannot be characterized fully by a single number, nor would the variances in the `x` and `y` directions contain all of the necessary information; a `2 × 2` matrix would be necessary to fully characterize the two-dimensional variation.
Any covariance matrix is symmetric and positive semi-definite and its main diagonal contains variances (i.e., the covariance of each element with itself).
The covariance matrix of a random vector `X` is typically denoted by `Kxx`, `Σ` or `S`.
~wikipedia.
method cov(M, bias)
Estimate Covariance matrix with provided data.
Namespace types: matrix
Parameters:
M (matrix) : `matrix` Matrix with vectors in column order.
bias (bool)
Returns: Covariance matrix of provided vectors.
---
en.wikipedia.org
numpy.org
Vector3Library "Vector3"
Representation of 3D vectors and points.
This structure is used to pass 3D positions and directions around. It also contains functions for doing common vector operations.
Besides the functions listed below, other classes can be used to manipulate vectors and points as well.
For example the Quaternion and the Matrix4x4 classes are useful for rotating or transforming vectors and points.
___
**Reference:**
- github.com
- github.com
- github.com
- www.movable-type.co.uk
- docs.unity3d.com
- referencesource.microsoft.com
- github.com
\
new(x, y, z)
Create a new `Vector3`.
Parameters:
x (float) : `float` Property `x` value, (optional, default=na).
y (float) : `float` Property `y` value, (optional, default=na).
z (float) : `float` Property `z` value, (optional, default=na).
Returns: `Vector3` Generated new vector.
___
**Usage:**
```
.new(1.1, 1, 1)
```
from(value)
Create a new `Vector3` from a single value.
Parameters:
value (float) : `float` Properties positional value, (optional, default=na).
Returns: `Vector3` Generated new vector.
___
**Usage:**
```
.from(1.1)
```
from_Array(values, fill_na)
Create a new `Vector3` from a list of values, only reads up to the third item.
Parameters:
values (float ) : `array` Vector property values.
fill_na (float) : `float` Parameter value to replace missing indexes, (optional, defualt=na).
Returns: `Vector3` Generated new vector.
___
**Notes:**
- Supports any size of array, fills non available fields with `na`.
___
**Usage:**
```
.from_Array(array.from(1.1, fill_na=33))
.from_Array(array.from(1.1, 2, 3))
```
from_Vector2(values)
Create a new `Vector3` from a `Vector2`.
Parameters:
values (Vector2 type from RicardoSantos/CommonTypesMath/1) : `Vector2` Vector property values.
Returns: `Vector3` Generated new vector.
___
**Usage:**
```
.from:Vector2(.Vector2.new(1, 2.0))
```
___
**Notes:**
- Type `Vector2` from CommonTypesMath library.
from_Quaternion(values)
Create a new `Vector3` from a `Quaternion`'s `x, y, z` properties.
Parameters:
values (Quaternion type from RicardoSantos/CommonTypesMath/1) : `Quaternion` Vector property values.
Returns: `Vector3` Generated new vector.
___
**Usage:**
```
.from_Quaternion(.Quaternion.new(1, 2, 3, 4))
```
___
**Notes:**
- Type `Quaternion` from CommonTypesMath library.
from_String(expression, separator, fill_na)
Create a new `Vector3` from a list of values in a formated string.
Parameters:
expression (string) : `array` String with the list of vector properties.
separator (string) : `string` Separator between entries, (optional, default=`","`).
fill_na (float) : `float` Parameter value to replace missing indexes, (optional, defualt=na).
Returns: `Vector3` Generated new vector.
___
**Notes:**
- Supports any size of array, fills non available fields with `na`.
- `",,"` Empty fields will be ignored.
___
**Usage:**
```
.from_String("1.1", fill_na=33))
.from_String("(1.1,, 3)") // 1.1 , 3.0, NaN // empty field will be ignored!!
```
back()
Create a new `Vector3` object in the form `(0, 0, -1)`.
Returns: `Vector3` Generated new vector.
___
**Usage:**
```
.back()
```
front()
Create a new `Vector3` object in the form `(0, 0, 1)`.
Returns: `Vector3` Generated new vector.
___
**Usage:**
```
.front()
```
up()
Create a new `Vector3` object in the form `(0, 1, 0)`.
Returns: `Vector3` Generated new vector.
___
**Usage:**
```
.up()
```
down()
Create a new `Vector3` object in the form `(0, -1, 0)`.
Returns: `Vector3` Generated new vector.
___
**Usage:**
```
.down()
```
left()
Create a new `Vector3` object in the form `(-1, 0, 0)`.
Returns: `Vector3` Generated new vector.
___
**Usage:**
```
.left()
```
right()
Create a new `Vector3` object in the form `(1, 0, 0)`.
Returns: `Vector3` Generated new vector.
___
**Usage:**
```
.right()
```
zero()
Create a new `Vector3` object in the form `(0, 0, 0)`.
Returns: `Vector3` Generated new vector.
___
**Usage:**
```
.zero()
```
one()
Create a new `Vector3` object in the form `(1, 1, 1)`.
Returns: `Vector3` Generated new vector.
___
**Usage:**
```
.one()
```
minus_one()
Create a new `Vector3` object in the form `(-1, -1, -1)`.
Returns: `Vector3` Generated new vector.
___
**Usage:**
```
.minus_one()
```
unit_x()
Create a new `Vector3` object in the form `(1, 0, 0)`.
Returns: `Vector3` Generated new vector.
___
**Usage:**
```
.unit_x()
```
unit_y()
Create a new `Vector3` object in the form `(0, 1, 0)`.
Returns: `Vector3` Generated new vector.
___
**Usage:**
```
.unit_y()
```
unit_z()
Create a new `Vector3` object in the form `(0, 0, 1)`.
Returns: `Vector3` Generated new vector.
___
**Usage:**
```
.unit_z()
```
nan()
Create a new `Vector3` object in the form `(na, na, na)`.
Returns: `Vector3` Generated new vector.
___
**Usage:**
```
.nan()
```
random(max, min)
Generate a vector with random properties.
Parameters:
max (Vector3 type from RicardoSantos/CommonTypesMath/1) : `Vector3` Maximum defined range of the vector properties.
min (Vector3 type from RicardoSantos/CommonTypesMath/1) : `Vector3` Minimum defined range of the vector properties.
Returns: `Vector3` Generated new vector.
___
**Usage:**
```
.random(.from(math.pi), .from(-math.pi))
```
random(max)
Generate a vector with random properties (min set to 0.0).
Parameters:
max (Vector3 type from RicardoSantos/CommonTypesMath/1) : `Vector3` Maximum defined range of the vector properties.
Returns: `Vector3` Generated new vector.
___
**Usage:**
```
.random(.from(math.pi))
```
method copy(this)
Copy a existing `Vector3`
Namespace types: TMath.Vector3
Parameters:
this (Vector3 type from RicardoSantos/CommonTypesMath/1) : `Vector3` Source vector.
Returns: `Vector3` Generated new vector.
___
**Usage:**
```
a = .one().copy()
```
method i_add(this, other)
Modify a instance of a vector by adding a vector to it.
Namespace types: TMath.Vector3
Parameters:
this (Vector3 type from RicardoSantos/CommonTypesMath/1) : `Vector3` Source vector.
other (Vector3 type from RicardoSantos/CommonTypesMath/1) : `Vector3` Other Vector.
Returns: `Vector3` Updated source vector.
___
**Usage:**
```
a = .from(1) , a.i_add(.up())
```
method i_add(this, value)
Modify a instance of a vector by adding a vector to it.
Namespace types: TMath.Vector3
Parameters:
this (Vector3 type from RicardoSantos/CommonTypesMath/1) : `Vector3` Source vector.
value (float) : `float` Value.
Returns: `Vector3` Updated source vector.
___
**Usage:**
```
a = .from(1) , a.i_add(3.2)
```
method i_subtract(this, other)
Modify a instance of a vector by subtracting a vector to it.
Namespace types: TMath.Vector3
Parameters:
this (Vector3 type from RicardoSantos/CommonTypesMath/1) : `Vector3` Source vector.
other (Vector3 type from RicardoSantos/CommonTypesMath/1) : `Vector3` Other Vector.
Returns: `Vector3` Updated source vector.
___
**Usage:**
```
a = .from(1) , a.i_subtract(.down())
```
method i_subtract(this, value)
Modify a instance of a vector by subtracting a vector to it.
Namespace types: TMath.Vector3
Parameters:
this (Vector3 type from RicardoSantos/CommonTypesMath/1) : `Vector3` Source vector.
value (float) : `float` Value.
Returns: `Vector3` Updated source vector.
___
**Usage:**
```
a = .from(1) , a.i_subtract(3)
```
method i_multiply(this, other)
Modify a instance of a vector by multiplying a vector with it.
Namespace types: TMath.Vector3
Parameters:
this (Vector3 type from RicardoSantos/CommonTypesMath/1) : `Vector3` Source vector.
other (Vector3 type from RicardoSantos/CommonTypesMath/1) : `Vector3` Other Vector.
Returns: `Vector3` Updated source vector.
___
**Usage:**
```
a = .from(1) , a.i_multiply(.left())
```
method i_multiply(this, value)
Modify a instance of a vector by multiplying a vector with it.
Namespace types: TMath.Vector3
Parameters:
this (Vector3 type from RicardoSantos/CommonTypesMath/1) : `Vector3` Source vector.
value (float) : `float` value.
Returns: `Vector3` Updated source vector.
___
**Usage:**
```
a = .from(1) , a.i_multiply(3)
```
method i_divide(this, other)
Modify a instance of a vector by dividing it by another vector.
Namespace types: TMath.Vector3
Parameters:
this (Vector3 type from RicardoSantos/CommonTypesMath/1) : `Vector3` Source vector.
other (Vector3 type from RicardoSantos/CommonTypesMath/1) : `Vector3` Other Vector.
Returns: `Vector3` Updated source vector.
___
**Usage:**
```
a = .from(1) , a.i_divide(.forward())
```
method i_divide(this, value)
Modify a instance of a vector by dividing it by another vector.
Namespace types: TMath.Vector3
Parameters:
this (Vector3 type from RicardoSantos/CommonTypesMath/1) : `Vector3` Source vector.
value (float) : `float` Value.
Returns: `Vector3` Updated source vector.
___
**Usage:**
```
a = .from(1) , a.i_divide(3)
```
method i_mod(this, other)
Modify a instance of a vector by modulo assignment with another vector.
Namespace types: TMath.Vector3
Parameters:
this (Vector3 type from RicardoSantos/CommonTypesMath/1) : `Vector3` Source vector.
other (Vector3 type from RicardoSantos/CommonTypesMath/1) : `Vector3` Other Vector.
Returns: `Vector3` Updated source vector.
___
**Usage:**
```
a = .from(1) , a.i_mod(.back())
```
method i_mod(this, value)
Modify a instance of a vector by modulo assignment with another vector.
Namespace types: TMath.Vector3
Parameters:
this (Vector3 type from RicardoSantos/CommonTypesMath/1) : `Vector3` Source vector.
value (float) : `float` Value.
Returns: `Vector3` Updated source vector.
___
**Usage:**
```
a = .from(1) , a.i_mod(3)
```
method i_pow(this, exponent)
Modify a instance of a vector by modulo assignment with another vector.
Namespace types: TMath.Vector3
Parameters:
this (Vector3 type from RicardoSantos/CommonTypesMath/1) : `Vector3` Source vector.
exponent (Vector3 type from RicardoSantos/CommonTypesMath/1) : `Vector3` Exponent Vector.
Returns: `Vector3` Updated source vector.
___
**Usage:**
```
a = .from(1) , a.i_pow(.up())
```
method i_pow(this, exponent)
Modify a instance of a vector by modulo assignment with another vector.
Namespace types: TMath.Vector3
Parameters:
this (Vector3 type from RicardoSantos/CommonTypesMath/1) : `Vector3` Source vector.
exponent (float) : `float` Exponent Value.
Returns: `Vector3` Updated source vector.
___
**Usage:**
```
a = .from(1) , a.i_pow(2)
```
method length_squared(this)
Squared length of the vector.
Namespace types: TMath.Vector3
Parameters:
this (Vector3 type from RicardoSantos/CommonTypesMath/1)
Returns: `float` The squared length of this vector.
___
**Usage:**
```
a = .one().length_squared()
```
method magnitude_squared(this)
Squared magnitude of the vector.
Namespace types: TMath.Vector3
Parameters:
this (Vector3 type from RicardoSantos/CommonTypesMath/1) : `Vector3` Source vector.
Returns: `float` The length squared of this vector.
___
**Usage:**
```
a = .one().magnitude_squared()
```
method length(this)
Length of the vector.
Namespace types: TMath.Vector3
Parameters:
this (Vector3 type from RicardoSantos/CommonTypesMath/1) : `Vector3` Source vector.
Returns: `float` The length of this vector.
___
**Usage:**
```
a = .one().length()
```
method magnitude(this)
Magnitude of the vector.
Namespace types: TMath.Vector3
Parameters:
this (Vector3 type from RicardoSantos/CommonTypesMath/1) : `Vector3` Source vector.
Returns: `float` The Length of this vector.
___
**Usage:**
```
a = .one().magnitude()
```
method normalize(this, magnitude, eps)
Normalize a vector with a magnitude of 1(optional).
Namespace types: TMath.Vector3
Parameters:
this (Vector3 type from RicardoSantos/CommonTypesMath/1) : `Vector3` Source vector.
magnitude (float) : `float` Value to manipulate the magnitude of normalization, (optional, default=1.0).
eps (float)
Returns: `Vector3` Generated new vector.
___
**Usage:**
```
a = .new(33, 50, 100).normalize() // (x=0.283, y=0.429, z=0.858)
a = .new(33, 50, 100).normalize(2) // (x=0.142, y=0.214, z=0.429)
```
method to_String(this, precision)
Converts source vector to a string format, in the form `"(x, y, z)"`.
Namespace types: TMath.Vector3
Parameters:
this (Vector3 type from RicardoSantos/CommonTypesMath/1) : `Vector3` Source vector.
precision (string) : `string` Precision format to apply to values (optional, default='').
Returns: `string` Formated string in a `"(x, y, z)"` format.
___
**Usage:**
```
a = .one().to_String("#.###")
```
method to_Array(this)
Converts source vector to a array format.
Namespace types: TMath.Vector3
Parameters:
this (Vector3 type from RicardoSantos/CommonTypesMath/1) : `Vector3` Source vector.
Returns: `array` List of the vector properties.
___
**Usage:**
```
a = .new(1, 2, 3).to_Array()
```
method to_Vector2(this)
Converts source vector to a Vector2 in the form `x, y`.
Namespace types: TMath.Vector3
Parameters:
this (Vector3 type from RicardoSantos/CommonTypesMath/1) : `Vector3` Source vector.
Returns: `Vector2` Generated new vector.
___
**Usage:**
```
a = .from(1).to_Vector2()
```
method to_Quaternion(this, w)
Converts source vector to a Quaternion in the form `x, y, z, w`.
Namespace types: TMath.Vector3
Parameters:
this (Vector3 type from RicardoSantos/CommonTypesMath/1) : `Vector3` Sorce vector.
w (float) : `float` Property of `w` new value.
Returns: `Quaternion` Generated new vector.
___
**Usage:**
```
a = .from(1).to_Quaternion(w=1)
```
method add(this, other)
Add a vector to source vector.
Namespace types: TMath.Vector3
Parameters:
this (Vector3 type from RicardoSantos/CommonTypesMath/1) : `Vector3` Source vector.
other (Vector3 type from RicardoSantos/CommonTypesMath/1) : `Vector3` Other vector.
Returns: `Vector3` Generated new vector.
___
**Usage:**
```
a = .from(1).add(.unit_z())
```
method add(this, value)
Add a value to each property of the vector.
Namespace types: TMath.Vector3
Parameters:
this (Vector3 type from RicardoSantos/CommonTypesMath/1) : `Vector3` Source vector.
value (float) : `float` Value.
Returns: `Vector3` Generated new vector.
___
**Usage:**
```
a = .from(1).add(2.0)
```
add(value, other)
Add each property of a vector to a base value as a new vector.
Parameters:
value (float) : `float` Value.
other (Vector3 type from RicardoSantos/CommonTypesMath/1) : `Vector3` Vector.
Returns: `Vector3` Generated new vector.
___
**Usage:**
```
a = .from(2) , b = .add(1.0, a)
```
method subtract(this, other)
Subtract vector from source vector.
Namespace types: TMath.Vector3
Parameters:
this (Vector3 type from RicardoSantos/CommonTypesMath/1) : `Vector3` Source vector.
other (Vector3 type from RicardoSantos/CommonTypesMath/1) : `Vector3` Other vector.
Returns: `Vector3` Generated new vector.
___
**Usage:**
```
a = .from(1).subtract(.left())
```
method subtract(this, value)
Subtract a value from each property in source vector.
Namespace types: TMath.Vector3
Parameters:
this (Vector3 type from RicardoSantos/CommonTypesMath/1) : `Vector3` Source vector.
value (float) : `float` Value.
Returns: `Vector3` Generated new vector.
___
**Usage:**
```
a = .from(1).subtract(2.0)
```
subtract(value, other)
Subtract each property in a vector from a base value and create a new vector.
Parameters:
value (float) : `float` Value.
other (Vector3 type from RicardoSantos/CommonTypesMath/1) : `Vector3` Vector.
Returns: `Vector3` Generated new vector.
___
**Usage:**
```
a = .subtract(1.0, .right())
```
method multiply(this, other)
Multiply a vector by another.
Namespace types: TMath.Vector3
Parameters:
this (Vector3 type from RicardoSantos/CommonTypesMath/1) : `Vector3` Source vector.
other (Vector3 type from RicardoSantos/CommonTypesMath/1) : `Vector3` Other vector.
Returns: `Vector3` Generated new vector.
___
**Usage:**
```
a = .from(1).multiply(.up())
```
method multiply(this, value)
Multiply each element in source vector with a value.
Namespace types: TMath.Vector3
Parameters:
this (Vector3 type from RicardoSantos/CommonTypesMath/1) : `Vector3` Source vector.
value (float) : `float` Value.
Returns: `Vector3` Generated new vector.
___
**Usage:**
```
a = .from(1).multiply(2.0)
```
multiply(value, other)
Multiply a value with each property in a vector and create a new vector.
Parameters:
value (float) : `float` Value.
other (Vector3 type from RicardoSantos/CommonTypesMath/1) : `Vector3` Vector.
Returns: `Vector3` Generated new vector.
___
**Usage:**
```
a = .multiply(1.0, .new(1, 2, 1))
```
method divide(this, other)
Divide a vector by another.
Namespace types: TMath.Vector3
Parameters:
this (Vector3 type from RicardoSantos/CommonTypesMath/1) : `Vector3` Source vector.
other (Vector3 type from RicardoSantos/CommonTypesMath/1) : `Vector3` Other vector.
Returns: `Vector3` Generated new vector.
___
**Usage:**
```
a = .from(1).divide(.from(2))
```
method divide(this, value)
Divide each property in a vector by a value.
Namespace types: TMath.Vector3
Parameters:
this (Vector3 type from RicardoSantos/CommonTypesMath/1) : `Vector3` Source vector.
value (float) : `float` Value.
Returns: `Vector3` Generated new vector.
___
**Usage:**
```
a = .from(1).divide(2.0)
```
divide(value, other)
Divide a base value by each property in a vector and create a new vector.
Parameters:
value (float) : `float` Value.
other (Vector3 type from RicardoSantos/CommonTypesMath/1) : `Vector3` Vector.
Returns: `Vector3` Generated new vector.
___
**Usage:**
```
a = .divide(1.0, .from(2))
```
method mod(this, other)
Modulo a vector by another.
Namespace types: TMath.Vector3
Parameters:
this (Vector3 type from RicardoSantos/CommonTypesMath/1) : `Vector3` Source vector.
other (Vector3 type from RicardoSantos/CommonTypesMath/1) : `Vector3` Other vector.
Returns: `Vector3` Generated new vector.
___
**Usage:**
```
a = .from(1).mod(.from(2))
```
method mod(this, value)
Modulo each property in a vector by a value.
Namespace types: TMath.Vector3
Parameters:
this (Vector3 type from RicardoSantos/CommonTypesMath/1) : `Vector3` Source vector.
value (float) : `float` Value.
Returns: `Vector3` Generated new vector.
___
**Usage:**
```
a = .from(1).mod(2.0)
```
mod(value, other)
Modulo a base value by each property in a vector and create a new vector.
Parameters:
value (float) : `float` Value.
other (Vector3 type from RicardoSantos/CommonTypesMath/1) : `Vector3` Vector.
Returns: `Vector3` Generated new vector.
___
**Usage:**
```
a = .mod(1.0, .from(2))
```
method negate(this)
Negate a vector in the form `(zero - this)`.
Namespace types: TMath.Vector3
Parameters:
this (Vector3 type from RicardoSantos/CommonTypesMath/1) : `Vector3` Source vector.
Returns: `Vector3` Generated new vector.
___
**Usage:**
```
a = .one().negate()
```
method pow(this, other)
Modulo a vector by another.
Namespace types: TMath.Vector3
Parameters:
this (Vector3 type from RicardoSantos/CommonTypesMath/1) : `Vector3` Source vector.
other (Vector3 type from RicardoSantos/CommonTypesMath/1) : `Vector3` Other vector.
Returns: `Vector3` Generated new vector.
___
**Usage:**
```
a = .from(2).pow(.from(3))
```
method pow(this, exponent)
Raise the vector elements by a exponent.
Namespace types: TMath.Vector3
Parameters:
this (Vector3 type from RicardoSantos/CommonTypesMath/1) : `Vector3` Source vector.
exponent (float) : `float` The exponent to raise the vector by.
Returns: `Vector3` Generated new vector.
___
**Usage:**
```
a = .from(1).pow(2.0)
```
pow(value, exponent)
Raise value into a vector raised by the elements in exponent vector.
Parameters:
value (float) : `float` Base value.
exponent (Vector3 type from RicardoSantos/CommonTypesMath/1) : `Vector3` The exponent to raise the vector of base value by.
Returns: `Vector3` Generated new vector.
___
**Usage:**
```
a = .pow(1.0, .from(2))
```
method sqrt(this)
Square root of the elements in a vector.
Namespace types: TMath.Vector3
Parameters:
this (Vector3 type from RicardoSantos/CommonTypesMath/1) : `Vector3` Source vector.
Returns: `Vector3` Generated new vector.
___
**Usage:**
```
a = .from(1).sqrt()
```
method abs(this)
Absolute properties of the vector.
Namespace types: TMath.Vector3
Parameters:
this (Vector3 type from RicardoSantos/CommonTypesMath/1) : `Vector3` Source vector.
Returns: `Vector3` Generated new vector.
___
**Usage:**
```
a = .from(1).abs()
```
method max(this)
Highest property of the vector.
Namespace types: TMath.Vector3
Parameters:
this (Vector3 type from RicardoSantos/CommonTypesMath/1) : `Vector3` Source vector.
Returns: `float` Highest value amongst the vector properties.
___
**Usage:**
```
a = .new(1, 2, 3).max()
```
method min(this)
Lowest element of the vector.
Namespace types: TMath.Vector3
Parameters:
this (Vector3 type from RicardoSantos/CommonTypesMath/1) : `Vector3` Source vector.
Returns: `float` Lowest values amongst the vector properties.
___
**Usage:**
```
a = .new(1, 2, 3).min()
```
method floor(this)
Floor of vector a.
Namespace types: TMath.Vector3
Parameters:
this (Vector3 type from RicardoSantos/CommonTypesMath/1) : `Vector3` Source vector.
Returns: `Vector3` Generated new vector.
___
**Usage:**
```
a = .new(1.33, 1.66, 1.99).floor()
```
method ceil(this)
Ceil of vector a.
Namespace types: TMath.Vector3
Parameters:
this (Vector3 type from RicardoSantos/CommonTypesMath/1) : `Vector3` Source vector.
Returns: `Vector3` Generated new vector.
___
**Usage:**
```
a = .new(1.33, 1.66, 1.99).ceil()
```
method round(this)
Round of vector elements.
Namespace types: TMath.Vector3
Parameters:
this (Vector3 type from RicardoSantos/CommonTypesMath/1) : `Vector3` Source vector.
Returns: `Vector3` Generated new vector.
___
**Usage:**
```
a = .new(1.33, 1.66, 1.99).round()
```
method round(this, precision)
Round of vector elements to n digits.
Namespace types: TMath.Vector3
Parameters:
this (Vector3 type from RicardoSantos/CommonTypesMath/1) : `Vector3` Source vector.
precision (int) : `int` Number of digits to round the vector elements.
Returns: `Vector3` Generated new vector.
___
**Usage:**
```
a = .new(1.33, 1.66, 1.99).round(1) // 1.3, 1.7, 2
```
method fractional(this)
Fractional parts of vector.
Namespace types: TMath.Vector3
Parameters:
this (Vector3 type from RicardoSantos/CommonTypesMath/1) : `Vector3` Source vector.
Returns: `Vector3` Generated new vector.
___
**Usage:**
```
a = .from(1.337).fractional() // 0.337
```
method dot_product(this, other)
Dot product of two vectors.
Namespace types: TMath.Vector3
Parameters:
this (Vector3 type from RicardoSantos/CommonTypesMath/1) : `Vector3` Source vector.
other (Vector3 type from RicardoSantos/CommonTypesMath/1) : `Vector3` Other vector.
Returns: `float` Dot product.
___
**Usage:**
```
a = .from(2).dot_product(.left())
```
method cross_product(this, other)
Cross product of two vectors.
Namespace types: TMath.Vector3
Parameters:
this (Vector3 type from RicardoSantos/CommonTypesMath/1) : `Vector3` Source vector.
other (Vector3 type from RicardoSantos/CommonTypesMath/1) : `Vector3` Other vector.
Returns: `Vector3` Generated new vector.
___
**Usage:**
```
a = .from(1).cross_produc(.right())
```
method scale(this, scalar)
Scale vector by a scalar value.
Namespace types: TMath.Vector3
Parameters:
this (Vector3 type from RicardoSantos/CommonTypesMath/1) : `Vector3` Source vector.
scalar (float) : `float` Value to scale the the vector by.
Returns: `Vector3` Generated new vector.
___
**Usage:**
```
a = .from(1).scale(2)
```
method rescale(this, magnitude)
Rescale a vector to a new magnitude.
Namespace types: TMath.Vector3
Parameters:
this (Vector3 type from RicardoSantos/CommonTypesMath/1) : `Vector3` Source vector.
magnitude (float) : `float` Value to manipulate the magnitude of normalization.
Returns: `Vector3` Generated new vector.
___
**Usage:**
```
a = .from(20).rescale(1)
```
method equals(this, other)
Compares two vectors.
Namespace types: TMath.Vector3
Parameters:
this (Vector3 type from RicardoSantos/CommonTypesMath/1) : `Vector3` Source vector.
other (Vector3 type from RicardoSantos/CommonTypesMath/1) : `Vector3` Other vector.
Returns: `Vector3` Generated new vector.
___
**Usage:**
```
a = .from(1).equals(.one())
```
method sin(this)
Sine of vector.
Namespace types: TMath.Vector3
Parameters:
this (Vector3 type from RicardoSantos/CommonTypesMath/1) : `Vector3` Source vector.
Returns: `Vector3` Generated new vector.
___
**Usage:**
```
a = .from(1).sin()
```
method cos(this)
Cosine of vector.
Namespace types: TMath.Vector3
Parameters:
this (Vector3 type from RicardoSantos/CommonTypesMath/1) : `Vector3` Source vector.
Returns: `Vector3` Generated new vector.
___
**Usage:**
```
a = .from(1).cos()
```
method tan(this)
Tangent of vector.
Namespace types: TMath.Vector3
Parameters:
this (Vector3 type from RicardoSantos/CommonTypesMath/1) : `Vector3` Source vector.
Returns: `Vector3` Generated new vector.
___
**Usage:**
```
a = .from(1).tan()
```
vmax(a, b)
Highest elements of the properties from two vectors.
Parameters:
a (Vector3 type from RicardoSantos/CommonTypesMath/1) : `Vector3` Vector.
b (Vector3 type from RicardoSantos/CommonTypesMath/1) : `Vector3` Vector.
Returns: `Vector3` Generated new vector.
___
**Usage:**
```
a = .vmax(.one(), .from(2))
```
vmax(a, b, c)
Highest elements of the properties from three vectors.
Parameters:
a (Vector3 type from RicardoSantos/CommonTypesMath/1) : `Vector3` Vector.
b (Vector3 type from RicardoSantos/CommonTypesMath/1) : `Vector3` Vector.
c (Vector3 type from RicardoSantos/CommonTypesMath/1) : `Vector3` Vector.
Returns: `Vector3` Generated new vector.
___
**Usage:**
```
a = .vmax(.new(0.1, 2.5, 3.4), .from(2), .from(3))
```
vmin(a, b)
Lowest elements of the properties from two vectors.
Parameters:
a (Vector3 type from RicardoSantos/CommonTypesMath/1) : `Vector3` Vector.
b (Vector3 type from RicardoSantos/CommonTypesMath/1) : `Vector3` Vector.
Returns: `Vector3` Generated new vector.
___
**Usage:**
```
a = .vmin(.one(), .from(2))
```
vmin(a, b, c)
Lowest elements of the properties from three vectors.
Parameters:
a (Vector3 type from RicardoSantos/CommonTypesMath/1) : `Vector3` Vector.
b (Vector3 type from RicardoSantos/CommonTypesMath/1) : `Vector3` Vector.
c (Vector3 type from RicardoSantos/CommonTypesMath/1) : `Vector3` Vector.
Returns: `Vector3` Generated new vector.
___
**Usage:**
```
a = .vmin(.one(), .from(2), .new(3.3, 2.2, 0.5))
```
distance(a, b)
Distance between vector `a` and `b`.
Parameters:
a (Vector3 type from RicardoSantos/CommonTypesMath/1) : `Vector3` Source vector.
b (Vector3 type from RicardoSantos/CommonTypesMath/1) : `Vector3` Target vector.
Returns: `Vector3` Generated new vector.
___
**Usage:**
```
a = distance(.from(3), .unit_z())
```
clamp(a, min, max)
Restrict a vector between a min and max vector.
Parameters:
a (Vector3 type from RicardoSantos/CommonTypesMath/1) : `Vector3` Source vector.
min (Vector3 type from RicardoSantos/CommonTypesMath/1) : `Vector3` Minimum boundary vector.
max (Vector3 type from RicardoSantos/CommonTypesMath/1) : `Vector3` Maximum boundary vector.
Returns: `Vector3` Generated new vector.
___
**Usage:**
```
a = .clamp(a=.new(2.9, 1.5, 3.9), min=.from(2), max=.new(2.5, 3.0, 3.5))
```
clamp_magnitude(a, radius)
Vector with its magnitude clamped to a radius.
Parameters:
a (Vector3 type from RicardoSantos/CommonTypesMath/1) : `Vector3` Source vector.object, vector with properties that should be restricted to a radius.
radius (float) : `float` Maximum radius to restrict magnitude of vector.
Returns: `Vector3` Generated new vector.
___
**Usage:**
```
a = .clamp_magnitude(.from(21), 7)
```
lerp_unclamped(a, b, rate)
`Unclamped` linearly interpolates between provided vectors by a rate.
Parameters:
a (Vector3 type from RicardoSantos/CommonTypesMath/1) : `Vector3` Source vector.
b (Vector3 type from RicardoSantos/CommonTypesMath/1) : `Vector3` Target vector.
rate (float) : `float` Rate of interpolation, range(0 > 1) where 0 == source vector and 1 == target vector.
Returns: `Vector3` Generated new vector.
___
**Usage:**
```
a = .lerp_unclamped(.from(1), .from(2), 1.2)
```
lerp(a, b, rate)
Linearly interpolates between provided vectors by a rate.
Parameters:
a (Vector3 type from RicardoSantos/CommonTypesMath/1) : `Vector3` Source vector.
b (Vector3 type from RicardoSantos/CommonTypesMath/1) : `Vector3` Target vector.
rate (float) : `float` Rate of interpolation, range(0 > 1) where 0 == source vector and 1 == target vector.
Returns: `Vector3` Generated new vector.
___
**Usage:**
```
a = lerp(.one(), .from(2), 0.2)
```
herp(start, start_tangent, end, end_tangent, rate)
Hermite curve interpolation between provided vectors.
Parameters:
start (Vector3 type from RicardoSantos/CommonTypesMath/1) : `Vector3` Start vector.
start_tangent (Vector3 type from RicardoSantos/CommonTypesMath/1) : `Vector3` Start vector tangent.
end (Vector3 type from RicardoSantos/CommonTypesMath/1) : `Vector3` End vector.
end_tangent (Vector3 type from RicardoSantos/CommonTypesMath/1) : `Vector3` End vector tangent.
rate (int) : `float` Rate of the movement from `start` to `end` to get position, should be range(0 > 1).
Returns: `Vector3` Generated new vector.
___
**Usage:**
```
s = .new(0, 0, 0) , st = .new(0, 1, 1)
e = .new(1, 2, 2) , et = .new(-1, -1, 3)
h = .herp(s, st, e, et, 0.3)
```
___
**Reference:** en.m.wikibooks.org
herp_2(a, b, rate)
Hermite curve interpolation between provided vectors.
Parameters:
a (Vector3 type from RicardoSantos/CommonTypesMath/1) : `Vector3` Source vector.
b (Vector3 type from RicardoSantos/CommonTypesMath/1) : `Vector3` Target vector.
rate (Vector3 type from RicardoSantos/CommonTypesMath/1) : `Vector3` Rate of the movement per component from `start` to `end` to get position, should be range(0 > 1).
Returns: `Vector3` Generated new vector.
___
**Usage:**
```
h = .herp_2(.one(), .new(0.1, 3, 2), 0.6)
```
noise(a)
3D Noise based on Morgan McGuire @morgan3d
Parameters:
a (Vector3 type from RicardoSantos/CommonTypesMath/1) : `Vector3` Source vector.
Returns: `Vector3` Generated new vector.
___
**Usage:**
```
a = noise(.one())
```
___
**Reference:**
- thebookofshaders.com
- www.shadertoy.com
rotate(a, axis, angle)
Rotate a vector around a axis.
Parameters:
a (Vector3 type from RicardoSantos/CommonTypesMath/1) : `Vector3` Source vector.
axis (string) : `string` The plane to rotate around, `option="x", "y", "z"`.
angle (float) : `float` Angle in radians.
Returns: `Vector3` Generated new vector.
___
**Usage:**
```
a = .rotate(.from(3), 'y', math.toradians(45.0))
```
rotate_x(a, angle)
Rotate a vector on a fixed `x`.
Parameters:
a (Vector3 type from RicardoSantos/CommonTypesMath/1) : `Vector3` Source vector.
angle (float) : `float` Angle in radians.
Returns: `Vector3` Generated new vector.
___
**Usage:**
```
a = .rotate_x(.from(3), math.toradians(90.0))
```
rotate_y(a, angle)
Rotate a vector on a fixed `y`.
Parameters:
a (Vector3 type from RicardoSantos/CommonTypesMath/1) : `Vector3` Source vector.
angle (float) : `float` Angle in radians.
Returns: `Vector3` Generated new vector.
___
**Usage:**
```
a = .rotate_y(.from(3), math.toradians(90.0))
```
rotate_yaw_pitch(a, yaw, pitch)
Rotate a vector by yaw and pitch values.
Parameters:
a (Vector3 type from RicardoSantos/CommonTypesMath/1) : `Vector3` Source vector.
yaw (float) : `float` Angle in radians.
pitch (float) : `float` Angle in radians.
Returns: `Vector3` Generated new vector.
___
**Usage:**
```
a = .rotate_yaw_pitch(.from(3), math.toradians(90.0), math.toradians(45.0))
```
project(a, normal, eps)
Project a vector off a plane defined by a normal.
Parameters:
a (Vector3 type from RicardoSantos/CommonTypesMath/1) : `Vector3` Source vector.
normal (Vector3 type from RicardoSantos/CommonTypesMath/1) : `Vector3` The normal of the surface being reflected off.
eps (float) : `float` Minimum resolution to void division by zero (default=0.000001).
Returns: `Vector3` Generated new vector.
___
**Usage:**
```
a = .project(.one(), .down())
```
project_on_plane(a, normal, eps)
Projects a vector onto a plane defined by a normal orthogonal to the plane.
Parameters:
a (Vector3 type from RicardoSantos/CommonTypesMath/1) : `Vector3` Source vector.
normal (Vector3 type from RicardoSantos/CommonTypesMath/1) : `Vector3` The normal of the surface being reflected off.
eps (float) : `float` Minimum resolution to void division by zero (default=0.000001).
Returns: `Vector3` Generated new vector.
___
**Usage:**
```
a = .project_on_plane(.one(), .left())
```
project_to_2d(a, camera_position, camera_target)
Project a vector onto a two dimensions plane.
Parameters:
a (Vector3 type from RicardoSantos/CommonTypesMath/1) : `Vector3` Source vector.
camera_position (Vector3 type from RicardoSantos/CommonTypesMath/1) : `Vector3` Camera position.
camera_target (Vector3 type from RicardoSantos/CommonTypesMath/1) : `Vector3` Camera target plane position.
Returns: `Vector2` Generated new vector.
___
**Usage:**
```
a = .project_to_2d(.one(), .new(2, 2, 3), .zero())
```
reflect(a, normal)
Reflects a vector off a plane defined by a normal.
Parameters:
a (Vector3 type from RicardoSantos/CommonTypesMath/1) : `Vector3` Source vector.
normal (Vector3 type from RicardoSantos/CommonTypesMath/1) : `Vector3` The normal of the surface being reflected off.
Returns: `Vector3` Generated new vector.
___
**Usage:**
```
a = .reflect(.one(), .right())
```
angle(a, b, eps)
Angle in degrees between two vectors.
Parameters:
a (Vector3 type from RicardoSantos/CommonTypesMath/1) : `Vector3` Source vector.
b (Vector3 type from RicardoSantos/CommonTypesMath/1) : `Vector3` Target vector.
eps (float) : `float` Minimum resolution to void division by zero (default=1.0e-15).
Returns: `float` Angle value in degrees.
___
**Usage:**
```
a = .angle(.one(), .up())
```
angle_signed(a, b, axis)
Signed angle in degrees between two vectors.
Parameters:
a (Vector3 type from RicardoSantos/CommonTypesMath/1) : `Vector3` Source vector.
b (Vector3 type from RicardoSantos/CommonTypesMath/1) : `Vector3` Target vector.
axis (Vector3 type from RicardoSantos/CommonTypesMath/1) : `Vector3` Axis vector.
Returns: `float` Angle value in degrees.
___
**Usage:**
```
a = .angle_signed(.one(), .left(), .down())
```
___
**Notes:**
- The smaller of the two possible angles between the two vectors is returned, therefore the result will never
be greater than 180 degrees or smaller than -180 degrees.
- If you imagine the from and to vectors as lines on a piece of paper, both originating from the same point,
then the /axis/ vector would point up out of the paper.
- The measured angle between the two vectors would be positive in a clockwise direction and negative in an
anti-clockwise direction.
___
**Reference:**
- github.com
angle2d(a, b)
2D angle between two vectors.
Parameters:
a (Vector3 type from RicardoSantos/CommonTypesMath/1) : `Vector3` Source vector.
b (Vector3 type from RicardoSantos/CommonTypesMath/1) : `Vector3` Target vector.
Returns: `float` Angle value in degrees.
___
**Usage:**
```
a = .angle2d(.one(), .left())
```
transform_Matrix(a, M)
Transforms a vector by the given matrix.
Parameters:
a (Vector3 type from RicardoSantos/CommonTypesMath/1) : `Vector3` Source vector.
M (matrix) : `matrix` A 4x4 matrix. The transformation matrix.
Returns: `Vector3` Generated new vector.
___
**Usage:**
```
mat = matrix.new(4, 0)
mat.add_row(0, array.from(0.0, 0.0, 0.0, 1.0))
mat.add_row(1, array.from(0.0, 0.0, 1.0, 0.0))
mat.add_row(2, array.from(0.0, 1.0, 0.0, 0.0))
mat.add_row(3, array.from(1.0, 0.0, 0.0, 0.0))
b = .transform_Matrix(.one(), mat)
```
transform_M44(a, M)
Transforms a vector by the given matrix.
Parameters:
a (Vector3 type from RicardoSantos/CommonTypesMath/1) : `Vector3` Source vector.
M (M44 type from RicardoSantos/CommonTypesMath/1) : `M44` A 4x4 matrix. The transformation matrix.
Returns: `Vector3` Generated new vector.
___
**Usage:**
```
a = .transform_M44(.one(), .M44.new(0,0,0,1,0,0,1,0,0,1,0,0,1,0,0,0))
```
___
**Notes:**
- Type `M44` from `CommonTypesMath` library.
transform_normal_Matrix(a, M)
Transforms a vector by the given matrix.
Parameters:
a (Vector3 type from RicardoSantos/CommonTypesMath/1) : `Vector3` Source vector.
M (matrix) : `matrix` A 4x4 matrix. The transformation matrix.
Returns: `Vector3` Generated new vector.
___
**Usage:**
```
mat = matrix.new(4, 0)
mat.add_row(0, array.from(0.0, 0.0, 0.0, 1.0))
mat.add_row(1, array.from(0.0, 0.0, 1.0, 0.0))
mat.add_row(2, array.from(0.0, 1.0, 0.0, 0.0))
mat.add_row(3, array.from(1.0, 0.0, 0.0, 0.0))
b = .transform_normal_Matrix(.one(), mat)
```
transform_normal_M44(a, M)
Transforms a vector by the given matrix.
Parameters:
a (Vector3 type from RicardoSantos/CommonTypesMath/1) : `Vector3` Source vector.
M (M44 type from RicardoSantos/CommonTypesMath/1) : `M44` A 4x4 matrix. The transformation matrix.
Returns: `Vector3` Generated new vector.
___
**Usage:**
```
a = .transform_normal_M44(.one(), .M44.new(0,0,0,1,0,0,1,0,0,1,0,0,1,0,0,0))
```
___
**Notes:**
- Type `M44` from `CommonTypesMath` library.
transform_Array(a, rotation)
Transforms a vector by the given Quaternion rotation value.
Parameters:
a (Vector3 type from RicardoSantos/CommonTypesMath/1) : `Vector3` Source vector. The source vector to be rotated.
rotation (float ) : `array` A 4 element array. Quaternion. The rotation to apply.
Returns: `Vector3` Generated new vector.
___
**Usage:**
```
a = .transform_Array(.one(), array.from(0.2, 0.2, 0.2, 1.0))
```
___
**Reference:**
- referencesource.microsoft.com
transform_Quaternion(a, rotation)
Transforms a vector by the given Quaternion rotation value.
Parameters:
a (Vector3 type from RicardoSantos/CommonTypesMath/1) : `Vector3` Source vector. The source vector to be rotated.
rotation (Quaternion type from RicardoSantos/CommonTypesMath/1) : `array` A 4 element array. Quaternion. The rotation to apply.
Returns: `Vector3` Generated new vector.
___
**Usage:**
```
a = .transform_Quaternion(.one(), .Quaternion.new(0.2, 0.2, 0.2, 1.0))
```
___
**Notes:**
- Type `Quaternion` from `CommonTypesMath` library.
___
**Reference:**
- referencesource.microsoft.com

BenfordsLawLibrary "BenfordsLaw"
Methods to deal with Benford's law which states that a distribution of first and higher order digits
of numerical strings has a characteristic pattern.
"Benford's law is an observation about the leading digits of the numbers found in real-world data sets.
Intuitively, one might expect that the leading digits of these numbers would be uniformly distributed so that
each of the digits from 1 to 9 is equally likely to appear. In fact, it is often the case that 1 occurs more
frequently than 2, 2 more frequently than 3, and so on. This observation is a simplified version of Benford's law.
More precisely, the law gives a prediction of the frequency of leading digits using base-10 logarithms that
predicts specific frequencies which decrease as the digits increase from 1 to 9." ~(2)
---
reference:
- 1: en.wikipedia.org
- 2: brilliant.org
- 4: github.com
cumsum_difference(a, b)
Calculate the cumulative sum difference of two arrays of same size.
Parameters:
a (float ) : `array` List of values.
b (float ) : `array` List of values.
Returns: List with CumSum Difference between arrays.
fractional_int(number)
Transform a floating number including its fractional part to integer form ex:. `1.2345 -> 12345`.
Parameters:
number (float) : `float` The number to transform.
Returns: Transformed number.
split_to_digits(number, reverse)
Transforms a integer number into a list of its digits.
Parameters:
number (int) : `int` Number to transform.
reverse (bool) : `bool` `default=true`, Reverse the order of the digits, if true, last will be first.
Returns: Transformed number digits list.
digit_in(number, digit)
Digit at index.
Parameters:
number (int) : `int` Number to parse.
digit (int) : `int` `default=0`, Index of digit.
Returns: Digit found at the index.
digits_from(data, dindex)
Process a list of `int` values and get the list of digits.
Parameters:
data (int ) : `array` List of numbers.
dindex (int) : `int` `default=0`, Index of digit.
Returns: List of digits at the index.
digit_counters(digits)
Score digits.
Parameters:
digits (int ) : `array` List of digits.
Returns: List of counters per digit (1-9).
digit_distribution(counters)
Calculates the frequency distribution based on counters provided.
Parameters:
counters (int ) : `array` List of counters, must have size(9).
Returns: Distribution of the frequency of the digits.
digit_p(digit)
Expected probability for digit according to Benford.
Parameters:
digit (int) : `int` Digit number reference in range `1 -> 9`.
Returns: Probability of digit according to Benford's law.
benfords_distribution()
Calculated Expected distribution per digit according to Benford's Law.
Returns: List with the expected distribution.
benfords_distribution_aprox()
Aproximate Expected distribution per digit according to Benford's Law.
Returns: List with the expected distribution.
test_benfords(digits, calculate_benfords)
Tests Benford's Law on provided list of digits.
Parameters:
digits (int ) : `array` List of digits.
calculate_benfords (bool)
Returns: Tuple with:
- Counters: Score of each digit.
- Sample distribution: Frequency for each digit.
- Expected distribution: Expected frequency according to Benford's.
- Cumulative Sum of difference:
to_table(digits, _text_color, _border_color, _frame_color)
Parameters:
digits (int )
_text_color (color)
_border_color (color)
_frame_color (color)

MathEasingFunctionsLibrary "MathEasingFunctions"
A collection of Easing functions.
Easing functions are commonly used for smoothing actions over time, They are used to smooth out the sharp edges
of a function and make it more pleasing to the eye, like for example the motion of a object through time.
Easing functions can be used in a variety of applications, including animation, video games, and scientific
simulations. They are a powerful tool for creating realistic visual effects and can help to make your work more
engaging and enjoyable to the eye.
---
Includes functions for ease in, ease out, and, ease in and out, for the following constructs:
sine, quadratic, cubic, quartic, quintic, exponential, elastic, circle, back, bounce.
---
Reference:
easings.net
learn.microsoft.com
ease_in_sine_unbound(v)
Sinusoidal function, the position over elapsed time (unbound).
Parameters:
v (float) : `float` Elapsed time.
Returns: Ratio of change.
ease_in_sine(v)
Sinusoidal function, the position over elapsed time (bound).
Parameters:
v (float) : `float` Elapsed time.
Returns: Ratio of change.
ease_out_sine_unbound(v)
Sinusoidal function, the position over elapsed time (unbound).
Parameters:
v (float) : `float` Elapsed time.
Returns: Ratio of change.
ease_out_sine(v)
Sinusoidal function, the position over elapsed time (bound).
Parameters:
v (float) : `float` Elapsed time.
Returns: Ratio of change.
ease_in_out_sine_unbound(v)
Sinusoidal function, the position over elapsed time (unbound).
Parameters:
v (float) : `float` Elapsed time.
Returns: Ratio of change.
ease_in_out_sine(v)
Sinusoidal function, the position over elapsed time (bound).
Parameters:
v (float) : `float` Elapsed time.
Returns: Ratio of change.
ease_in_quad_unbound(v)
Quadratic function, the position equals the square of elapsed time (unbound).
Parameters:
v (float) : `float` Elapsed time.
Returns: Ratio of change.
ease_in_quad(v)
Quadratic function, the position equals the square of elapsed time (bound).
Parameters:
v (float) : `float` Elapsed time.
Returns: Ratio of change.
ease_out_quad_unbound(v)
Quadratic function, the position equals the square of elapsed time (unbound).
Parameters:
v (float) : `float` Elapsed time.
Returns: Ratio of change.
ease_out_quad(v)
Quadratic function, the position equals the square of elapsed time (bound).
Parameters:
v (float) : `float` Elapsed time.
Returns: Ratio of change.
ease_in_out_quad_unbound(v)
Quadratic function, the position equals the square of elapsed time (unbound).
Parameters:
v (float) : `float` Elapsed time.
Returns: Ratio of change.
ease_in_out_quad(v)
Quadratic function, the position equals the square of elapsed time (bound).
Parameters:
v (float) : `float` Elapsed time.
Returns: Ratio of change.
ease_in_cubic_unbound(v)
Cubic function, the position equals the cube of elapsed time (unbound).
Parameters:
v (float) : `float` Elapsed time.
Returns: Ratio of change.
ease_in_cubic(v)
Cubic function, the position equals the cube of elapsed time (bound).
Parameters:
v (float) : `float` Elapsed time.
Returns: Ratio of change.
ease_out_cubic_unbound(v)
Cubic function, the position equals the cube of elapsed time (unbound).
Parameters:
v (float) : `float` Elapsed time.
Returns: Ratio of change.
ease_out_cubic(v)
Cubic function, the position equals the cube of elapsed time (bound).
Parameters:
v (float) : `float` Elapsed time.
Returns: Ratio of change.
ease_in_out_cubic_unbound(v)
Cubic function, the position equals the cube of elapsed time (unbound).
Parameters:
v (float) : `float` Elapsed time.
Returns: Ratio of change.
ease_in_out_cubic(v)
Cubic function, the position equals the cube of elapsed time (bound).
Parameters:
v (float) : `float` Elapsed time.
Returns: Ratio of change.
ease_in_quart_unbound(v)
Quartic function, the position equals the formula `f(t)=t^4` of elapsed time (unbound).
Parameters:
v (float) : `float` Elapsed time.
Returns: Ratio of change.
ease_in_quart(v)
Quartic function, the position equals the formula `f(t)=t^4` of elapsed time (bound).
Parameters:
v (float) : `float` Elapsed time.
Returns: Ratio of change.
ease_out_quart_unbound(v)
Quartic function, the position equals the formula `f(t)=t^4` of elapsed time (unbound).
Parameters:
v (float) : `float` Elapsed time.
Returns: Ratio of change.
ease_out_quart(v)
Quartic function, the position equals the formula `f(t)=t^4` of elapsed time (bound).
Parameters:
v (float) : `float` Elapsed time.
Returns: Ratio of change.
ease_in_out_quart_unbound(v)
Quartic function, the position equals the formula `f(t)=t^4` of elapsed time (unbound).
Parameters:
v (float) : `float` Elapsed time.
Returns: Ratio of change.
ease_in_out_quart(v)
Quartic function, the position equals the formula `f(t)=t^4` of elapsed time (bound).
Parameters:
v (float) : `float` Elapsed time.
Returns: Ratio of change.
ease_in_quint_unbound(v)
Quintic function, the position equals the formula `f(t)=t^5` of elapsed time (unbound).
Parameters:
v (float) : `float` Elapsed time.
Returns: Ratio of change.
ease_in_quint(v)
Quintic function, the position equals the formula `f(t)=t^5` of elapsed time (bound).
Parameters:
v (float) : `float` Elapsed time.
Returns: Ratio of change.
ease_out_quint_unbound(v)
Quintic function, the position equals the formula `f(t)=t^5` of elapsed time (unbound).
Parameters:
v (float) : `float` Elapsed time.
Returns: Ratio of change.
ease_out_quint(v)
Quintic function, the position equals the formula `f(t)=t^5` of elapsed time (bound).
Parameters:
v (float) : `float` Elapsed time.
Returns: Ratio of change.
ease_in_out_quint_unbound(v)
Quintic function, the position equals the formula `f(t)=t^5` of elapsed time (unbound).
Parameters:
v (float) : `float` Elapsed time.
Returns: Ratio of change.
ease_in_out_quint(v)
Quintic function, the position equals the formula `f(t)=t^5` of elapsed time (bound).
Parameters:
v (float) : `float` Elapsed time.
Returns: Ratio of change.
ease_in_expo_unbound(v)
Exponential function, the position equals the exponential formula of elapsed time (unbound).
Parameters:
v (float) : `float` Elapsed time.
Returns: Ratio of change.
ease_in_expo(v)
Exponential function, the position equals the exponential formula of elapsed time (bound).
Parameters:
v (float) : `float` Elapsed time.
Returns: Ratio of change.
ease_out_expo_unbound(v)
Exponential function, the position equals the exponential formula of elapsed time (unbound).
Parameters:
v (float) : `float` Elapsed time.
Returns: Ratio of change.
ease_out_expo(v)
Exponential function, the position equals the exponential formula of elapsed time (bound).
Parameters:
v (float) : `float` Elapsed time.
Returns: Ratio of change.
ease_in_out_expo_unbound(v)
Exponential function, the position equals the exponential formula of elapsed time (unbound).
Parameters:
v (float) : `float` Elapsed time.
Returns: Ratio of change.
ease_in_out_expo(v)
Exponential function, the position equals the exponential formula of elapsed time (bound).
Parameters:
v (float) : `float` Elapsed time.
Returns: Ratio of change.
ease_in_circ_unbound(v)
Circular function, the position equals the circular formula of elapsed time (unbound).
Parameters:
v (float) : `float` Elapsed time.
Returns: Ratio of change.
ease_in_circ(v)
Circular function, the position equals the circular formula of elapsed time (bound).
Parameters:
v (float) : `float` Elapsed time.
Returns: Ratio of change.
ease_out_circ_unbound(v)
Circular function, the position equals the circular formula of elapsed time (unbound).
Parameters:
v (float) : `float` Elapsed time.
Returns: Ratio of change.
ease_out_circ(v)
Circular function, the position equals the circular formula of elapsed time (bound).
Parameters:
v (float) : `float` Elapsed time.
Returns: Ratio of change.
ease_in_out_circ_unbound(v)
Circular function, the position equals the circular formula of elapsed time (unbound).
Parameters:
v (float) : `float` Elapsed time.
Returns: Ratio of change.
ease_in_out_circ(v)
Circular function, the position equals the circular formula of elapsed time (bound).
Parameters:
v (float) : `float` Elapsed time.
Returns: Ratio of change.
ease_in_back_unbound(v)
Back function, the position retreats a bit before resuming (unbound).
Parameters:
v (float) : `float` Elapsed time.
Returns: Ratio of change.
ease_in_back(v)
Back function, the position retreats a bit before resuming (bound).
Parameters:
v (float) : `float` Elapsed time.
Returns: Ratio of change.
ease_out_back_unbound(v)
Back function, the position retreats a bit before resuming (unbound).
Parameters:
v (float) : `float` Elapsed time.
Returns: Ratio of change.
ease_out_back(v)
Back function, the position retreats a bit before resuming (bound).
Parameters:
v (float) : `float` Elapsed time.
Returns: Ratio of change.
ease_in_out_back_unbound(v)
Back function, the position retreats a bit before resuming (unbound).
Parameters:
v (float) : `float` Elapsed time.
Returns: Ratio of change.
ease_in_out_back(v)
Back function, the position retreats a bit before resuming (bound).
Parameters:
v (float) : `float` Elapsed time.
Returns: Ratio of change.
ease_in_elastic_unbound(v)
Elastic function, the position oscilates back and forth like a spring (unbound).
Parameters:
v (float) : `float` Elapsed time.
Returns: Ratio of change.
ease_in_elastic(v)
Elastic function, the position oscilates back and forth like a spring (bound).
Parameters:
v (float) : `float` Elapsed time.
Returns: Ratio of change.
ease_out_elastic_unbound(v)
Elastic function, the position oscilates back and forth like a spring (unbound).
Parameters:
v (float) : `float` Elapsed time.
Returns: Ratio of change.
ease_out_elastic(v)
Elastic function, the position oscilates back and forth like a spring (bound).
Parameters:
v (float) : `float` Elapsed time.
Returns: Ratio of change.
ease_in_out_elastic_unbound(v)
Elastic function, the position oscilates back and forth like a spring (unbound).
Parameters:
v (float) : `float` Elapsed time.
Returns: Ratio of change.
ease_in_out_elastic(v)
Elastic function, the position oscilates back and forth like a spring (bound).
Parameters:
v (float) : `float` Elapsed time.
Returns: Ratio of change.
ease_in_bounce_unbound(v)
Bounce function, the position bonces from the boundery (unbound).
Parameters:
v (float) : `float` Elapsed time.
Returns: Ratio of change.
ease_in_bounce(v)
Bounce function, the position bonces from the boundery (bound).
Parameters:
v (float) : `float` Elapsed time.
Returns: Ratio of change.
ease_out_bounce_unbound(v)
Bounce function, the position bonces from the boundery (unbound).
Parameters:
v (float) : `float` Elapsed time.
Returns: Ratio of change.
ease_out_bounce(v)
Bounce function, the position bonces from the boundery (bound).
Parameters:
v (float) : `float` Elapsed time.
Returns: Ratio of change.
ease_in_out_bounce_unbound(v)
Bounce function, the position bonces from the boundery (unbound).
Parameters:
v (float) : `float` Elapsed time.
Returns: Ratio of change.
ease_in_out_bounce(v)
Bounce function, the position bonces from the boundery (bound).
Parameters:
v (float) : `float` Elapsed time.
Returns: Ratio of change.
select(v, formula, effect, bounded)
Parameters:
v (float)
formula (string)
effect (string)
bounded (bool)

Vector2FunctionClipLibrary "Vector2FunctionClip"
Sutherland-Hodgman polygon clipping algorithm.
reference:
.
rosettacode.org
.
clip(source, reference)
Perform Clip operation on a vector with another.
Parameters:
source : array . Source polygon to be clipped.
reference : array . Reference polygon to clip source.
Returns: array.

Vector2ArrayLibrary "Vector2Array"
functions to handle vector2 Array operations.
.
references:
docs.unity3d.com
gist.github.com
github.com
gist.github.com
gist.github.com
gist.github.com
.
from(source, prop_sep, vect_sep)
Generate array of vector2 from string.
Parameters:
source : string Source string of the vectors.
prop_sep : string Separator character of the vector properties (x`,`y).
vect_sep : string Separator character of the vectors ((x,y)`;`(x,y)).
Returns: array.
max(vectors)
Combination of the highest elements in column of a array of vectors.
Parameters:
vectors : array, Array of Vector2 objects.
Returns: Vector2.Vector2, Vector2 object.
-> usage:
`a = Vector2.from(1.0) , b = Vector2.from(2.0), c = Vector2.from(3.0), d = max(array.from(a, b, c)) , plot(d.x)`
min(vectors)
Combination of the lowest elements in column of a array of vectors.
Parameters:
vectors : array, Array of Vector2 objects.
Returns: Vector2.Vector2, Vector2 object.
-> usage:
`a = Vector2.from(1.0) , b = Vector2.from(2.0), c = Vector2.from(3.0), d = min(array.from(a, b, c)) , plot(d.x)`
sum(vectors)
Total sum of all vectors.
Parameters:
vectors : array, ID of the vector2 array.
Returns: Vector2.Vector2, vector2 object.
-> usage:
`a = Vector2.from(1.0) , b = Vector2.from(2.0), c = Vector2.from(3.0), d = sum(array.from(a, b, c)) , plot(d.x)`
center(vectors)
Finds the vector center of the array.
Parameters:
vectors : array, ID of the vector2 array.
Returns: Vector2.Vector2, vector2 object.
-> usage:
`a = Vector2.from(1.0) , b = Vector2.from(2.0), c = Vector2.from(3.0), d = center(array.from(a, b, c)) , plot(d.x)`
rotate(vectors, center, degree)
Rotate Array vectors around origin vector by a angle.
Parameters:
vectors : array, ID of the vector2 array.
center : Vector2.Vector2 , Vector2 object. Center of the rotation.
degree : float , Angle value.
Returns: rotated points array.
-> usage:
`a = Vector2.from(1.0) , b = Vector2.from(2.0), c = Vector2.from(3.0), d = rotate(array.from(a, b, c), b, 45.0)`
scale(vectors, center, rate)
Scale Array vectors based on a origin vector perspective.
Parameters:
vectors : array, ID of the vector2 array.
center : Vector2.Vector2 , Vector2 object. Origin center of the transformation.
rate : float , Rate to apply transformation.
Returns: rotated points array.
-> usage:
`a = Vector2.from(1.0) , b = Vector2.from(2.0), c = Vector2.from(3.0), d = scale(array.from(a, b, c), b, 1.25)`
move(vectors, center, rate)
Move Array vectors by a rate of the distance to center position (LERP).
Parameters:
vectors : array, ID of the vector2 array.
center
rate
Returns: Moved points array.
-> usage:
`a = Vector2.from(1.0) , b = Vector2.from(2.0), c = Vector2.from(3.0), d = move(array.from(a, b, c), b, 1.25)`
to_string(id, separator)
Reads a array of vectors into a string, of the form ` `.
Parameters:
id : array, ID of the vector2 array.
separator : string separator for cell splitting.
Returns: string Translated complex array into string.
-> usage:
`a = Vector2.from(1.0) , b = Vector2.from(2.0), c = Vector2.from(3.0), d = to_string(array.from(a, b, c))`
to_string(id, format, separator)
Reads a array of vectors into a string, of the form ` `.
Parameters:
id : array, ID of the vector2 array.
format : string , Format to apply transformation.
separator : string , Separator for cell splitting.
Returns: string Translated complex array into string.
-> usage:
`a = Vector2.from(1.234) , b = Vector2.from(2.23), c = Vector2.from(3.1234), d = to_string(array.from(a, b, c), "#.##")`

Segment2Library "Segment2"
Structure representation of a directed straight line in two dimensions from origin to target vectors.
.
reference:
graphics.stanford.edu
.
new(origin, target)
Generate a new segment.
Parameters:
origin : Vector2 . Origin of the segment.
target : Vector2 . Target of the segment.
Returns: Segment2.
new(origin_x, origin_y, target_x, target_y)
Generate a new segment.
Parameters:
origin_x : float . Origin of the segment x coordinate.
origin_y : float . Origin of the segment y coordinate.
target_x : float . Target of the segment x coordinate.
target_y : float . Target of the segment y coordinate.
Returns: Segment2.
copy(this)
Copy a segment.
Parameters:
this : Vector2 . Segment to copy.
Returns: Segment2.
length_squared(this)
Squared length of the normalized segment vector. For comparing vectors this is computationaly lighter.
Parameters:
this : Segment2 . Sorce segment.
Returns: float.
length(this)
Length of the normalized segment vector.
Parameters:
this : Segment2 . Sorce segment.
Returns: float.
opposite(this)
Reverse the direction of the segment.
Parameters:
this : Segment2 . Source segment.
Returns: Segment2.
is_degenerate(this)
Segment is degenerate when origin and target are equal.
Parameters:
this : Segment2 . Source segment.
Returns: bool.
is_horizontal(this)
Segment is horizontal?.
Parameters:
this : Segment2 . Source segment.
Returns: bool.
is_horizontal(this, precision)
Segment is horizontal?.
Parameters:
this : Segment2 . Source segment.
precision : float . Limit of precision.
Returns: bool.
is_vertical(this)
Segment is vertical?.
Parameters:
this : Segment2 . Source segment.
Returns: bool.
is_vertical(this, precision)
Segment is vertical?.
Parameters:
this : Segment2 . Source segment.
precision : float . Limit of precision.
Returns: bool.
equals(this, other)
Tests two segments for equality (share same origin and target).
Parameters:
this : Segment2 . Source segment.
other : Segment2 . Target segment.
Returns: bool.
nearest_to_point(this, point)
Find the nearest point in a segment to another point.
Parameters:
this : Segment2 . Source segment.
point : Vector2 . Point to aproximate.
Returns: Vector2.
intersection(this, other)
Find the intersection vector of 2 lines.
Parameters:
this : Segment2 . Segment A.
other : Segment2 . Segment B.
Returns: Vector2.Vector2 Object.
extend(this, at_origin, at_target)
Extend a segment by the percent ratio provided.
Parameters:
this : Segment2 . Source segment.
at_origin : float . Percent ratio to extend at origin vector.
at_target : float . Percent ratio to extend at target vector.
Returns: Segment2.
to_string(this)
Translate segment to string format `( (x,y), (x,y) )`.
Parameters:
this : Segment2 . Source segment.
Returns: string.
to_string(this, format)
Translate segment to string format `((x,y), (x,y))`.
Parameters:
this : Segment2 . Source segment.
format : string . Format string to apply.
Returns: string.
to_array(this)
Translate segment to array format.
Parameters:
this : Segment2 . Source segment.
Returns: array.

Vector2DrawQuadLibrary "Vector2DrawQuad"
functions to handle vector2 Quad drawing operations.
new(a, b, c, d, xloc, bg_color, line_color, line_style, line_width)
Draws a quadrilateral with background fill.
Parameters:
a : v2 . Vector2 object, in the form `(x, y)`.
b : v2 . Vector2 object, in the form `(x, y)`.
c : v2 . Vector2 object, in the form `(x, y)`.
d : v2 . Vector2 object, in the form `(x, y)`.
xloc : string . Type of axis unit, bar_index or time.
bg_color : color . Color of the background.
line_color : color . Color of the line.
line_style : string . Style of the line.
line_width : int . Width of the line.
Returns: Quad object.
copy(this)
Copy a existing quad object.
Parameters:
this : Quad . Source quad.
Returns: Quad.
set_position_a(this, x, y)
Set the position of corner `a` (modifies source quad).
Parameters:
this : Quad . Source quad.
x : int . Value at the x axis.
y : float . Value at the y axis.
Returns: Source Quad.
set_position_a(this, position)
Set the position of corner `a` (modifies source quad).
Parameters:
this : Quad . Source quad.
position : Vector2 . New position.
Returns: Source Quad.
set_position_b(this, x, y)
Set the position of corner `b` (modifies source quad).
Parameters:
this : Quad . Source quad.
x : int . Value at the x axis.
y : float . Value at the y axis.
Returns: Source Quad.
set_position_b(this, position)
Set the position of corner `b` (modifies source quad).
Parameters:
this : Quad . Source quad.
position : Vector2 . New position.
Returns: Source Quad.
set_position_c(this, x, y)
Set the position of corner `c` (modifies source quad).
Parameters:
this : Quad . Source quad.
x : int . Value at the x axis.
y : float . Value at the y axis.
Returns: Source Quad.
set_position_c(this, position)
Set the position of corner `c` (modifies source quad).
Parameters:
this : Quad . Source quad.
position : Vector2 . New position.
Returns: Source Quad.
set_position_d(this, x, y)
Set the position of corner `d` (modifies source quad).
Parameters:
this : Quad . Source quad.
x : int . Value at the x axis.
y : float . Value at the y axis.
Returns: Source Quad.
set_position_d(this, position)
Set the position of corner `d` (modifies source quad).
Parameters:
this : Quad . Source quad.
position : Vector2 . New position.
Returns: Source Quad.
set_style(this, bg_color, line_color, line_style, line_width)
Update quad style options (modifies Source quad).
Parameters:
this : Quad . Source quad.
bg_color : color . Color of the background.
line_color : color . Color of the line.
line_style : string . Style of the line.
line_width : int . Width of the line.
Returns: Source Quad.
set_bg_color(this, bg_color)
Update quad style options (modifies Source quad).
Parameters:
this : Quad . Source quad.
bg_color : color . Color of the background.
Returns: Source Quad.
set_line_color(this, line_color)
Update quad style options (modifies Source quad).
Parameters:
this : Quad . Source quad.
line_color : color . Color of the line.
Returns: Source Quad.
set_line_style(this, line_style)
Update quad style options (modifies Source quad).
Parameters:
this : Quad . Source quad.
line_style : string . Style of the line.
Returns: Source Quad.
set_line_width(this, line_width)
Update quad style options (modifies Source quad).
Parameters:
this : Quad . Source quad.
line_width : int . Width of the line.
Returns: Source Quad.
move(this, x, y)
Move quad by provided amount (modifies source quad).
Parameters:
this : Quad . Source quad.
x : float . Amount to move the vertices of the quad in the x axis.
y : float . Amount to move the vertices of the quad in the y axis.
Returns: Source Quad.
move(this, amount)
Move quad by provided amount (modifies source quad).
Parameters:
this : Quad . Source quad.
amount : Vector2 . Amount to move the vertices of the quad in the x and y axis.
Returns: Source Quad.
rotate_around(this, center, angle)
Rotate source quad around a center (modifies source quad).
Parameters:
this : Quad . Source quad.
center : Vector2 . Center coordinates of the rotation.
angle : float . Value of angle in degrees.
Returns: Source Quad.
rotate_around(this, center_x, center_y, angle)
Rotate source quad around a center (modifies source quad).
Parameters:
this : Quad . Source quad.
center_x : int . Center coordinates of the rotation.
center_y : float . Center coordinates of the rotation.
angle : float . Value of angle in degrees.
Returns: Source Quad.
Vector2DrawTriangleLibrary "Vector2DrawTriangle"
Functions to draw a triangle and manipulate its properties.
new(a, b, c, xloc, bg_color, line_color, line_style, line_width)
Draws a triangle with background fill using line prototype.
Parameters:
a : v2 . Vector2 object, in the form `(x, y)`.
b : v2 . Vector2 object, in the form `(x, y)`.
c : v2 . Vector2 object, in the form `(x, y)`.
xloc : string . Type of axis unit, bar_index or time.
bg_color : color . Color of the background.
line_color : color . Color of the line.
line_style : string . Style of the line.
line_width : int . Width of the line.
Returns: Triangle object.
copy(this)
Copy a existing triangle object.
Parameters:
this : Triangle . Source triangle.
Returns: Triangle.
set_position_a(this, x, y)
Set the position of corner `a` (modifies source triangle).
Parameters:
this : Triangle . Source triangle.
x : int . Value at the x axis.
y : float . Value at the y axis.
Returns: Source Triangle.
set_position_a(this, position)
Set the position of corner `a` (modifies source triangle).
Parameters:
this : Triangle . Source triangle.
position : Vector2 . New position.
Returns: Source Triangle.
set_position_b(this, x, y)
Set the position of corner `b` (modifies source triangle).
Parameters:
this : Triangle . Source triangle.
x : int . Value at the x axis.
y : float . Value at the y axis.
Returns: Source Triangle.
set_position_b(this, position)
Set the position of corner `b` (modifies source triangle).
Parameters:
this : Triangle . Source triangle.
position : Vector2 . New position.
Returns: Source Triangle.
set_position_c(this, x, y)
Set the position of corner `c` (modifies source triangle).
Parameters:
this : Triangle . Source triangle.
x : int . Value at the x axis.
y : float . Value at the y axis.
Returns: Source Triangle.
set_position_c(this, position)
Set the position of corner `c` (modifies source triangle).
Parameters:
this : Triangle . Source triangle.
position : Vector2 . New position.
Returns: Source Triangle.
set_style(this, bg_color, line_color, line_style, line_width)
Update triangle style options (modifies Source triangle).
Parameters:
this : Triangle . Source triangle.
bg_color : color . Color of the background.
line_color : color . Color of the line.
line_style : string . Style of the line.
line_width : int . Width of the line.
Returns: Source Triangle.
set_bg_color(this, bg_color)
Update triangle style options (modifies Source triangle).
Parameters:
this : Triangle . Source triangle.
bg_color : color . Color of the background.
Returns: Source Triangle.
set_line_color(this, line_color)
Update triangle style options (modifies Source triangle).
Parameters:
this : Triangle . Source triangle.
line_color : color . Color of the line.
Returns: Source Triangle.
set_line_style(this, line_style)
Update triangle style options (modifies Source triangle).
Parameters:
this : Triangle . Source triangle.
line_style : string . Style of the line.
Returns: Source Triangle.
set_line_width(this, line_width)
Update triangle style options (modifies Source triangle).
Parameters:
this : Triangle . Source triangle.
line_width : int . Width of the line.
Returns: Source Triangle.
move(this, x, y)
Move triangle by provided amount (modifies source triangle).
Parameters:
this : Triangle . Source triangle.
x : float . Amount to move the vertices of the triangle in the x axis.
y : float . Amount to move the vertices of the triangle in the y axis.
Returns: Source Triangle.
move(this, amount)
Move triangle by provided amount (modifies source triangle).
Parameters:
this : Triangle . Source triangle.
amount : Vector2 . Amount to move the vertices of the triangle in the x and y axis.
Returns: Source Triangle.
rotate_around(this, center, angle)
Rotate source triangle around a center (modifies source triangle).
Parameters:
this : Triangle . Source triangle.
center : Vector2 . Center coordinates of the rotation.
angle : float . Value of angle in degrees.
Returns: Source Triangle.
rotate_around(this, center_x, center_y, angle)
Rotate source triangle around a center (modifies source triangle).
Parameters:
this : Triangle . Source triangle.
center_x : int . Center coordinates of the rotation.
center_y : float . Center coordinates of the rotation.
angle : float . Value of angle in degrees.
Returns: Source Triangle.

CommonTypesDrawingLibrary "CommonTypesDrawing"
Provides a common library source for common types of used graphical drawing structures.
Includes: `Triangle, Quad, Polygon`
Triangle
Representation of a triangle using lines and linefill.
Fields:
ab : Edge of point a to b.
bc : Edge of point b to c.
ca : Edge of point c to a.
fill : Fill of the object.
solid : Check if polygon should have a fill.
Quad
Representation of a quadrilateral using lines and linefill.
Fields:
ab : Edge of point a to b.
bc : Edge of point b to c.
cd : Edge of point c to d.
da : Edge of point d to a.
fill : Fill of the object.
solid : Check if polygon should have a fill.
Polygon
Representation of a polygon using lines and linefill.
Fields:
edges : List of edges in the polygon.
fills : Fills of the object.
closed : Check if polygon line should connect last vertice to first.
solid : Check if polygon should have a fill.

Vector2DrawLineLibrary "Vector2DrawLine"
Extends line type with methods for Vector2 and Segment2.
new(origin, target, xloc, extend, color, style, width)
Draws a line using Segment type to hold its coordinate properties..
Parameters:
origin : Vector2 . Origin vector of the line.
target : Vector2 . Target vector of the line.
xloc : string
extend : string
color : color
style : string
width : int
Returns: line object
new(segment, xloc, extend, color, style, width)
Draws a line using Segment type to hold its coordinate properties..
Parameters:
segment : Segment2 . Segment with positional coordinates.
xloc : string
extend : string
color : color
style : string
width : int
Returns: line object
rotate_around(this, center, angle)
Instance method to rotate line around center vector (modifies input line).
Parameters:
this : line . Line object.
center : Vector2 . Center of rotation.
angle : float . Rotation angle in degrees.
Returns: line. Rotated line object.
Vector2Library "Vector2"
Representation of two dimensional vectors or points.
This structure is used to represent positions in two dimensional space or vectors,
for example in spacial coordinates in 2D space.
~~~
references:
docs.unity3d.com
gist.github.com
github.com
gist.github.com
gist.github.com
gist.github.com
~~~
new(x, y)
Create a new Vector2 object.
Parameters:
x : float . The x value of the vector, default=0.
y : float . The y value of the vector, default=0.
Returns: Vector2. Vector2 object.
-> usage:
`unitx = Vector2.new(1.0) , plot(unitx.x)`
from(value)
Assigns value to a new vector `x,y` elements.
Parameters:
value : float, x and y value of the vector.
Returns: Vector2. Vector2 object.
-> usage:
`one = Vector2.from(1.0), plot(one.x)`
from(value, element_sep, open_par, close_par)
Assigns value to a new vector `x,y` elements.
Parameters:
value : string . The `x` and `y` value of the vector in a `x,y` or `(x,y)` format, spaces and parentesis will be removed automatically.
element_sep : string . Element separator character, default=`,`.
open_par : string . Open parentesis character, default=`(`.
close_par : string . Close parentesis character, default=`)`.
Returns: Vector2. Vector2 object.
-> usage:
`one = Vector2.from("1.0,2"), plot(one.x)`
copy(this)
Creates a deep copy of a vector.
Parameters:
this : Vector2 . Vector2 object.
Returns: Vector2. Vector2 object.
-> usage:
`a = Vector2.new(1.0) , b = a.copy() , plot(b.x)`
down()
Vector in the form `(0, -1)`.
Returns: Vector2. Vector2 object.
left()
Vector in the form `(-1, 0)`.
Returns: Vector2. Vector2 object.
right()
Vector in the form `(1, 0)`.
Returns: Vector2. Vector2 object.
up()
Vector in the form `(0, 1)`.
Returns: Vector2. Vector2 object.
one()
Vector in the form `(1, 1)`.
Returns: Vector2. Vector2 object.
zero()
Vector in the form `(0, 0)`.
Returns: Vector2. Vector2 object.
minus_one()
Vector in the form `(-1, -1)`.
Returns: Vector2. Vector2 object.
unit_x()
Vector in the form `(1, 0)`.
Returns: Vector2. Vector2 object.
unit_y()
Vector in the form `(0, 1)`.
Returns: Vector2. Vector2 object.
nan()
Vector in the form `(float(na), float(na))`.
Returns: Vector2. Vector2 object.
xy(this)
Return the values of `x` and `y` as a tuple.
Parameters:
this : Vector2 . Vector2 object.
Returns: .
-> usage:
`a = Vector2.new(1.0, 1.0) , = a.xy() , plot(ax)`
length_squared(this)
Length of vector `a` in the form. `a.x^2 + a.y^2`, for comparing vectors this is computationaly lighter.
Parameters:
this : Vector2 . Vector2 object.
Returns: float. Squared length of vector.
-> usage:
`a = Vector2.new(1.0, 1.0) , plot(a.length_squared())`
length(this)
Magnitude of vector `a` in the form. `sqrt(a.x^2 + a.y^2)`
Parameters:
this : Vector2 . Vector2 object.
Returns: float. Length of vector.
-> usage:
`a = Vector2.new(1.0, 1.0) , plot(a.length())`
normalize(a)
Vector normalized with a magnitude of 1, in the form. `a / length(a)`.
Parameters:
a : Vector2 . Vector2 object.
Returns: Vector2. Vector2 object.
-> usage:
`a = normalize(Vector2.new(3.0, 2.0)) , plot(a.y)`
isNA(this)
Checks if any of the components is `na`.
Parameters:
this : Vector2 . Vector2 object.
Returns: bool.
usage:
p = Vector2.new(1.0, na) , plot(isNA(p)?1:0)
add(a, b)
Adds vector `b` to `a`, in the form `(a.x + b.x, a.y + b.y)`.
Parameters:
a : Vector2 . Vector2 object.
b : Vector2 . Vector2 object.
Returns: Vector2. Vector2 object.
-> usage:
`a = one() , b = one() , c = add(a, b) , plot(c.x)`
add(a, b)
Adds vector `b` to `a`, in the form `(a.x + b, a.y + b)`.
Parameters:
a : Vector2 . Vector2 object.
b : float . Value.
Returns: Vector2. Vector2 object.
-> usage:
`a = one() , b = 1.0 , c = add(a, b) , plot(c.x)`
add(a, b)
Adds vector `b` to `a`, in the form `(a + b.x, a + b.y)`.
Parameters:
a : float . Value.
b : Vector2 . Vector2 object.
Returns: Vector2. Vector2 object.
-> usage:
`a = 1.0 , b = one() , c = add(a, b) , plot(c.x)`
subtract(a, b)
Subtract vector `b` from `a`, in the form `(a.x - b.x, a.y - b.y)`.
Parameters:
a : Vector2 . Vector2 object.
b : Vector2 . Vector2 object.
Returns: Vector2. Vector2 object.
-> usage:
`a = one() , b = one() , c = subtract(a, b) , plot(c.x)`
subtract(a, b)
Subtract vector `b` from `a`, in the form `(a.x - b, a.y - b)`.
Parameters:
a : Vector2 . vector2 object.
b : float . Value.
Returns: Vector2. Vector2 object.
-> usage:
`a = one() , b = 1.0 , c = subtract(a, b) , plot(c.x)`
subtract(a, b)
Subtract vector `b` from `a`, in the form `(a - b.x, a - b.y)`.
Parameters:
a : float . value.
b : Vector2 . Vector2 object.
Returns: Vector2. Vector2 object.
-> usage:
`a = 1.0 , b = one() , c = subtract(a, b) , plot(c.x)`
multiply(a, b)
Multiply vector `a` with `b`, in the form `(a.x * b.x, a.y * b.y)`.
Parameters:
a : Vector2 . Vector2 object.
b : Vector2 . Vector2 object.
Returns: Vector2. Vector2 object.
-> usage:
`a = one() , b = one() , c = multiply(a, b) , plot(c.x)`
multiply(a, b)
Multiply vector `a` with `b`, in the form `(a.x * b, a.y * b)`.
Parameters:
a : Vector2 . Vector2 object.
b : float . Value.
Returns: Vector2. Vector2 object.
-> usage:
`a = one() , b = 1.0 , c = multiply(a, b) , plot(c.x)`
multiply(a, b)
Multiply vector `a` with `b`, in the form `(a * b.x, a * b.y)`.
Parameters:
a : float . Value.
b : Vector2 . Vector2 object.
Returns: Vector2. Vector2 object.
-> usage:
`a = 1.0 , b = one() , c = multiply(a, b) , plot(c.x)`
divide(a, b)
Divide vector `a` with `b`, in the form `(a.x / b.x, a.y / b.y)`.
Parameters:
a : Vector2 . Vector2 object.
b : Vector2 . Vector2 object.
Returns: Vector2. Vector2 object.
-> usage:
`a = from(3.0) , b = from(2.0) , c = divide(a, b) , plot(c.x)`
divide(a, b)
Divide vector `a` with value `b`, in the form `(a.x / b, a.y / b)`.
Parameters:
a : Vector2 . Vector2 object.
b : float . Value.
Returns: Vector2. Vector2 object.
-> usage:
`a = from(3.0) , b = 2.0 , c = divide(a, b) , plot(c.x)`
divide(a, b)
Divide value `a` with vector `b`, in the form `(a / b.x, a / b.y)`.
Parameters:
a : float . Value.
b : Vector2 . Vector2 object.
Returns: Vector2. Vector2 object.
-> usage:
`a = 3.0 , b = from(2.0) , c = divide(a, b) , plot(c.x)`
negate(a)
Negative of vector `a`, in the form `(-a.x, -a.y)`.
Parameters:
a : Vector2 . Vector2 object.
Returns: Vector2. Vector2 object.
-> usage:
`a = from(3.0) , b = a.negate , plot(b.x)`
pow(a, b)
Raise vector `a` with exponent vector `b`, in the form `(a.x ^ b.x, a.y ^ b.y)`.
Parameters:
a : Vector2 . Vector2 object.
b : Vector2 . Vector2 object.
Returns: Vector2. Vector2 object.
-> usage:
`a = from(3.0) , b = from(2.0) , c = pow(a, b) , plot(c.x)`
pow(a, b)
Raise vector `a` with value `b`, in the form `(a.x ^ b, a.y ^ b)`.
Parameters:
a : Vector2 . Vector2 object.
b : float . Value.
Returns: Vector2. Vector2 object.
-> usage:
`a = from(3.0) , b = 2.0 , c = pow(a, b) , plot(c.x)`
pow(a, b)
Raise value `a` with vector `b`, in the form `(a ^ b.x, a ^ b.y)`.
Parameters:
a : float . Value.
b : Vector2 . Vector2 object.
Returns: Vector2. Vector2 object.
-> usage:
`a = 3.0 , b = from(2.0) , c = pow(a, b) , plot(c.x)`
sqrt(a)
Square root of the elements in a vector.
Parameters:
a : Vector2 . Vector2 object.
Returns: Vector2. Vector2 object.
-> usage:
`a = from(3.0) , b = sqrt(a) , plot(b.x)`
abs(a)
Absolute properties of the vector.
Parameters:
a : Vector2 . Vector2 object.
Returns: Vector2. Vector2 object.
-> usage:
`a = from(-3.0) , b = abs(a) , plot(b.x)`
min(a)
Lowest element of a vector.
Parameters:
a : Vector2 . Vector2 object.
Returns: float.
-> usage:
`a = new(3.0, 1.5) , b = min(a) , plot(b)`
max(a)
Highest element of a vector.
Parameters:
a : Vector2 . Vector2 object.
Returns: float.
-> usage:
`a = new(3.0, 1.5) , b = max(a) , plot(b)`
vmax(a, b)
Highest elements of two vectors.
Parameters:
a : Vector2 . Vector2 object.
b : Vector2 . Vector2 object.
Returns: Vector2. Vector2 object.
-> usage:
`a = new(3.0, 2.0) , b = new(2.0, 3.0) , c = vmax(a, b) , plot(c.x)`
vmax(a, b, c)
Highest elements of three vectors.
Parameters:
a : Vector2 . Vector2 object.
b : Vector2 . Vector2 object.
c : Vector2 . Vector2 object.
Returns: Vector2. Vector2 object.
-> usage:
`a = new(3.0, 2.0) , b = new(2.0, 3.0) , c = new(1.5, 4.5) , d = vmax(a, b, c) , plot(d.x)`
vmin(a, b)
Lowest elements of two vectors.
Parameters:
a : Vector2 . Vector2 object.
b : Vector2 . Vector2 object.
Returns: Vector2. Vector2 object.
-> usage:
`a = new(3.0, 2.0) , b = new(2.0, 3.0) , c = vmin(a, b) , plot(c.x)`
vmin(a, b, c)
Lowest elements of three vectors.
Parameters:
a : Vector2 . Vector2 object.
b : Vector2 . Vector2 object.
c : Vector2 . Vector2 object.
Returns: Vector2. Vector2 object.
-> usage:
`a = new(3.0, 2.0) , b = new(2.0, 3.0) , c = new(1.5, 4.5) , d = vmin(a, b, c) , plot(d.x)`
perp(a)
Perpendicular Vector of `a`, in the form `(a.y, -a.x)`.
Parameters:
a : Vector2 . Vector2 object.
Returns: Vector2. Vector2 object.
-> usage:
`a = new(3.0, 1.5) , b = perp(a) , plot(b.x)`
floor(a)
Compute the floor of vector `a`.
Parameters:
a : Vector2 . Vector2 object.
Returns: Vector2. Vector2 object.
-> usage:
`a = new(3.0, 1.5) , b = floor(a) , plot(b.x)`
ceil(a)
Ceils vector `a`.
Parameters:
a : Vector2 . Vector2 object.
Returns: Vector2. Vector2 object.
-> usage:
`a = new(3.0, 1.5) , b = ceil(a) , plot(b.x)`
ceil(a, digits)
Ceils vector `a`.
Parameters:
a : Vector2 . Vector2 object.
digits : int . Digits to use as ceiling.
Returns: Vector2. Vector2 object.
round(a)
Round of vector elements.
Parameters:
a : Vector2 . Vector2 object.
Returns: Vector2. Vector2 object.
-> usage:
`a = new(3.0, 1.5) , b = round(a) , plot(b.x)`
round(a, precision)
Round of vector elements.
Parameters:
a : Vector2 . Vector2 object.
precision : int . Number of digits to round vector "a" elements.
Returns: Vector2. Vector2 object.
-> usage:
`a = new(0.123456, 1.234567) , b = round(a, 2) , plot(b.x)`
fractional(a)
Compute the fractional part of the elements from vector `a`.
Parameters:
a : Vector2 . Vector2 object.
Returns: Vector2. Vector2 object.
-> usage:
`a = new(3.123456, 1.23456) , b = fractional(a) , plot(b.x)`
dot_product(a, b)
dot_product product of 2 vectors, in the form `a.x * b.x + a.y * b.y.
Parameters:
a : Vector2 . Vector2 object.
b : Vector2 . Vector2 object.
Returns: float.
-> usage:
`a = new(3.0, 1.5) , b = from(2.0) , c = dot_product(a, b) , plot(c)`
cross_product(a, b)
cross product of 2 vectors, in the form `a.x * b.y - a.y * b.x`.
Parameters:
a : Vector2 . Vector2 object.
b : Vector2 . Vector2 object.
Returns: float.
-> usage:
`a = new(3.0, 1.5) , b = from(2.0) , c = cross_product(a, b) , plot(c)`
equals(a, b)
Compares two vectors
Parameters:
a : Vector2 . Vector2 object.
b : Vector2 . Vector2 object.
Returns: bool. Representing the equality.
-> usage:
`a = new(3.0, 1.5) , b = from(2.0) , c = equals(a, b) ? 1 : 0 , plot(c)`
sin(a)
Compute the sine of argument vector `a`.
Parameters:
a : Vector2 . Vector2 object.
Returns: Vector2. Vector2 object.
-> usage:
`a = new(3.0, 1.5) , b = sin(a) , plot(b.x)`
cos(a)
Compute the cosine of argument vector `a`.
Parameters:
a : Vector2 . Vector2 object.
Returns: Vector2. Vector2 object.
-> usage:
`a = new(3.0, 1.5) , b = cos(a) , plot(b.x)`
tan(a)
Compute the tangent of argument vector `a`.
Parameters:
a : Vector2 . Vector2 object.
Returns: Vector2. Vector2 object.
-> usage:
`a = new(3.0, 1.5) , b = tan(a) , plot(b.x)`
atan2(x, y)
Approximation to atan2 calculation, arc tangent of `y/x` in the range (-pi,pi) radians.
Parameters:
x : float . The x value of the vector.
y : float . The y value of the vector.
Returns: float. Value with angle in radians. (negative if quadrante 3 or 4)
-> usage:
`a = new(3.0, 1.5) , b = atan2(a.x, a.y) , plot(b)`
atan2(a)
Approximation to atan2 calculation, arc tangent of `y/x` in the range (-pi,pi) radians.
Parameters:
a : Vector2 . Vector2 object.
Returns: float, value with angle in radians. (negative if quadrante 3 or 4)
-> usage:
`a = new(3.0, 1.5) , b = atan2(a) , plot(b)`
distance(a, b)
Distance between vector `a` and `b`.
Parameters:
a : Vector2 . Vector2 object.
b : Vector2 . Vector2 object.
Returns: float.
-> usage:
`a = new(3.0, 1.5) , b = from(2.0) , c = distance(a, b) , plot(c)`
rescale(a, length)
Rescale a vector to a new magnitude.
Parameters:
a : Vector2 . Vector2 object.
length : float . Magnitude.
Returns: Vector2. Vector2 object.
-> usage:
`a = new(3.0, 1.5) , b = 2.0 , c = rescale(a, b) , plot(c.x)`
rotate(a, radians)
Rotates vector by a angle.
Parameters:
a : Vector2 . Vector2 object.
radians : float . Angle value in radians.
Returns: Vector2. Vector2 object.
-> usage:
`a = new(3.0, 1.5) , b = 2.0 , c = rotate(a, b) , plot(c.x)`
rotate_degree(a, degree)
Rotates vector by a angle.
Parameters:
a : Vector2 . Vector2 object.
degree : float . Angle value in degrees.
Returns: Vector2. Vector2 object.
-> usage:
`a = new(3.0, 1.5) , b = 45.0 , c = rotate_degree(a, b) , plot(c.x)`
rotate_around(this, center, angle)
Rotates vector `target` around `origin` by angle value.
Parameters:
this
center : Vector2 . Vector2 object.
angle : float . Angle value in degrees.
Returns: Vector2. Vector2 object.
-> usage:
`a = new(3.0, 1.5) , b = from(2.0) , c = rotate_around(a, b, 45.0) , plot(c.x)`
perpendicular_distance(a, b, c)
Distance from point `a` to line between `b` and `c`.
Parameters:
a : Vector2 . Vector2 object.
b : Vector2 . Vector2 object.
c : Vector2 . Vector2 object.
Returns: float.
-> usage:
`a = new(1.5, 2.6) , b = from(1.0) , c = from(3.0) , d = perpendicular_distance(a, b, c) , plot(d.x)`
project(a, axis)
Project a vector onto another.
Parameters:
a : Vector2 . Vector2 object.
axis : Vector2 . Vector2 object.
Returns: Vector2. Vector2 object.
-> usage:
`a = new(3.0, 1.5) , b = from(2.0) , c = project(a, b) , plot(c.x)`
projectN(a, axis)
Project a vector onto a vector of unit length.
Parameters:
a : Vector2 . Vector2 object.
axis : Vector2 . Vector2 object.
Returns: Vector2. Vector2 object.
-> usage:
`a = new(3.0, 1.5) , b = from(2.0) , c = projectN(a, b) , plot(c.x)`
reflect(a, axis)
Reflect a vector on another.
Parameters:
a : Vector2 . Vector2 object.
axis
Returns: Vector2. Vector2 object.
-> usage:
`a = new(3.0, 1.5) , b = from(2.0) , c = reflect(a, b) , plot(c.x)`
reflectN(a, axis)
Reflect a vector to a arbitrary axis.
Parameters:
a : Vector2 . Vector2 object.
axis
Returns: Vector2. Vector2 object.
-> usage:
`a = new(3.0, 1.5) , b = from(2.0) , c = reflectN(a, b) , plot(c.x)`
angle(a)
Angle in radians of a vector.
Parameters:
a : Vector2 . Vector2 object.
Returns: float.
-> usage:
`a = new(3.0, 1.5) , b = angle(a) , plot(b)`
angle_unsigned(a, b)
unsigned degree angle between 0 and +180 by given two vectors.
Parameters:
a : Vector2 . Vector2 object.
b : Vector2 . Vector2 object.
Returns: float.
-> usage:
`a = new(3.0, 1.5) , b = from(2.0) , c = angle_unsigned(a, b) , plot(c)`
angle_signed(a, b)
Signed degree angle between -180 and +180 by given two vectors.
Parameters:
a : Vector2 . Vector2 object.
b : Vector2 . Vector2 object.
Returns: float.
-> usage:
`a = new(3.0, 1.5) , b = from(2.0) , c = angle_signed(a, b) , plot(c)`
angle_360(a, b)
Degree angle between 0 and 360 by given two vectors
Parameters:
a : Vector2 . Vector2 object.
b : Vector2 . Vector2 object.
Returns: float.
-> usage:
`a = new(3.0, 1.5) , b = from(2.0) , c = angle_360(a, b) , plot(c)`
clamp(a, min, max)
Restricts a vector between a min and max value.
Parameters:
a : Vector2 . Vector2 object.
min
max
Returns: Vector2. Vector2 object.
-> usage:
`a = new(3.0, 1.5) , b = from(2.0) , c = from(2.5) , d = clamp(a, b, c) , plot(d.x)`
clamp(a, min, max)
Restricts a vector between a min and max value.
Parameters:
a : Vector2 . Vector2 object.
min : float . Lower boundary value.
max : float . Higher boundary value.
Returns: Vector2. Vector2 object.
-> usage:
`a = new(3.0, 1.5) , b = clamp(a, 2.0, 2.5) , plot(b.x)`
lerp(a, b, rate)
Linearly interpolates between vectors a and b by rate.
Parameters:
a : Vector2 . Vector2 object.
b : Vector2 . Vector2 object.
rate : float . Value between (a:-infinity -> b:1.0), negative values will move away from b.
Returns: Vector2. Vector2 object.
-> usage:
`a = new(3.0, 1.5) , b = from(2.0) , c = lerp(a, b, 0.5) , plot(c.x)`
herp(a, b, rate)
Hermite curve interpolation between vectors a and b by rate.
Parameters:
a : Vector2 . Vector2 object.
b : Vector2 . Vector2 object.
rate : Vector2 . Vector2 object. Value between (a:0 > 1:b).
Returns: Vector2. Vector2 object.
-> usage:
`a = new(3.0, 1.5) , b = from(2.0) , c = from(2.5) , d = herp(a, b, c) , plot(d.x)`
transform(position, mat)
Transform a vector by the given matrix.
Parameters:
position : Vector2 . Source vector.
mat : M32 . Transformation matrix
Returns: Vector2. Transformed vector.
transform(position, mat)
Transform a vector by the given matrix.
Parameters:
position : Vector2 . Source vector.
mat : M44 . Transformation matrix
Returns: Vector2. Transformed vector.
transform(position, mat)
Transform a vector by the given matrix.
Parameters:
position : Vector2 . Source vector.
mat : matrix . Transformation matrix, requires a 3x2 or a 4x4 matrix.
Returns: Vector2. Transformed vector.
transform(this, rotation)
Transform a vector by the given quaternion rotation value.
Parameters:
this : Vector2 . Source vector.
rotation : Quaternion . Rotation to apply.
Returns: Vector2. Transformed vector.
area_triangle(a, b, c)
Find the area in a triangle of vectors.
Parameters:
a : Vector2 . Vector2 object.
b : Vector2 . Vector2 object.
c : Vector2 . Vector2 object.
Returns: float.
-> usage:
`a = new(1.0, 2.0) , b = from(2.0) , c = from(1.0) , d = area_triangle(a, b, c) , plot(d.x)`
random(max)
2D random value.
Parameters:
max : Vector2 . Vector2 object. Vector upper boundary.
Returns: Vector2. Vector2 object.
-> usage:
`a = from(2.0) , b = random(a) , plot(b.x)`
random(max)
2D random value.
Parameters:
max : float, Vector upper boundary.
Returns: Vector2. Vector2 object.
-> usage:
`a = random(2.0) , plot(a.x)`
random(min, max)
2D random value.
Parameters:
min : Vector2 . Vector2 object. Vector lower boundary.
max : Vector2 . Vector2 object. Vector upper boundary.
Returns: Vector2. Vector2 object.
-> usage:
`a = from(1.0) , b = from(2.0) , c = random(a, b) , plot(c.x)`
random(min, max)
2D random value.
Parameters:
min : Vector2 . Vector2 object. Vector lower boundary.
max : Vector2 . Vector2 object. Vector upper boundary.
Returns: Vector2. Vector2 object.
-> usage:
`a = random(1.0, 2.0) , plot(a.x)`
noise(a)
2D Noise based on Morgan McGuire @morgan3d.
Parameters:
a : Vector2 . Vector2 object.
Returns: Vector2. Vector2 object.
-> usage:
`a = from(2.0) , b = noise(a) , plot(b.x)`
to_string(a)
Converts vector `a` to a string format, in the form `"(x, y)"`.
Parameters:
a : Vector2 . Vector2 object.
Returns: string. In `"(x, y)"` format.
-> usage:
`a = from(2.0) , l = barstate.islast ? label.new(bar_index, 0.0, to_string(a)) : label(na)`
to_string(a, format)
Converts vector `a` to a string format, in the form `"(x, y)"`.
Parameters:
a : Vector2 . Vector2 object.
format : string . Format to apply transformation.
Returns: string. In `"(x, y)"` format.
-> usage:
`a = from(2.123456) , l = barstate.islast ? label.new(bar_index, 0.0, to_string(a, "#.##")) : label(na)`
to_array(a)
Converts vector to a array format.
Parameters:
a : Vector2 . Vector2 object.
Returns: array.
-> usage:
`a = from(2.0) , b = to_array(a) , plot(array.get(b, 0))`
to_barycentric(this, a, b, c)
Captures the barycentric coordinate of a cartesian position in the triangle plane.
Parameters:
this : Vector2 . Source cartesian coordinate position.
a : Vector2 . Triangle corner `a` vertice.
b : Vector2 . Triangle corner `b` vertice.
c : Vector2 . Triangle corner `c` vertice.
Returns: bool.
from_barycentric(this, a, b, c)
Captures the cartesian coordinate of a barycentric position in the triangle plane.
Parameters:
this : Vector2 . Source barycentric coordinate position.
a : Vector2 . Triangle corner `a` vertice.
b : Vector2 . Triangle corner `b` vertice.
c : Vector2 . Triangle corner `c` vertice.
Returns: bool.
to_complex(this)
Translate a Vector2 structure to complex.
Parameters:
this : Vector2 . Source vector.
Returns: Complex.
to_polar(this)
Translate a Vector2 cartesian coordinate into polar coordinates.
Parameters:
this : Vector2 . Source vector.
Returns: Pole. The returned angle is in radians.
Vector ScalerVector Scaler is like Stochastic but it uses a different method to scale the input. The method is very similar to vector normalization but instead of keeping the "vector" we just sum the three points and average them. The blue line is the signal line and the orange line is the smoothed signal line. I have added the "J" line from the KDJ indicator to help spot divergences. Differential mode uses the delta of the input for the calculations. Here are some pictures to help illustrate how this works relative to other popular indicators.
Vector Scaler vs Stochastic
Vector Scaler vs Smooth Stochastic RSI
average set to 100
average set to 200
