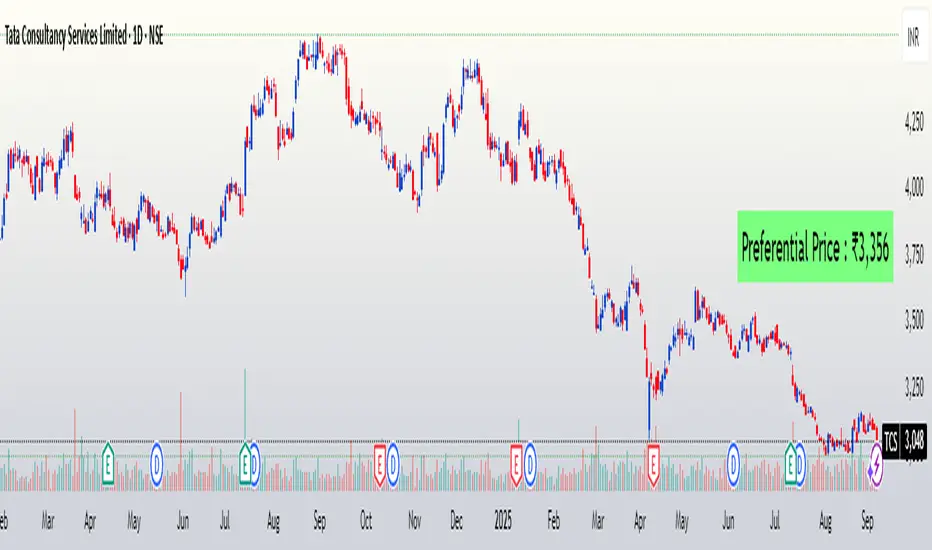
FuTech : Preferential Price📌 First Ever Indicator : FuTech : Preferential Price
💡 What if you could instantly know the Preferential Price — as if the company announced a preferential issue in today’s meeting surprisingly?
Normally, you’d be stuck with tedious valuation spreadsheets and SEBI formula checks 🧮📑…
✨ But not anymore — this tool does the hard work for you!
With just one click, it auto-calculates the Preferential Issue Floor Price under SEBI ICDR Regulations, 2018 - Regulation 164 (as amended), directly from your chart symbol.
✅ How it works ?
📅 Relevant Date = 30 days prior to either:
• Today’s date (default mode)
• Or your chosen EGM date (user input)
📊 For the Relevant Date, the indicator automatically computes:
• VWAP (90 trading days preceding Relevant Date)
• VWAP (10 trading days preceding Relevant Date)
🔎 As per SEBI Reg.164, the higher of these two VWAPs is selected as the Minimum Issue Price (Preferential Price).
💰 Price is neatly formatted in Indian style (e.g. ₹1,00,000).
✅ Key Features:
⚡ Auto-calculates from chart symbol — no manual entry.
🎛️ Option to input EGM date for accurate floor price compliance.
🎨 Fully customizable: text color, size, background, position.
🪄 Clean display → shows only the final Preferential Price (Reg.164).
📌 Usage:
This indicator is built for analysts, fund managers, and corporate professionals dealing with Preferential Allotment pricing compliance.
It ensures quick visibility of the floor price under SEBI ICDR rules, directly on your chart.
⚠️ Disclaimer:
📌 The calculated Preferential Price is an approximation based on SEBI ICDR Reg.164 methodology.
📊 Actual price determined by the company / merchant banker may vary slightly (±5) due to rounding, data source differences, or timing adjustments.
📅 Ensure to verify with official exchange data and SEBI filings before relying on these numbers.
📝 This tool is meant for analytical and educational purposes only, not a substitute for regulatory or professional advice.
Analisi fondamentale

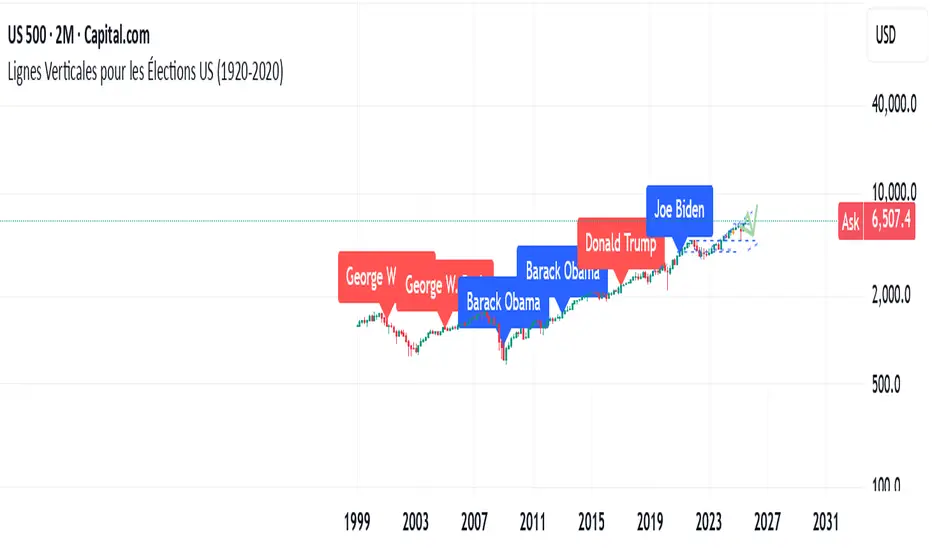
US Elections Democrate-Republicain (1920-2025)This script shows the different U.S. presidents and indicates whether each was Democratic or Republican. It allows users to analyze the market based on the president in office.
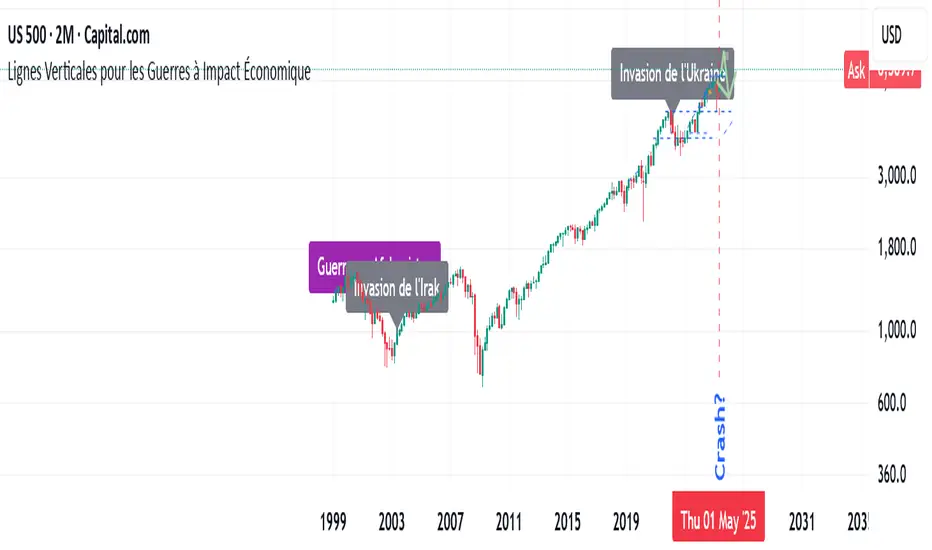
Major Wars with a signifiant economic impactThis indicator highlights major wars that have had a significant economic impact worldwide. It allows users to easily see their effects on the charts.
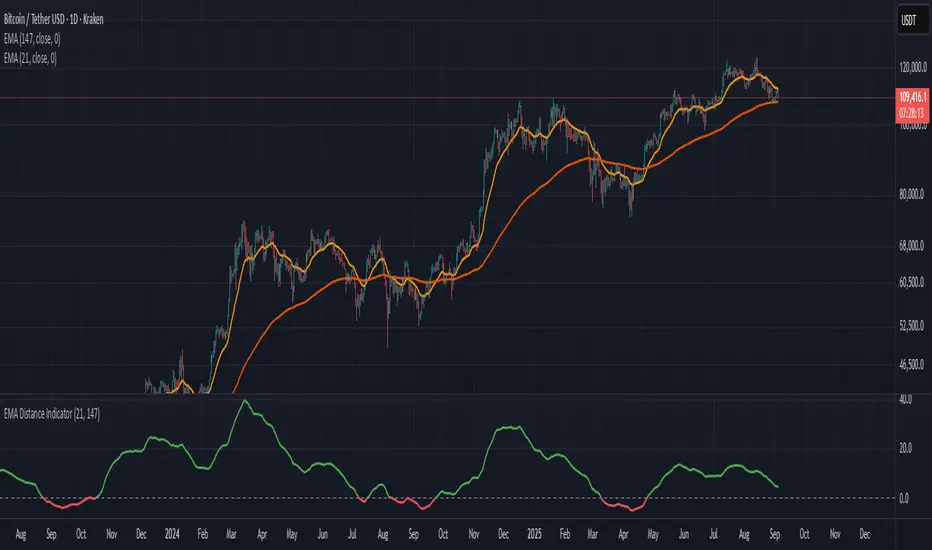
Distance Between EMA'sThis indicator measures the distance between any two EMA's you choose. You can change the EMA's by clicking settings and change the inputs to the two that you choose
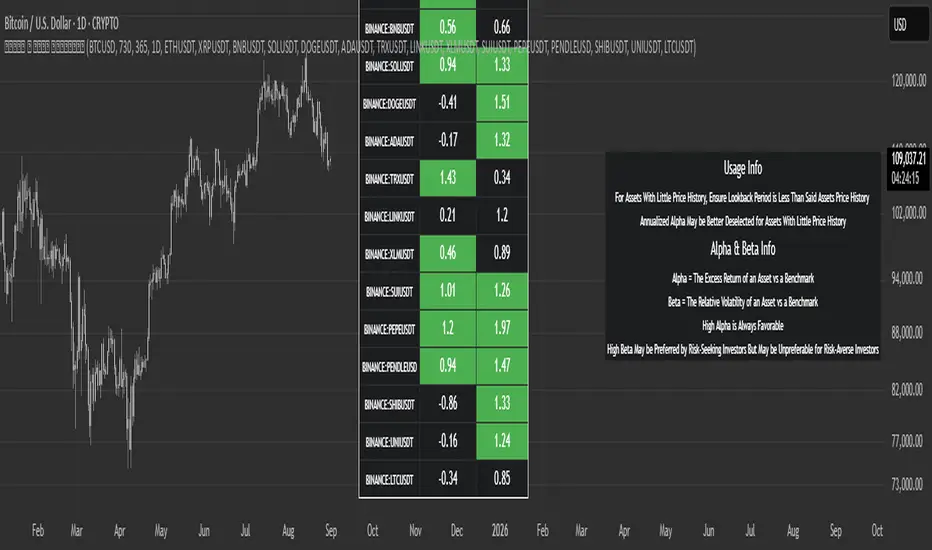
Futures Multi-Asset Open Distance Table## Multi-Asset Open Distance Table - Quick Description
This Pine Script indicator displays a **real-time table** that tracks how far **three user-selected assets** are from their key opening price levels.
**What it shows:**
- **Three customizable assets** (default: NQ!, ES!, YM!)
- **Distance from 3 key opens** for each asset:
- **1800 ET Open** (Electronic trading session start)
- **0930 ET Open** (Regular market hours start)
- **Weekly Open** (Beginning of trading week)
**Visual features:**
- **Percentage changes** from each open level
- **Color coding**: Green for gains above opens, red for losses below opens
- **Direction arrows**: ▲ (above), ▼ (below), ■ (unchanged)
- **Customizable table position** and size
**Perfect for:**
- **Intraday traders** monitoring key session levels
- **Multi-timeframe analysis** across different market opens
- **Quick reference** to see which assets are performing relative to major opening levels
- **Session-based trading strategies** using 6PM and 9:30AM opens
The table updates in real-time and provides an at-a-glance view of where your chosen assets stand relative to these critical price reference points throughout the trading day.

Options Greeks AnalyzerOptions Greeks Analyzer (Training & Learning Guide)
________________________________________
1. Introduction
Options trading is advanced compared to regular stock trading, and one of the most important aspects is Options Greeks. Greeks are mathematical values that measure how the price of an option will react to changes in various factors such as the underlying asset’s price, volatility, interest rates, and time to expiry.
This Options Greeks Analyzer tool is built using TradingView Pine Script v5. It serves as a real time training and analysis dashboard that helps learners visualize how options greeks behave, how option prices change, and how traders can make informed decisions.
📌 Educational Disclaimer:
This tool is only for training and learning purposes. It is not a financial advice tool nor to be used for live trading decisions. The data shown is theoretical Black Scholes model calculations, which may differ from actual option market prices.
________________________________________
2. How the Tool Works
The Options Greeks Analyzer is divided into different modules. Below is a step by step walkthrough:
________________________________________
Step 1: User Inputs
• Implied Volatility (IV%) — You can manually enter volatility, which is the most important factor in option pricing. Higher IV = higher option premium.
• Expiry Selection — Choose from preset durations like 7D, 14D, 30D etc. Days to expiry directly affect time decay (Theta).
• Strike Price Mode — You can select either:
o ATM (At-the-Money = Current price of stock/index)
o Custom strike (Enter your own strike price)
• Risk-Free Rate (%) — A small interest rate factor (like government bond yield) used for theoretical valuation.
• Table Customization — Choose table size, position, and whether to show price lines for easy visibility.
________________________________________
Step 2: Market Data & Volatility
• The tool takes the current market price (Spot Price) as input.
• It calculates realized volatility from historical price fluctuations (using past 30 bars/log returns).
• Implied Volatility (manual input) is then compared to realized vol:
o If IV > Historical Volatility → Market pricing is “expensive” (HIGH IV RANK).
o If IV < Historical Volatility → Market is “cheap” (LOW IV RANK).
o Otherwise, it’s MEDIUM.
📌 Why it matters?
Traders can decide whether buying or selling options is favorable. Beginners learn that timing entry with volatility is more critical than just looking at market direction.
________________________________________
Step 3: Black-Scholes Formula
The core engine uses the Black-Scholes model, a mathematical formula widely used to compute option fair prices.
It uses the following inputs:
• Current price (Spot)
• Strike Price
• Time to Expiry (T)
• Risk Free Rate (r)
• Implied Volatility (σ)
This produces:
• Call Option Price
• Put Option Price
📌 This teaches learners how premiums are derived theoretically and why the same strike can have different values depending on IV and time.
________________________________________
Step 4: Option Greeks Calculation
The tool computes the first order Greeks:
• Delta → Measures how much the option price changes when the underlying stock moves by 1 point.
(Call Delta ranges 0–1, Put Delta ranges -1 to 0).
• Gamma → Sensitivity of Delta to price change. A measure of volatility risk.
• Theta → Time decay. Shows how much value option loses as each day passes. Calls and Puts have negative Theta (decay).
• Vega → Measures how sensitive option price is to volatility changes.
• Rho → Interest rate sensitivity. Mostly minor in equity options but important for training.
📌 New traders learn how each factor impacts profits/losses. Instead of random guessing, they see mathematical impact in numbers.
________________________________________
Step 5: Dashboard & Visualization
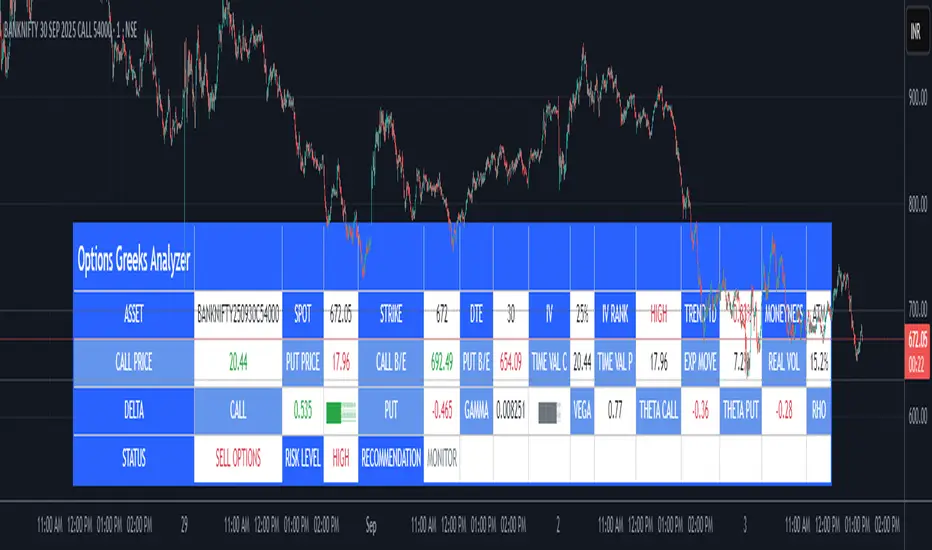
The tool builds a professional dashboard table on the chart.
It shows categories such as:
1. Asset Info — Spot, Strike, DTE (days to expiry), IV%, IV Rank, 1-Day Trend, Moneyness (ATM/OTM/ITM).
2. Option Prices — Call, Put, Break-even levels, Time Value, Expected Move (%), Realized vs Implied Vol.
3. Greeks with Visual Progress Bars — Easily shows Delta, Gamma, Vega, Theta, Rho in intuitive graphical representations.
4. Status Bar — Suggests theoretical bias like:
o HIGH IV → Favor Option Selling
o LOW IV → Favor Option Buying
o MEDIUM → Neutral observation
5. Recommendation Line — Offers training-based suggestions like “Buy Straddles”, “Sell Call Spreads”, etc. These are not signals, but scenarios to learn strategies.
________________________________________
3. How It Helps Beginners
1. Learn Greeks in Action:
Beginners often memorize formulas but never see real-time changes. This dashboard updates every bar to show how Greeks change dynamically.
2. Compare Volatilities:
Traders understand difference between historical vs implied volatility and why option premiums behave differently.
3. Understand Risk Levels:
The tool highlights when Gamma risk is high (danger for sellers) or when Theta is most favorable.
4. Training Mode for Strategies:
Helps beginners experiment by changing IV, strike, expiry and seeing how straddles, spreads, naked options would behave theoretically.
5. Prepares Before Live Trading:
Safe environment to practice option analysis without risking capital.
________________________________________
4. Educational Use Cases
• Scenario 1: Change expiry from 7D to 30D — see how Theta becomes slower for longer expiries.
• Scenario 2: Increase IV from 25% to 80% — watch how option premiums inflate, and recommendation changes from “Buy” to “Sell”.
• Scenario 3: Select OTM vs ITM strikes — check how delta moves from near 0 to near 1.
By running these scenarios, learners understand why professional traders hedge Greeks instead of directional gambling.
________________________________________
5. Disclaimer
This Options Greeks Analyzer is built strictly for educational and training purposes.
• It uses theoretical formulas (Black-Scholes) that may not match actual option market prices.
• The recommendations are for learning strategy logic only, not real-world execution signals.
• Trading in options carries significant risks and may result in capital loss.
📌 Always consult with a financial advisor before applying real strategies.
________________________________________
✅ Summary
This Options Greeks Analyzer:
• Teaches how Greeks, IV, and premiums work.
• Provides a real-time interactive dashboard for training.
• Helps beginners practice option scenarios safely.
• Is meant strictly for learning and not live trading execution.
________________________________________
________________________________________
Disclaimer from aiTrendview
This script and its trading signals are provided for training and educational purposes only. They do not constitute financial advice or a guaranteed trading system. Trading involves substantial risk, and there is the potential to lose all invested capital. Users should perform their own analysis and consult with qualified financial professionals before making any trading decisions. aiTrendview disclaims any liability for losses incurred from using this code or trading based on its signals. Use this tool responsibly, and trade only with risk capital.
Molina Prob-Score + FVG + S/R (v1.2)it computes a weighted bull/bear score (0–100%), highlights ICT-style FVGs, marks pivot S/R, and gives simple entry flags. tune the weights to your style.

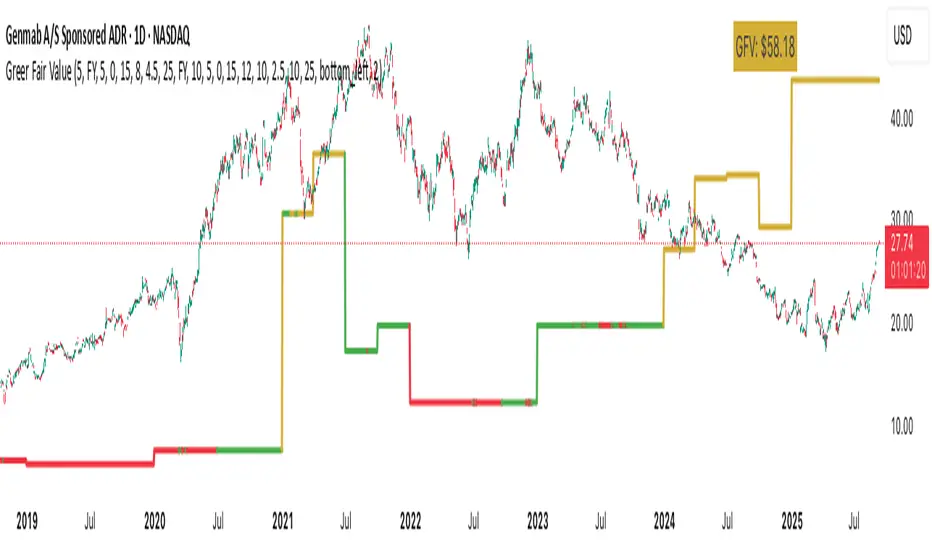
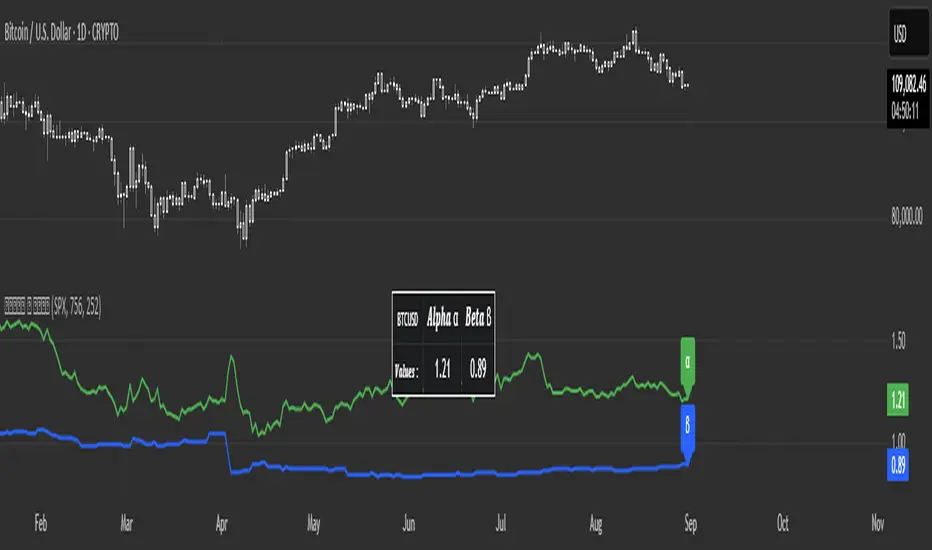
Greer Fair Value✅ Greer Fair Value
Greer Fair Value: Graham intrinsic value + Buffett-style DCF with auto EPS/FCF and auto growth (CAGR of FCF/share), defaulting to a simple GFV badge that color-codes opportunity at a glance.
📜 Full description
Greer Fair Value is inspired by the valuation frameworks of Benjamin Graham and Warren Buffett. It combines Graham’s rate-adjusted intrinsic value with a two-stage, per-share DCF. The script auto-populates EPS (TTM) and Free Cash Flow per share (FY/FQ/TTM) from request.financial(), and can auto-estimate the near-term growth rate (g₁) using the CAGR of FCF/share over a user-selected lookback (with sensible caps). All assumptions remain editable.
Default view: only the GFV badge is shown to keep charts clean.
Badge color logic:
Gold — both DCF and Graham fair values are above the current price
Green — exactly one of them is above the current price
Red — the current price is above both values
Show more detail (optional):
Toggle “Show Graham Lines” and/or “Show DCF Lines” to plot fair values (and optional MoS bands) over time.
Toggle “Show Dashboard” for a compact data table of assumptions and outputs.
Optional summary label can be enabled for a quick on-chart readout.
Inputs you can customize: EPS source/manual fallback, FCF/share source (FY/FQ/TTM), g₁ auto-CAGR lookback & caps, terminal growth gT, discount rate r, MoS levels, step-style plots, table position, and decimals.
Note: TradingView’s UI controls whether “Inputs/Values in Status Line” are shown. If you prefer a clean status line, open the indicator’s settings and uncheck those options, then Save as default.
Disclaimer: For educational/informational purposes only; not financial advice. Markets involve risk—do your own research.
MomentumScriptThis is Momentum Tracker based on Richard Driehaus' research:
1) 12–1 momentum (return from t-12 months to t-1 month
2) FIP / path efficiency (many small up days > one big gap)
3) Proximity to 52-week high/low

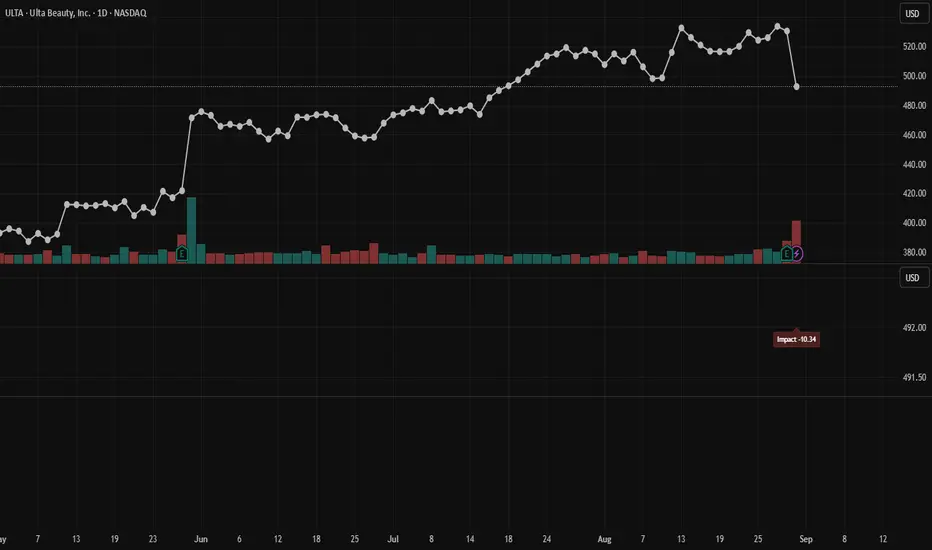
Impact Score (ATR% × RVOL)Calculates Impact Score (ATR% × RVOL). This number helps determine if a movement in price is a "thin drop" meaning the drop had relatively low volume and is likely to bounce back, or if it's heavy drop, meaning that it had high volume and less likely to rebound as soon e.g., results from earnings report.
P/B Ratio (Per Share) vs Median + Bollinger Band- 📝 This indicator highlights potential buying opportunities by analyzing the Price-to-Book (P/B) ratio in relation to Bollinger Bands and its historical median.
- 🎯 The goal is to provide a visually intuitive signal for value-oriented entries, especially when valuation compression aligns with historical context.
- 💡 Vertical green shading is applied when the P/B ratio drops below the lower Bollinger Band, which is calculated directly from the P/B ratio itself — not price. This condition often signals the ticker may be oversold.
- 🟢 Lighter green appears when the ratio is below the lower band but above the median, suggesting a possible shorter-term entry with slightly more risk.
- 🟢 Darker green appears when the ratio is both below the lower band and below the median, pointing to a potentially stronger, longer-term value entry.
- ⚠️ This logic was tested using 1 and 2-day time frames. It may not be as helpful in longer time frames, as the financial data TradingView pulls in begins in Q4 2017.
- ⚠️ Note: This script relies on financial data availability through TradingView. It may not function properly with certain tickers — especially ETFs, IPOs, or thinly tracked assets — where P/S ratio data is missing or incomplete.
- ⚠️ This indicator will not guarantee successful results. Use in conjunction with other indicators and do your due diligence.
- 🤖 This script was iteratively refined with the help of AI to ensure clean logic, minimalist design, and actionable signal clarity.
- 📢 Idea is based on the script "Historical PE ratio vs median" by haribotagada
- 💬 Questions, feedback, or suggestions? Drop a comment — I’d love to hear how you’re using it or what you'd like to see changed.

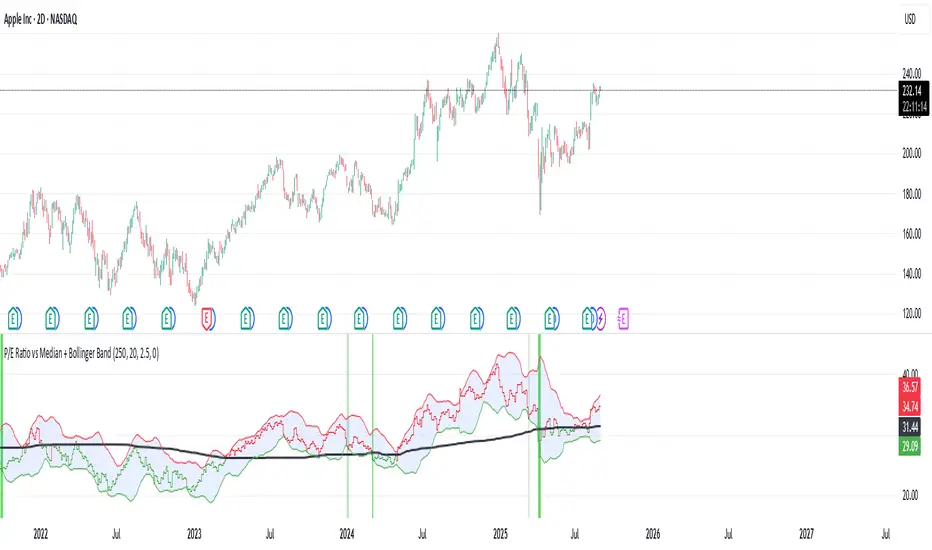
P/E Ratio vs Median + Bollinger Band- 📝 This indicator highlights potential buying opportunities by analyzing the Price-to-Earnings (P/E) ratio in relation to Bollinger Bands and its historical median.
- 🎯 The goal is to provide a visually intuitive signal for value-oriented entries, especially when valuation compression aligns with historical context.
- 💡 Vertical green shading is applied when the P/E ratio drops below the lower Bollinger Band, which is calculated directly from the P/E ratio itself — not price. This condition often signals the ticker may be oversold.
- 🟢 Lighter green appears when the ratio is below the lower band but above the median, suggesting a possible shorter-term entry with slightly more risk.
- 🟢 Darker green appears when the ratio is both below the lower band and below the median, pointing to a potentially stronger, longer-term value entry.
- ⚠️ This logic was tested using 1 and 2-day time frames. It may not be as helpful in longer time frames, as the financial data TradingView pulls in begins in Q4 2017.
- ⚠️ Note: This script relies on financial data availability through TradingView. It may not function properly with certain tickers — especially ETFs, IPOs, or thinly tracked assets — where P/S ratio data is missing or incomplete.
- ⚠️ This indicator will not guarantee successful results. Use in conjunction with other indicators and do your due diligence.
- 🤖 This script was iteratively refined with the help of AI to ensure clean logic, minimalist design, and actionable signal clarity.
- 📢 Idea is based on the script "Historical PE ratio vs median" by haribotagada
- 💬 Questions, feedback, or suggestions? Drop a comment — I’d love to hear how you’re using it or what you'd like to see changed.
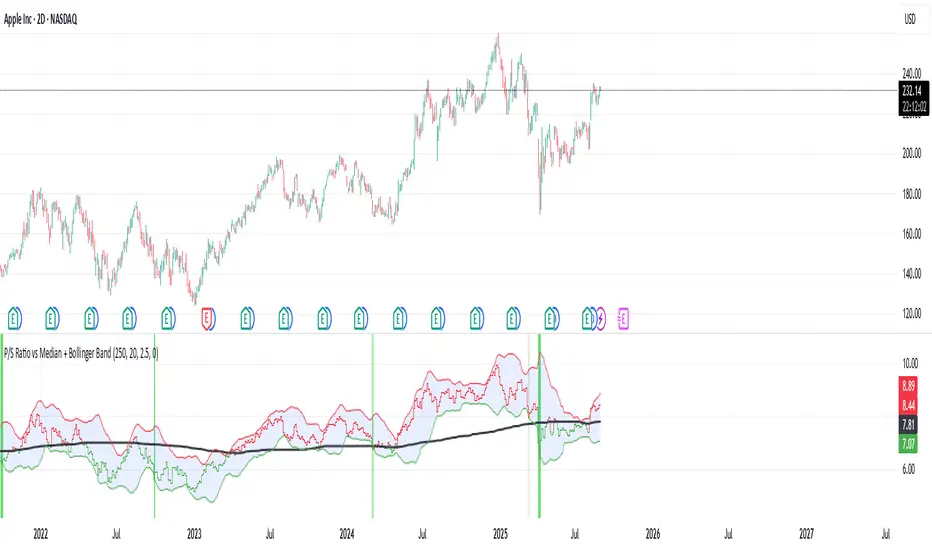
P/S Ratio vs Median + Bollinger Band- 📝 This indicator highlights potential buying opportunities by analyzing the Price-to-Sales (P/S) ratio in relation to Bollinger Bands and its historical median.
- 🎯 The goal is to provide a visually intuitive signal for value-oriented entries, especially when valuation compression aligns with historical context.
- 💡 Vertical green shading is applied when the P/S ratio drops below the lower Bollinger Band, which is calculated directly from the P/S ratio itself — not price. This condition often signals the ticker may be oversold.
- 🟢 Lighter green appears when the ratio is below the lower band but above the median, suggesting a possible shorter-term entry with slightly more risk.
- 🟢 Darker green appears when the ratio is both below the lower band and below the median, pointing to a potentially stronger, longer-term value entry.
- ⚠️ This logic was tested using 1 and 2-day time frames. It may not be as helpful in longer time frames, as the financial data TradingView pulls in begins in Q4 2017.
- ⚠️ Note: This script relies on financial data availability through TradingView. It may not function properly with certain tickers — especially ETFs, IPOs, or thinly tracked assets — where P/S ratio data is missing or incomplete.
- ⚠️ This indicator will not guarantee successful results. Use in conjunction with other indicators and do your due diligence.
- 🤖 This script was iteratively refined with the help of AI to ensure clean logic, minimalist design, and actionable signal clarity.
- 📢 Idea is based on the script "Historical PE ratio vs median" by @haribotagada
- 💬 Questions, feedback, or suggestions? Drop a comment — I’d love to hear how you’re using it or what you'd like to see changed.
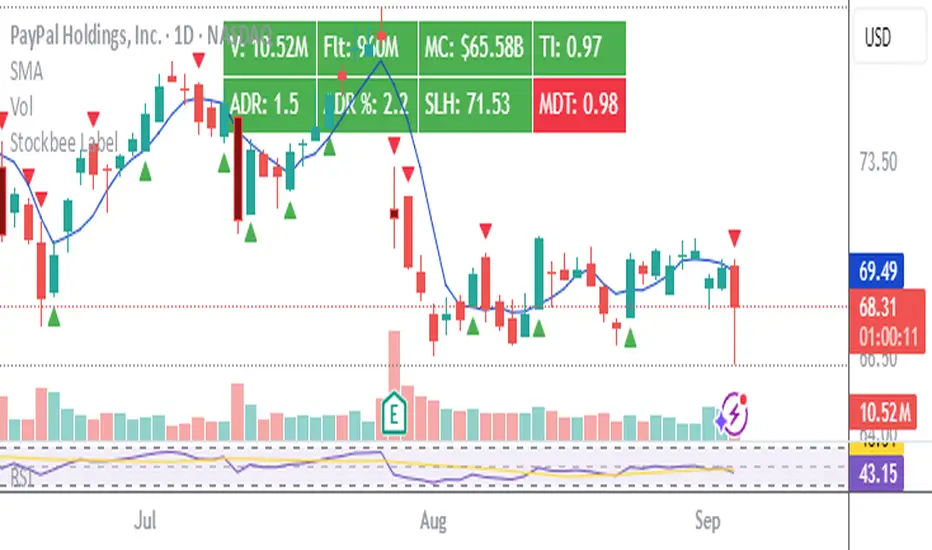
Stockbee LabelUnlock the full potential of your TradingView charts with this powerful indicator designed specifically for Stockbee methods. Instantly gain key market insights at a glance with a sleek, easy-to-read label displayed on your chart. This dynamic label provides critical data including Volume, Total Float, Market Capitalization, Trend Intensity, Average Daily Range (ADR), Half-Day Stop Loss level, and Modified Double Trouble (MDT) .
Elevate your trading strategy with real-time, essential metrics all in one place—streamlining your decision-making and boosting your confidence in the market.
Disclaimer: This indicator is inspired by and built upon the original concepts of Stockbee and EG.
Future Value ProjectionFuture Value Projection with Actual CAGR
This indicator calculates the future value (FV) of the current ticker’s price using its historical Compound Annual Growth Rate (CAGR). It measures how much the price has grown over a chosen lookback period, derives the average annual growth rate, and then projects the current price forward into the future.
Formulae:
CAGR:
CAGR = ( PV_now / PV_past )^(1 / t) - 1
Future Value:
FV = PV_now × ( 1 + CAGR / n )^( n × T )
Where:
PV_now = Current price
PV_past = Price t years ago
t = Lookback period (years)
CAGR = Compound Annual Growth Rate
n = Compounding periods per year (1=annual, 12=monthly, 252=daily, etc.)
T = Projection horizon (years forward)
How it works:
Select a lookback period (e.g., 3 years).
The script finds the price from that time and computes the CAGR.
It then projects the current price forward by T years using the CAGR.
The chart shows:
Current price (blue)
Projected FV target (green)
A table with CAGR and projection details
Use case:
Helps investors and traders visualize long-term growth projections if the ticker continues growing at its historical pace.

VWAP Confluência 3x VWAP Confluence 3x — Daily · Weekly · Anchored
Purpose
A pragmatic VWAP suite for execution and risk management. It plots three institutional reference lines: Daily VWAP, Weekly VWAP, and an Anchored VWAP (AVWAP) starting from a user-defined event (news, earnings, session open, swing high/low).
Why it matters
VWAP is the market’s “fair price” weighted by where volume actually traded. Confluence across timeframes and events turns noisy charts into actionable bias and clean levels.
What it does
Daily VWAP — resets each trading day; intraday “fair value.”
Weekly VWAP — resets each week; swing context and larger player defense.
Anchored VWAP — starts at a precise timestamp you set (e.g., news release).
Price source toggle — Typical Price
(
𝐻
+
𝐿
+
𝐶
)
/
3
(H+L+C)/3 or Close.
Visibility switches — enable/disable each line independently.
Anchor marker — labels the first bar of the AVWAP.
Inputs
Show Daily VWAP (on/off)
Show Weekly VWAP (on/off)
Show Anchored VWAP (on/off)
Price Source: Typical (H+L+C)/3 or Close
Anchor Time: timestamp of your event (uses the chart/exchange timezone)
How to anchor to a news event
Find the exact release time as shown in your chart’s timezone.
Open the indicator settings → set Anchor Time to that minute.
The AVWAP begins at that bar and accumulates forward.
Playbook (examples, not signals)
Strong long bias: price above Daily and Weekly VWAP; AVWAP reclaimed after news.
Strong short bias: price below Daily and Weekly; AVWAP reject after news.
Mean-revert zones: price stretches far from the active VWAPs and snaps back; size around VWAP with tight risk.
Targets: opposite VWAP, prior day/week highs/lows, or liquidity pools near AVWAP.
Best used with
Session highs/lows, liquidity sweeps, volume profile, and time-of-day filters.
Notes & limitations
Works best on markets with reliable volume (equities, futures, liquid crypto). FX spot uses synthetic volume—interpret accordingly.
Anchor Time respects the chart’s timezone. Convert news times before setting.
This is an indicator, not a backtestable strategy. No trade advice.
Disclaimer
For educational purposes only. Trading involves risk. Do your own research and manage risk responsibly.

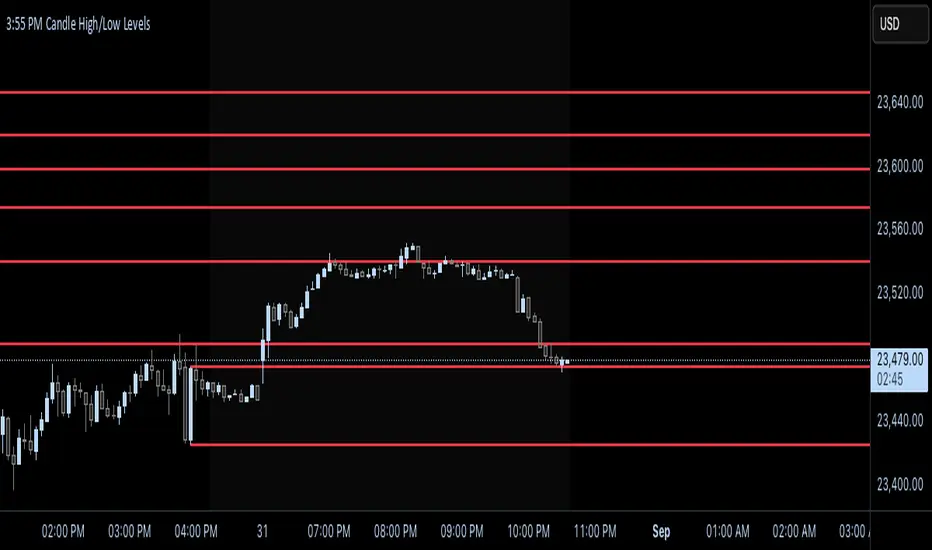
Future 8 AM MarkerThis simple script marks the 8:00 AM New York open on the chart each day. It’s especially useful in Replay Mode to track price reactions and practice setups around this key time.

Big Mo’s Glaskugel — Macro Drawdown Risk (v1.1.2)What it does / what you see
An at-a-glance drawdown-risk oscillator that blends several macro US signals.
• A smooth, color-blended line (green→orange→red) shows the scaled risk score (0–100).
• Subtle shading marks “re-steepen warning windows” (starts when the yield curve re-steepens after an inversion; ends on normalization/cool-down).
• A compact status table summarizes: overall risk level, Yield Curve (10y–3m), Credit Stress (Baa–10y), Economy (LEI), and Valuation (CAPE).
Data used & why
Yield Curve (10y–3m) — FRED:T10Y3M. Inversions and subsequent re-steepens often precede recessions/equity drawdowns.
Credit Stress — FRED:BAA10Y vs its 1-year average (deviation in bps). Widening credit spreads flag tightening financial conditions.
Economy (LEI) — ECONOMICS:USLEI. 6-month annualized growth below a cutoff highlights macro deterioration.
Valuation (CAPE) — SHILLER_PE_RATIO_MONTH. Elevated valuations can amplify downside risk.
VIX spikes — optional boost that recognizes sudden risk repricings.
Important disclaimer
This is not a reliable or predictive indicator in all regimes. No guarantees or warranties of any kind are provided. It is not financial advice. Signals can be early, late, or wrong.
That said, it leans on well-studied warning factors (yield-curve dynamics, credit spreads, LEI weakness, valuation extremes) that have flagged major market downturns in the past.
Key customization / tweaks
Weights for each component (Yield, Credit, LEI, VIX, CAPE).
Thresholds: yield inversion months, re-steepen lookback, credit-stress bps, LEI cutoff, CAPE level, VIX spike levels.
Re-steepen boost: enable/disable, base points, half-life decay.
Shading behavior: cool-down bars to “unwarn,” max warning duration, only shade when risk ≠ green.
Scaling & smoothing: dynamic rolling max, EMA length, yellow/red thresholds.
Status table: position, and a snapshot mode to view values at a chosen historical time.

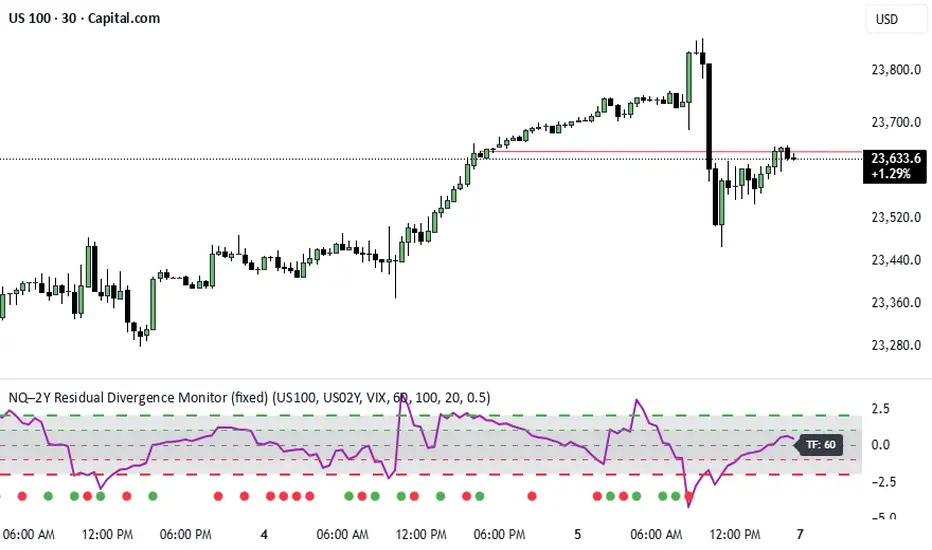
NQ–2Y CorrelationThis indicator tracks the relationship between the Nasdaq futures (NQ) and the US 2-Year Treasury yield (US02Y). The two typically move in opposite directions. This tool highlights when that relationship breaks down, and when moves become stretched to extremes. This can be useful for traders to find inflection points in price representing either overbought or oversold extremes.
Key Features
Residual Z-Score: Shows how far NQ’s returns deviate from what would be expected given moves in the 2Y. Useful for spotting stretched conditions (+/- 2σ bands).
Correlation Tracking: Fast and slow correlations between NQ and inverted 2Y returns. Helps identify regime shifts in the relationship.
Same-Direction Signals: Green dots mark when NQ and 2Y both move strongly in the same direction (rare alignment). Red dots mark strong opposing moves.
Alerts: Triggers available for residual stretches, correlation flips, and significant same-direction or opposite moves.
Usage
Monitor Z-Score to identify when the equity–rates linkage is stretched beyond typical bounds. I typically use this on the H1 or H4 timeframe.
Watch for correlation regime shifts to spot changing market dynamics. Typically price falling into support or moving into resistance as there is a false correlation or a flip.
Same-direction dots help flag unusual synchronized moves between risk assets and yields - these are especially useful for identifying false moves.