Futures APRFutures basis % for any ticker.
Requires: an index to compare against, the futures ticker, and the expiration year/month/day/hour. Optional second ticker to compare with.
Example explanation using bitcoin futures:
For Deribit, their futures expire at 0800UTC and the ticker will show the date of expiration. For example, BTC27H20's expiration is the 27th of March, 2020, at 0800UTC. For BitMEX, their futures expire at 1200UTC and have the same expiration dates.
www.deribit.com
"3 and 6 months quarterly of the March, June, September, December cycle; Quarterly futures expire the last Friday of each calendar quarter at 08.00 UTC."
www.bitmex.com
Archived page here: archive.is
"This contract settles on the .BXBT30M Index value as of the Jun 26, 5:00 AM (12:00:00 PM UTC)."
Once the June 2020 contract does expire you can always replace "XBTM20" with the currently running contract.
Notes on futures charts that never expire:
For OKEx, their futures charts are continuous, meaning that the indicator's values won't be accurate past prior expirations. This will be the same for other continuous futures charts such as BTC1!. This is because they are displaying previously expired contracts combined together.
Futures
Dunnigan's Way TrendA rising trend requires two consecutive days of high and low points are relatively high prices, so as to confirm that the point reached by the price operation is higher than the high point in the falling trend. This judgment mode is very simple and effective, not inferior to those more complex methods.
一个升势需要连续两天的高点和低点均居于相对较高的价位, 从而确认价格运行所达到的点位高于降势中的高点,这种判断模式非常简洁,而且效果很好,不次于那些比较复杂的方法。

Bitcoin Futures SentimentMonitors the sentiment across Bitcoin Futures, large discrepancies indicate potential low risk (buy/green) and high risk (sell/red) zones.

Ichimoku+P&F+Stoch+NoRange+HL+crossupThis is a highly advance trading strategy for high frequency trading on Bitmex, Binance Futures, ByBit and others. I'm using variations of this script to manage $500K institutional account! Forward tested results available for 1.5 years. This script uses combination of Ichimoku cloud on multi-timeframe. Uses Stochastic RSI indicator on multi-timeframe. Uses Point and Figure analysis. Used EMA crossup for longs
Currently looking for Beta Testers.
Instructions:
1. Each coin is unique so needs a lot of time to fine tune the parameters.
2. This parameters tuned only for Longs (inquire for Shorts)
3. This is only tuned for BTC but I have tuned parameters for all coins (inquire for help)
Settings:
1. Chart timeframe: 3
2. P&F timeframe: 1
3. Ichimoku timeframe: 15
5. Stochastic timeframe: 15
Current exchange integration: Bitmex, Binance Futures, Bybit... More will be added soon.


Trendy Bar Trend ColorTrendy Bar Trend Color
Inspired by trend candlestick charts on other trading platforms. Changes bar colors to stay in trend much like Heikin Ashi candles without the ATR price distortion. This is done by comparing the HL2 and/or Open-Close values of current candlestick to the prior candlestick.

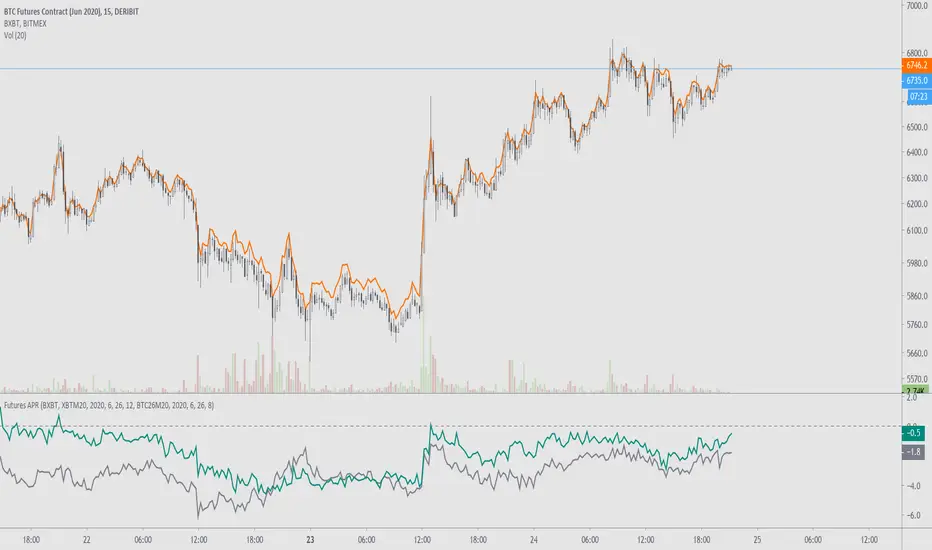
Deribit Contango Calculator v3Same as XBT Contango Calc V3, however built specifically for Deribit Futures . See link to XBT Contango Calc V3 for full description.
Above is capture of how this indicator performed on December Futures Contract BTC27Z19, since I assume I will loose this as the main chart when I update to June contract
Current (Dec. 2019) futures contracts are as follows:
Blue = BTC26M20
Orange = BTC27H20

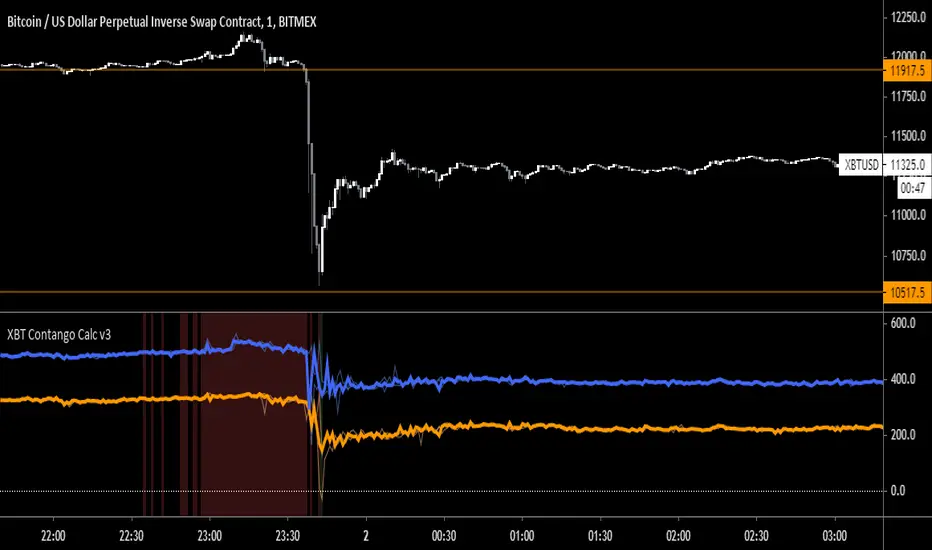
XBT Contango Calculator v3Since creating the first version of the XBT Contango Calculator, I found that the first version is good a calculating contango and backwardation in real time, however does not do a good job of capturing historical data of brief moves. Since backwardation moves are often brief, and since the first version Contango Calc was based on candlestick closes, it did not do a good job of recording the move after it occurred.
It took me a couple versions to try and fix this an eventually settled on version 3 which I have been using on my own for the last few months. You can see in the comparison chart above it does a much better job of capturing backwardation moves and extreme contango. Below is a comparison of how it performed vs. Version 1 during December futures XBTZ19
In addition I have added high/low lines that can be used to understand the amount that futures premium/discount has moved in a specific time frame. For example, the big drop Bitcoin had on September 24th, XBTZ19 went from +$273 contango to -$247 backwardation = $520 move! This move was in addition to the spot price move which was almost -$1,700 from high to low and -$1,100 from open to close. See below:
The high/low lines can also be removed from the chart by unchecking a box in the input tab.
The last update is the ability to lock the spot price to be XBT (index) no matter what chart you pull up. This can be useful if evaluation XBT futures correlation to other bitcoin derivatives such as GBTC or CME futures. You can also disable this feature in the input tab, which will then just calculate based on the current chart you are viewing.
Current Contracts (December 2019)
Blue = XBTM20
Orange = XBTH20
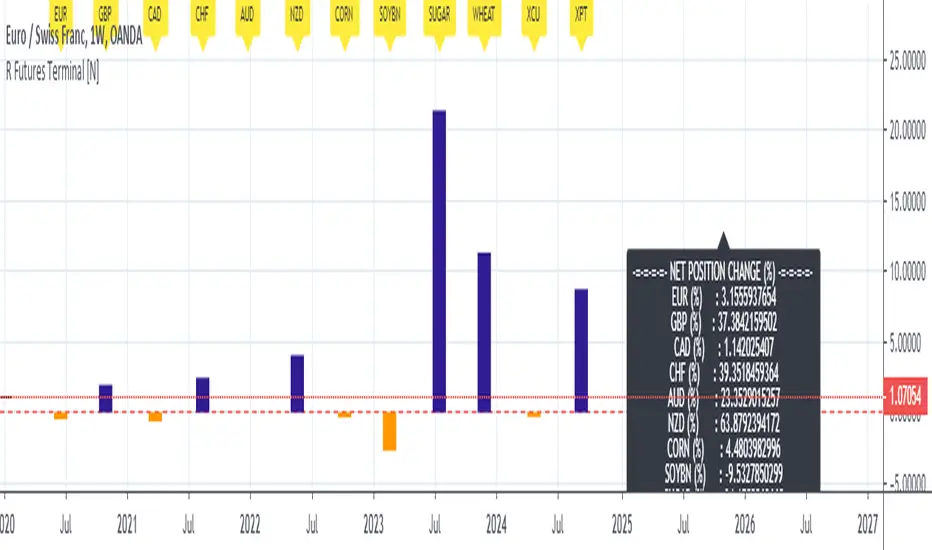
Live Mini Terminal 3 : Relative Forex & Futures Change DataThis script displays relative data changes occurring in the adjustable period and/or adaptive automatic period in the rest liquid futures.
It was inspired by the data terminals used by commercial traders.
Period selection can be set in the menu.
This script uses the adaptive period algorithm used by Autonomous LSTM and Relativity scripts.
Or you can set the period manually from the menu.
For more information about adaptive period:
This script works only for 1 day (1D) and 1 week (1W) time frames.
Since COT data is used, the most efficient time frame is 1 week (1W) .
Features
Value changes on a percentage basis (%)
Commitment of Traders position changes on a percentage basis :
Net position percentage is calculated as Short - Long and there is no inverse relationship.
Direct relationship is provided.
Due to the advantage of movement, future data were drawn instead of spot values on the required instruments.
The script provides the opportunity to comment on all major and minor Forex parities with liquid futures.
INSTRUMENTS
Euro Futures (EURUSD)
British Pound Futures (GBPUSD)
Canadian Dollar Futures (CADUSD)
Swiss Franc Futures (CHFUSD)
Australian Dollar Futures (AUDUSD)
New Zealand Dollar Futures (NZDUSD)
Corn Futures
Soybeans Futures
Sugar Futures
Wheat Futures
Copper Futures (XCU)
Platinum Futures (XPT)
Position Change InfoPanel
Position definition for the related instruments and data were taken and the calculations were made.
USAGE
The script can be used as an indicator by putting it under the chart as shown above.
It is necessary to enlarge to see clearly.
Since it is not often looked at, such use under chart is the best method for healthy interpretation.
Regards.
Syminfo.TypeHello traders
Earlier this week I discovered a new built-in variable called syminfo.type
What is it for?
This variable returns the type of the current symbol. Possible values are cfd, stock, futures, indices, forex, crypto, fund.
Cool bro but... should we care?
Well... we all should. Imagine you have a generic script and you want a different configuration whether you're trading FOREX or Crypto .
I designed a dummy example in that script that will preset the inputs according to the asset type from the chart.
Here I want 12/26/9 for forex and 20/50/50 for crypto - 30/60/90 otherwise
Quick caveat
It seems that for any crypto asset, syminfo.type returns "bitcoin". TradingView will fix it at some point but wanted to give you the heads-up regardless
Enjoy and all the BEST ^^
--
Dave

BITMEX Bybit binance Bitfinex OKCOIN BTC ETH TREND strategyBITMEX Bybit binance Bitfinex Coinbase OKCOIN BTC ETH TREND strategy
This is a very effective trend strategy.
Strategy principle
HOW TO USE
set long position when a green arrow appears in the chart.
set short position when a red arrow appears in the chart.
For the long position and the short direction, you can set the stop profit & stop loss or trailing profit stop & trailing stop loss respectively.
When a purple arrow appears to close a position, an aggressive trader can go in the opposite direction when it is purple.
Strategy applicability
The default setting is for bitmex perpetual swap contract XBTUSD , bybit BTCUSD perpetual futures contract ,binance btcusdt Spot,Bitfinex BTCUSD Spot,bitflyer BTCJPY Spot,bithumb BTCKRW Spot,bitso BTCMXN Spot, bitstamp BTCUSD Spot,bittrex BTCUSDT Spot,Coinbase BTCUSD spot, deribit BTCPERP perpetual futures contract,gemini BTCUSD Spot,Hitbit BTCUSDT Spot,huobi BTCUSDT Spot KRAKEN XBTUSD spot,OKCOIN OKEX BTCUSD3M BTCUSD BTCUSD2W,Poloniex BTCUSDT Spot etc btc symbol with 30 minutes timeframe.
This indicator has broad applicability and can be applied to multiple different symbols.
This indicator also applies to the ETHUSD symbol etc, just adjust the default configuration.
Using the alert of the indicator, it can work well on the trading robot like Gunbot,autoview, without repaint false signals.
这是非常有效的趋势策略。
如何使用
在图表中出现绿色箭头就做多。
在图表中出现红色箭头就做空。
对于多头头寸和空头方向,您可以分别设置止损和止损或尾随利润止损和尾随止损;当出现紫色箭头时平仓,激进的交易者,可以在紫色时就做反方向。
策略适用性
默认设置是针对bitmex交易所 XBTUSD永久掉期合约,BYBIT交易所 BTCUSD永续期货合约,binance币安交易所 btcusdt现货,Bitfinex交易所 BTCUSD现货,bitflyer交易所 BTCJPY现货,bithumb交易所 BTCKRW现货,bitso交易所 BTCMXN现货,bitstamp交易所 BTCUSD现货,bittrex交易所 BTCUSDT现货,Coinbase交易所 BTCUSD现货,deribit交易所 BTCPERP永续期货合约,gemini双子星交易所 BTCUSD现货,Hitbit交易所 BTCUSDT现货,huobi火币交易所 BTCUSDT现货,KRAKEN交易所 XBTUSD现货,OKCOIN OKEX交易所 BTCUSD3M OK BTC季度合约 BTCUSD BTCUSD2W OK BTC次周合约,Poloniex BTCUSDT现货等2小时区间的btc交易。
Bitmex XBTUSD 30分钟 比特币期货 30 minutes Bitcoin Futures
Bitfinex BTCUSD 30分钟 比特币现货 30 minutes Bitcoin Spot
Bybit BTCUSD 30分钟 比特币合约 30 minutes Bitcoin Futures
OKEX BTCUSD2M 30分钟 比特币次周合约 30 minutes Half a month Bitcoin Futures
Bitmex XBTUSD 2H 比特币现货 2 hours Bitcoin Futures
binance BTCUSDT 2H 比特币现货 2 hours Bitcoin Spot
Bybit BTCUSD 2H 比特币期货 2 hours Bitcoin Futures
这个指标具有广泛的适用性,可以适用多个不同交易品种。
该指标还适用于ETHUSD交易品种等,只需调整默认配置即可。
Bitmex ETHUSD 30 以太币合约
Bybit ETHUSD 30分钟合约
OKCOIN ETHUSD3W 30分钟季度合约
Bitmex ETHUSD 2H 以太币合约
Bybit ETHUSD 2H 以太币合约
HUOBI ETHUSD 2H 火币以太币现货
使用该指标的警报设置,它可以在自动交易机器人上很好地工作,而无重绘错误的信号。

NCTA Trend BiasTrend Bias
The NCTA Trend Bias indicator is designed to show traders the overall directional bias of the market. It is excellent in short 1, 3, and 5 minute timeframes for futures traders and short term options traders. Longer timeframes such as the 5, 10, and 30 minute timeframes work well for options traders.
This indicator is used by displaying it twice on the chart. For 1, 3, and 5 minute charts, one of the Trend Bias indicators is set at Fast and the other is set at Medium.
For 30 min or higher charts, one Trend Bias Indicator is set at Medium and the other one is set at Slow.
The indicator consists of three trend lines; a fast signal, a medium signal, and a slow signal. There is a possible trade entry when the fast signal crosses either the medium and/or slow signals.
HOW TO USE: The most effective way to use this indicator is to have it displayed twice, using the settings described above for the relevant chart timeframe.
When both indicators show the fast line (blue line) crossing above the medium (red) or the slow (green) line, it implies an opportunity to go long or buy a call. When both indicators show the fast line crossing below the medium and/or slow line, it implies an opportunity to go short or buy a put.
The Trend Bias Indicator also provides a powerful directional bias entry when used in alignment with the Awesome Oscillator. Green AO aligned with a long Trend Bias entry or red AO aligned with a short Trend Bias entry.
For information on gaining access to this indicator, please see the link below in our signature field.
RTYZ2019
NASDAQ:AMZN

ANN Forecast MACD [Noldo] In this script, I tried to convert ANN MACD to MACD Forecast.
It took me quite a while, but it was fun.
After selecting the ticker, select the instrument from the menu and the system will automatically turn on the appropriate Forecast MACD system.
The system is trained with ANN values of ANN MACD 25 in 1.
But because the system is overloaded, only the most popular instruments are left.
The others were unfortunately eliminated.
The only difference is that it was built on the forecast algorithm of my own creation.
The Forecast algorithm is not open-source.
The codes are a nice framework for some of my most valuable systems about ANN . (Working on them. )
But I'm never remove this script.
You can use it forever for free.
As you can see in the presentation, although it is in the same period, it is more accurate and agile than normal MACD.
I think even a bar is important in trade.
For those who don't see that command,listed instruments with alternative tickers and error rates:
WTI : West Texas Intermediate (WTICOUSD , USOIL , CL1! ) Average error : 0.007593
BRENT : Brent Crude Oil ( BCOUSD , UKOIL , BB1! ) Average error : 0.006591
GOLD : XAUUSD , GOLD , GC1! Average error : 0.012767
SP500 : S&P 500 Index ( SPX500USD , SP1! ) Average error : 0.011650
EURUSD : Eurodollar ( EURUSD , 6E1! , FCEU1!) Average error : 0.005500
ETHUSD : Ethereum ( ETHUSD , ETHUSDT ) Average error : 0.009378
BTCUSD : Bitcoin ( BTCUSD , BTCUSDT , XBTUSD , BTC1! ) Average error : 0.01050
GBPUSD : British Pound ( GBPUSD , 6B1! , GBP1!) Average error : 0.009999
USDJPY : US Dollar / Japanese Yen ( USDJPY , FCUY1!) Average error : 0.009198
USDCHF : US Dollar / Swiss Franc ( USDCHF , FCUF1! ) Average error : 0.009999
USDCAD : Us Dollar / Canadian Dollar ( USDCAD ) Average error : 0.012162
SOYBNUSD : Soybean ( SOYBNUSD , ZS1! ) Average error : 0.010000
CORNUSD : Corn ( ZC1! ) Average error : 0.007574
NATGASUSD : Natural Gas ( NATGASUSD , NG1! ) Average error : 0.010000
SUGARUSD : Sugar ( SUGARUSD , SB1! ) Average error : 0.011081
WHEATUSD : Wheat ( WHEATUSD , ZW1! ) Average error : 0.009980
XPTUSD : Platinum ( XPTUSD , PL1! ) Average error : 0.009964
XU030 : Borsa Istanbul 30 Futures ( XU030 , XU030D1! ) Average error : 0.010727
VIX : S & P 500 Volatility Index (VX1! , VIX ) Average error : 0.009999
ES : S&P 500 E-Mini Futures ( ES1! ) Average error : 0.010709
SSE : Shangai Stock Exchange Composite (Index ) ( 000001 ) Average error : 0.011287
XRPUSD : Ripple (XRPUSD , XRPUSDT ) Average error : 0.009803
Extras :
- Crossover and crossunder alerts
- Switchable barcolor
NOTE :
Australian Dollar / US Dollar (AUDUSD ) removed due to high average error. (Average error > 0.013 )
Timeframe advice :
I suggest you to use that system TF >= 1D
My favorite is 1 week bars. (1W)
Info about forecast series :
www.sciencedirect.com
Special thanks :
Special thanks to dear wroclai for his great effort .

Market Profile for Futures with Session and After Hours SplitAdapted existing Market Profile scripts to be move suitable for Futures Markets with Session and After Hours split
Script Provides split Market Profiles for Session and After Hours
Users can customize the Session and AH hours inputs to suit any ticker and their interpretation of prime and non-prime hours

ANN MACD : 25 IN 1 SCRIPTIn this script, I tried to fit deep learning series to 1 command system up to the maximum point.
After selecting the ticker, select the instrument from the menu and the system will automatically turn on the appropriate ann system.
Listed instruments with alternative tickers and error rates:
WTI : West Texas Intermediate (WTICOUSD , USOIL , CL1! ) Average error : 0.007593
BRENT : Brent Crude Oil (BCOUSD , UKOIL , BB1! ) Average error : 0.006591
GOLD : XAUUSD , GOLD , GC1! Average error : 0.012767
SP500 : S&P 500 Index (SPX500USD , SP1!) Average error : 0.011650
EURUSD : Eurodollar (EURUSD , 6E1! , FCEU1!) Average error : 0.005500
ETHUSD : Ethereum (ETHUSD , ETHUSDT ) Average error : 0.009378
BTCUSD : Bitcoin (BTCUSD , BTCUSDT , XBTUSD , BTC1!) Average error : 0.01050
GBPUSD : British Pound (GBPUSD,6B1! , GBP1!) Average error : 0.009999
USDJPY : US Dollar / Japanese Yen (USDJPY , FCUY1!) Average error : 0.009198
USDCHF : US Dollar / Swiss Franc (USDCHF , FCUF1! ) Average error : 0.009999
USDCAD : Us Dollar / Canadian Dollar (USDCAD) Average error : 0.012162
SOYBNUSD : Soybean (SOYBNUSD , ZS1!) Average error : 0.010000
CORNUSD : Corn (ZC1! ) Average error : 0.007574
NATGASUSD : Natural Gas (NATGASUSD , NG1!) Average error : 0.010000
SUGARUSD : Sugar (SUGARUSD , SB1! ) Average error : 0.011081
WHEATUSD : Wheat (WHEATUSD , ZW1!) Average error : 0.009980
XPTUSD : Platinum (XPTUSD , PL1! ) Average error : 0.009964
XU030 : Borsa Istanbul 30 Futures ( XU030 , XU030D1! ) Average error : 0.010727
VIX : S & P 500 Volatility Index (VX1! , VIX ) Average error : 0.009999
YM : E - Mini Dow Futures (YM1! ) Average error : 0.010819
ES : S&P 500 E-Mini Futures (ES1! ) Average error : 0.010709
GAZP : Gazprom Futures (GAZP , GZ1! ) Average error : 0.008442
SSE : Shangai Stock Exchange Composite (Index ) ( 000001 ) Average error : 0.011287
XRPUSD : Ripple (XRPUSD , XRPUSDT ) Average error : 0.009803
Note 1 : Australian Dollar (AUDUSD , AUD1! , FCAU1! ) : Instrument has been removed because it has an average error rate of over 0.13.
The average error rate is 0.1850.
I didn't delete it from the menu just because there was so much request,
You can use.
Note 2 : Friends have too many requests, it took me a week in total and 1 other script that I'll share in 2 days.
Reaching these error rates is a very difficult task, and when I keep at a low learning rate, they are trained for a very long time.
If I don't see the error rate at an average low, I increase the layers and go back into a longer process.
It takes me 45 minutes per instrument to command artificial neural networks, so I'll release one more open source, and then we'll be laying 70-80 percent of the world trade volume with artificial neural networks.
Note 3 :
I would like to thank wroclai for helping me with this script.
This script is subject to MIT License on behalf of both of us.
You can review my original idea scripts from my Github page.
You can use it free but if you are going to modify it, just quote this script .
I hope it will help everyone, after 1-2 days I will share another ann script that I think is of the same importance as this, stay tuned.
Regards , Noldo .

Bitmex BTC Backwardation / ContangoThis indicator calculates difference between price of Bitmex's XBTUSD, and Bitmex's two nearest futures.
If the difference is negative, then it is backwardation.
If the difference is positive, then it is contango.
This script will be updated every about 3 months, when the nearest Bitmex future will be expired.
This is an updated script of , with better description.

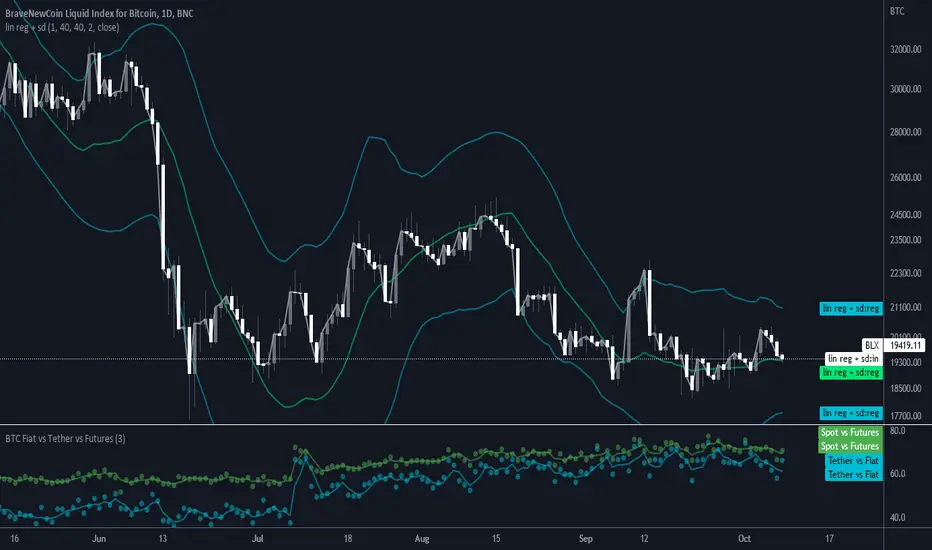
BTC Volume absolute (fiat vs Tether vs futures)BTC volume split by fiat, Tether and futures in USD
fiat = COINBASE + BITFLYER + BITSTAMP + KRAKEN
Tether = BITFINEX + BINANCE + HUOBI + HITBTC
futures = BITMEX + BYBIT

COT Commercial Positions (Updated)
This script aims to look at the markets from a manufacturer's point of view.
Producers or large enterprises gradually sell their goods as the price increases.
Because both the amount of product and position in their hands is too high, otherwise they can not find buyers, and they have to make a safe profit.
Therefore, I have shown short positions in green and long positions in red.
Blue is the net position formed by subtracting long positions from short positions.
This script is created with the latest Quandl data number codes.
Please let me know if you see a missing or a code update.
I recommend using it in a weekly (1W) time frame.
CAUTION : Since Bitcoin producer positions are very sparse, speculative long positions have been preferred in Bitcoin.
If you're looking for Bitcoin,
select Bitcoin from the menu.
Regards.

Open Interest Exponential Ease of MovementModified Ease of Movement :
* Open Interests used on Futures instead of Volume (Includes Bitcoin)
* Exponential Moving Average used instead of Simple Moving Average
* Division Number cancelled. (Division Number gives wrong signals inside strong trends.)
NOTE : This code is open source under the MIT License. If you have any improvements or corrections to suggest, please send me a pull request via the github repository github.com
Stay tuned. Best regards !
BTC Volume Fiat vs Tether vs FuturesFutures = BYBIT+ BITMEX
Fiat = KRAKEN + BITSTAMP + BITFLYER + COINBASE
Tether = HITBTC + HUOBI + BINANCE + BITFINEX
Spot = Fiat + Tether
Tether vs Fiat = 100 * Tether / (Tether + Fiat)
Spot vs Futures = 100 * Spot / (Spot + Futures)
Open Interest Money Flow Index (OIMFI)CAUTION : This system was inspired from seiglerj' s "Money Flow Index " script. Open Interests are used instead of volume.
What is the Money Flow Index ( MFI )?
The Money Flow Index ( MFI ) is a technical oscillator that uses price and volume for identifying overbought or oversold conditions in an asset. It can also be used to spot divergences which warn of a trend change in price. The oscillator moves between 0 and 100.
Unlike conventional oscillators such as the Relative Strength Index ( RSI ), the Money Flow Index incorporates both price and volume data, as opposed to just price. For this reason, some analysts call MFI the volume-weighted RSI .
What Does the Money Flow Index ( MFI ) Tell You?
One of the primary ways to use the Money Flow Index is when there is a divergence. A divergence is when the oscillator is moving in the opposite direction of price. This is a signal of a potential reversal in the prevailing price trend.
For example, a very high Money Flow Index that begins to fall below a reading of 80 while the underlying security continues to climb is a price reversal signal to the downside. Conversely, a very low MFI reading that climbs above a reading of 20 while the underlying security continues to sell off is a price reversal signal to the upside.
Traders also watch for larger divergences using multiple waves in the price and MFI . For example, a stock peaks at $10, pulls back to $8, and then rallies to $12. The price has made two successive highs, at $10 and $12. If MFI makes a lower higher when the price reaches $12, the indicator is not confirming the new high. This could foreshadow a decline in price.
The overbought and oversold levels are also used to signal possible trading opportunities. Moves below 10 and above 90 are rare. Traders watch for the MFI to move back above 10 to signal a long trade, and to drop below 90 to signal a short trade.
Other moves out of overbought or oversold territory can also be useful. For example, when an asset is in an uptrend, a drop below 20 (or even 30) and then a rally back above it could indicate a pullback is over and the price uptrend is resuming. The same goes for a downtrend. A short-term rally could push the MFI up to 70 or 80, but when it drops back below that could be the time to enter a short trade in preparation for another drop .
Reference : www.investopedia.com
WARNING :
** Since each instrument in the list has its own unique contract data, you must first enter its name to display it. I recommend you to select OANDA from the markets. Finally, when the COT reports are issued, it may repaints. However, this repaint is usually close to closing or after close .(When COT reports are so sharp ) So use this script only 1W ( 1 week ) or 1 M ( 1 month ) timeframe.
** This data is taken to Tradingview with the help of Quandl. This is a very low possibility, but the system will not work if there is a malfunction.
FEATURES :
*** Working with all futures (Including : Bitcoin )
*** If you dont work with "Futures" , you can select "Others" from switchable menu and use volume for all instruments.
*** New generation elegant design used : Adaptive coloring Overbought - Oversold Levels according to the closing price.
NOTE : This code is open source under the MIT License. If you have any improvements or corrections to suggest, please send me a pull request via the github repository github.com
Stay tuned. Best wishes !

NCTA Cycle FinderCycle Finder
The NCTA Cycle Finder is one of three technical indicators that are part of the Profit Flow Analytics.
New Cycle Trading and Analytics is a group of traders creating market analytics for traders. The objective is to take complex combinations of multiple technical pattern indicators and present to the trader a simple, single entry signal.
The NCTA Cycle Finder is designed to identify the beginning of new, trending cycles. It is excellent in short 1, 3, and 5 minute timeframes for futures traders and short term options traders. Longer timeframes such as the 5, 10, and 30 minute timeframes work well for options traders.
This indicator consists of a simple, single entry indicator designed to provide an entry very close to the shift on the intra-day cycle. It provides a warning that a cycle shift may be coming by printing a grey bar. Bars above the zero line imply a possible new long cycle developing. Grey bars below the zero line imply a possible new short cycle is developing.
Once the indicator has confirmed a new cycle is developing, a dark blue or red bar will print. Dark blue above the zero line is the trader’s signal to go long. A dark red signal below the zero line is the traders signal to go short. The indicator is designed to filter out false signals and provide the trader with an optimum timing of capturing an entry/exit very close to the beginning / ending of a cycle.
Using the NCTA Cycle Finder, the Profit Flow Oscillator, and Trend Consensus indicators together, offers traders an opportunity to lock in profits and enter the same trending cycle more than one time. This is an excellent opportunity to open trend continuation trades. The NCTA Cycle Finder is excellent when used across more than one timeframe to confirm alignment. For example, monitoring the 5 minute signals and confirming alignment with the 1 minute chart improves the probability of entering a profitable trade.
HOW TO USE: Use the grey bar prints to be ready for a signal and the possible direction. Go long when a blue bar appears and go short when a red bar appears. The print of these signals very closely identify the beginning of a new cycle
The NCTA Cycle Finder, which is part of the Profit Flow Analytics set of indicators, is traded in a live trading room every market day, hosted by our friends at Options Money Maker.
To learn more about the NCTA Cycle Finder and the other two indicators, which are part of Profit Flow Analytics, use the following link:
www.newcycletrading.com
NQZ2019
SP:SPX

Weiss Wave Open Interest BarsFirstly :
LazyBear ' s "Weiss Wave " codes are used for open interests.
Original Weiss Wave Volume :
Let's start :
Open Interest vs. Volume: An Overview
Volume and open interest are two key measurements that describe the liquidity and activity of contracts In the options and futures markets. However, their meanings and applications are different. Volume refers to the number of contracts traded in a given period, while open interest denotes the number of active contracts.
Volume
Trading volume measures the number of options or futures contracts being exchanged between buyers and sellers, identifying the level of activity for that particular contract. For every buyer, there is a seller, and the transaction itself counts toward the daily volume.
Open Interest
Open interest indicates the number of options or futures contracts that are held by traders and investors in active positions. These positions have not been closed out, expired, or exercised. Open interest decreases when holders and writers of options (or buyers and sellers of futures) close out their positions. To close out positions, they must take offsetting positions or exercise their options. Open interest increases once again when investors and traders open new long positions or writers/sellers take on new short positions. Open interest also increases when new options or futures contracts are created.
Options or futures contract trading volume can only increase while open interest can either increase or decrease. While trading volume indicates the number of contracts that have been bought or sold, open interest identifies the number of contracts that are currently held.
Reference : www.investopedia.com
*** Worked to define all futures . You can look them in codes (between line : 13 to line 94 )
** CAUTION 1 : Since each instrument in the list has its own unique contract data, you must first enter its name to display it. I recommend you to select OANDA from the markets. Finally, when the COT reports are issued, it may repaints. However, this repaint is usually close to closing or after close .(When COT reports are so sharp ) So use this script only 1W ( 1 week ) or 1 M ( 1 month ) timeframe.
** CAUTION 2 : This data is taken to Tradingview with the help of Quandl. This is a tremendous possibility, but the system will not work if there is a malfunction.
Best regards.
