Cumulative Intraday Volume with Long/Short LabelsThis indicator calculates a running total of volume for each trading day, then shows on the price chart when that total crosses levels you choose. Every day at 6:00 PM Eastern Time, the total goes back to zero so it always reflects only the current day’s activity. From that moment on, each time a new candle appears the indicator looks at whether the candle closed higher than it opened or lower. If it closed higher, the candle’s volume is added to the running total; if it closed lower, the same volume amount is subtracted. As a result, the total becomes positive when buyers have dominated so far today and negative when sellers have dominated.
Because futures markets close at 6 PM ET, the running total resets exactly then, mirroring the way most intraday traders think in terms of a single session. Throughout the day, you will see this running total move up or down according to whether more volume is happening on green or red candles. Once the total goes above a number you specify (for example, one hundred thousand contracts), the indicator will place a small “Long” label at that candle on the main price chart to let you know buying pressure has reached that level. Similarly, once the total goes below a negative number you choose (for example, minus one hundred thousand), a “Short” label will appear at that candle to signal that selling pressure has reached your chosen threshold. You can set these threshold numbers to whatever makes sense for your trading style or the market you follow.
Because raw volume alone never turns negative, this design uses candle direction as a sign. Green candles (where the close is higher than the open) add volume, and red candles (where the close is lower than the open) subtract volume. Summing those signed volume values tells you in a single number whether buying or selling has been stronger so far today. That number resets every evening, so it does not carry over any buying or selling from previous sessions.
Once you have this indicator on your chart, you simply watch the “summed volume” line as it moves throughout the day. If it climbs past your long threshold, you know buyers are firmly in control and a long entry might make sense. If it falls past your short threshold, you know sellers are firmly in control and a short entry might make sense. In quieter markets or times of low volume, you might use a smaller threshold so that even modest buying or selling pressure will trigger a label. During very active periods, a larger threshold will prevent too many signals when volume spikes frequently.
This approach is straightforward but can be surprisingly powerful. It does not rely on complex formulas or hidden statistical measures. Instead, it simply adds and subtracts daily volume based on candle color, then alerts you when that total reaches levels you care about. Over several years of historical testing, this formula has shown an ability to highlight moments when intraday sentiment shifts decisively from buyers to sellers or vice versa. Because the indicator resets every day at 6 PM, it always reflects only today’s sentiment and remains easy to interpret without carrying over past data. You can use it on any intraday timeframe, but it works especially well on five-minute or fifteen-minute charts for futures contracts.
If you want a clear gauge of whether buyers or sellers are dominating in real time, and you prefer a rule-based method rather than a complex model, this indicator gives you exactly that. It shows net buying or selling pressure at a glance, resets each session like most intraday traders do, and marks the moments when that pressure crosses the levels you decide are important. By combining a daily reset with signed volume, you get a single number that tells you precisely what the crowd is doing at any given moment, without any of the guesswork or hidden calculations that more complicated indicators often carry.
Futurestrading

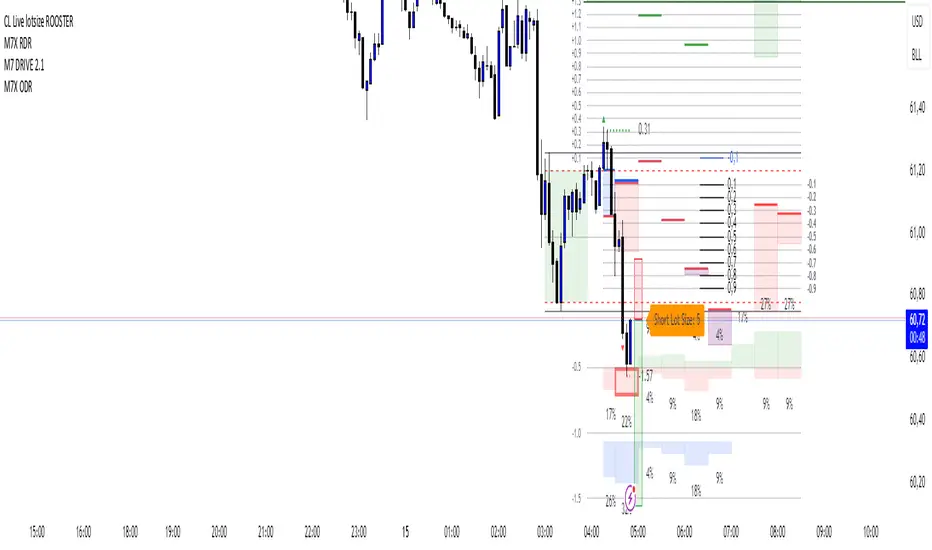
CL Live lotsize ROOSTER📄 Description:
This is a utility script designed for manual futures traders who enter with market orders and want to size their positions precisely based on $ risk.
⚙️ Features:
✅ Calculates live contract size based on:
A fixed dollar risk amount (e.g. $100)
A manually set static stop-loss price
The live market price as your entry
✅ Uses a configurable risk-reward ratio (e.g. 1:3)
✅ Plots entry, stop, and target levels on the chart
✅ Displays calculated contract size as a floating label
🎯 Why this tool?
Built to support fast execution workflows , this tool helps traders who:
Enter trades at candle close or open
Want to pre-calculate their market order size before the signal
Prefer a visual, consistent, real-time R:R validation system
Avoid fumbling with the long/short position tool at the last second
🔧 Settings:
Static Stop-Loss Price: Enter the price level where you'd place your SL
Account Risk ($): How much you’re willing to risk per trade
Risk-Reward Ratio: Set your target multiplier (e.g. 3 for 3R)
True Seasonal Pattern [tradeviZion]True Seasonal Pattern: Uncover Hidden Market Cycles
Markets have rhythms and patterns that repeat with surprising regularity. The True Seasonal Pattern indicator reveals these hidden cycles across different timeframes, helping you anticipate potential market movements based on historical seasonal tendencies.
What This Indicator Does
The True Seasonal Pattern analyzes years of historical price data to identify recurring seasonal trends. It then plots these patterns on your chart, showing you both the historical pattern and future projection based on past seasonal behavior.
Automatic Timeframe Detection: Works with Monthly, Weekly, and Daily charts
Historical Pattern Analysis: Analyzes up to 100 years of data (customizable)
Future Projection: Projects the seasonal pattern ahead on your chart
Smart Smoothing: Applies appropriate smoothing based on your timeframe
How to Use This Indicator
Add the indicator to a Daily, Weekly, or Monthly chart (not designed for intraday timeframes)
The indicator automatically detects your chart's timeframe
The blue line shows the historical seasonal pattern
Watch for potential turning points in the pattern that align with other technical signals
Seasonal patterns work best as a supporting factor in your analysis, not as standalone trading signals. They are particularly effective in markets with well-established seasonal influences.
Best Applications
Futures Markets: Commodities and futures often show strong seasonal tendencies due to production cycles, weather patterns, and economic factors
Stock Indices: Many stock markets demonstrate regular seasonal patterns (like the "Sell in May" phenomenon)
Individual Stocks: Companies with seasonal business cycles often show predictable price patterns
Practical Applications
Identify potential turning points based on historical seasonal patterns
Plan entries and exits around seasonal tendencies
Add seasonal context to your existing technical analysis
Understand why certain months or periods might show consistent behavior
Pro Tip: For best results, use this tool on instruments with at least 5+ years of historical data. Longer timeframes often reveal more reliable seasonal patterns.
Important Notes
This indicator works best on Daily, Weekly, and Monthly timeframes - not intraday charts
Seasonal patterns are tendencies, not guarantees
Always combine seasonal analysis with other technical tools
Past patterns may not repeat exactly in the future
// Sample of the seasonal calculation approach
float yearHigh = array.max(currentYearHighs)
float yearLow = array.min(currentYearLows)
// Calculate seasonality for each period
for i = 0 to array.size(currentYearCloses) - 1
float periodClose = array.get(currentYearCloses, i)
if not na(periodClose) and yearHigh != yearLow
float seasonality = (periodClose - yearLow) / (yearHigh - yearLow) * 100
I developed this indicator to help traders incorporate seasonal analysis into their trading approach without the complexity of traditional seasonal tools. Whether you're analyzing agricultural commodities, energy futures, or stock indices, understanding the seasonal context can provide valuable insights for your trading decisions.
Remember: Markets don't always follow seasonal patterns, but when they do, being aware of these tendencies can give you a meaningful edge in your analysis.

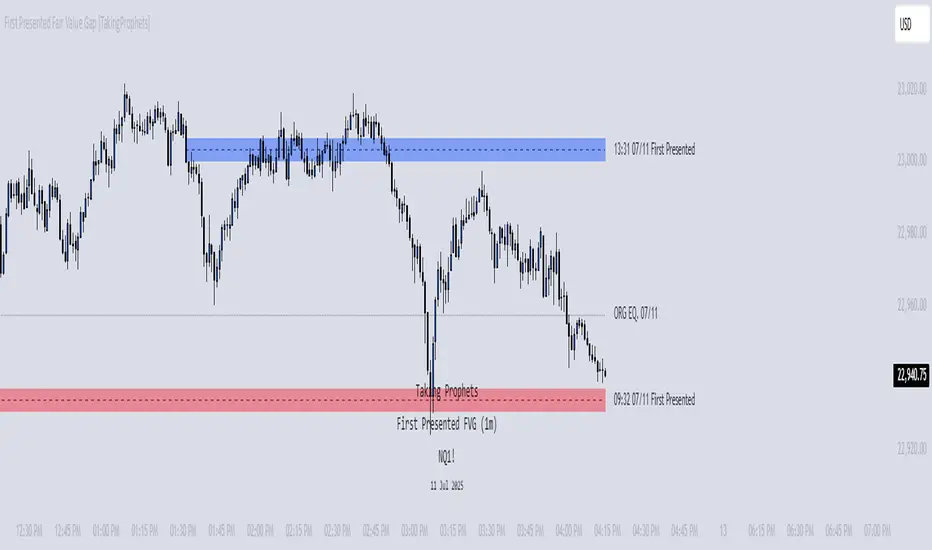
First Presented Fair Value Gap [TakingProphets]🧠 Indicator Purpose:
The "First Presented Fair Value Gap" (FPFVG) by Taking Prophets is a precision tool designed for traders utilizing Inner Circle Trader (ICT) concepts. It automatically detects and highlights the first valid Fair Value Gap (FVG) that forms between 9:30 AM and 10:00 AM New York time — one of the most critical windows in ICT-based trading frameworks.
It also plots the Opening Range Equilibrium (the average of the previous day's 4:14 PM close and today's 9:30 AM open) — a key ICT reference point for premium/discount analysis.
🌟 What Makes This Indicator Unique:
This script is highly specialized for early session trading and offers:
Automatic Detection: Finds the first Fair Value Gap after the 9:30 AM NYSE open.
Clear Visualization: Highlights the FVG zone and labels it with optional time stamps.
Equilibrium Line: Plots the Opening Range Equilibrium for instant premium/discount context.
Time-Sensitive Logic: Limits detection to the most volatile early session (9:30 AM - 10:00 AM).
Extension Options: You can extend both the FVG box and Equilibrium line out to 3:45 PM (end of major session liquidity).
⚙️ How the Indicator Works (Detailed):
Pre-Market Setup:
Captures the previous day's 4:14 PM close.
Captures today's 9:30 AM open.
Calculates the Equilibrium (midpoint between the two).
After 9:30 AM (New York Time):
Monitors each 1-minute candle for the creation of a Fair Value Gap:
Bullish FVG: Low of the current candle is above the high two candles ago.
Bearish FVG: High of the current candle is below the low two candles ago.
The first valid gap is boxed and optionally labeled.
Post-Detection Management:
The FVG box and label extend forward in time until 3:45 PM (or the current time, based on settings).
If enabled, the Equilibrium line and label also extend to help with premium/discount analysis.
🎯 How to Use It:
Step 1: Wait for market open (9:30 AM New York time).
Step 2: Watch for the first presented FVG on the 1-minute chart.
Step 3: Use the FPFVG zone to guide entries (retracements, rejections, or breaks).
Step 4: Use the Opening Range Equilibrium to determine premium vs. discount conditions:
Price above Equilibrium = Premium market.
Price below Equilibrium = Discount market.
Best Application:
In combination with ICT Killzones, especially during the London or New York Open.
When framing intraday bias and identifying optimal trade locations based on liquidity theory.
🔎 Underlying Concepts:
Fair Value Gaps: Price imbalances where liquidity is likely inefficient and future rebalancing can occur.
Opening Range Equilibrium: Key ICT price anchor used to separate premium and discount conditions post-open.
Time-Gated Setup: Limits focus to early session price action, aligning with inner circle trader timing models.
🎨 Customization Options:
FVG color, label visibility, and label size.
Opening Range Equilibrium line visibility and label styling.
Extend lines and boxes to 3:45 PM automatically for full session tracking.
✅ Recommended for:
Traders applying Inner Circle Trader (ICT) models.
Intraday scalpers or day traders trading the New York session open.
Traders who want to frame early session bias and liquidity traps effectively.
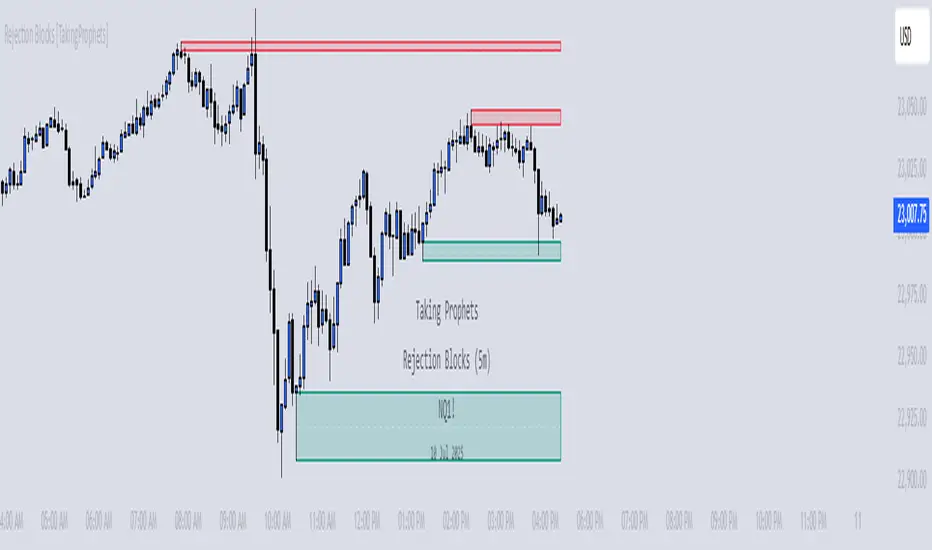
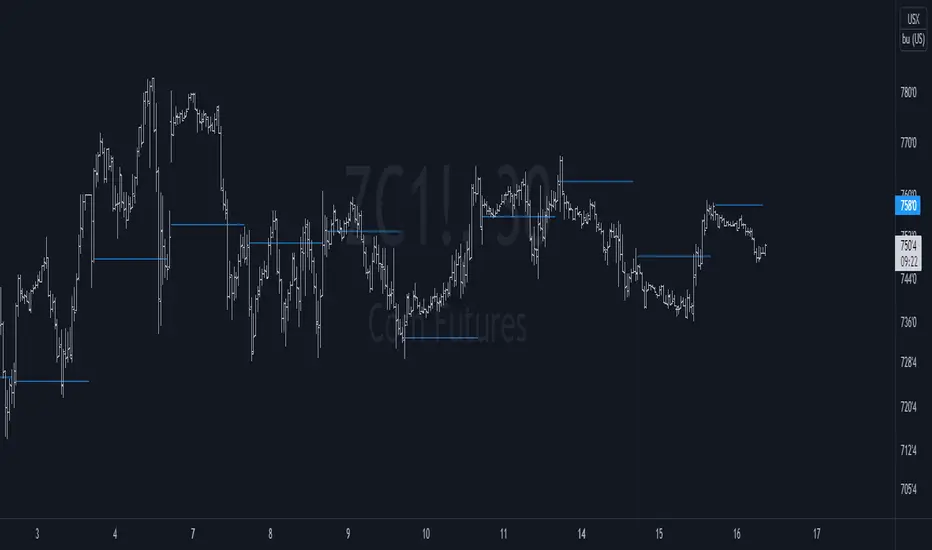
Rejection Blocks [Taking Prophets]🧠 Indicator Purpose:
The "Rejection Blocks" indicator is built for traders using Inner Circle Trader (ICT) concepts. It identifies key reversal zones where price action shows strong rejection through wick-dominant behavior around major swing points — often signaling institutional activity. Traders can use these rejection blocks to anticipate future support, resistance, and mitigation zones based on ICT principles.
🌟 What Makes This Indicator Unique:
Unlike standard support/resistance indicators, this script detects true rejection points by filtering only candles where the wick is significantly larger than the body, confirming potential order flow shifts according to ICT methodology.
It not only marks these zones but also:
Dynamically extends the blocks into the future.
Deletes blocks that get invalidated (mitigation logic).
Optionally plots a 50% midline within each block to refine entry or exit precision.
⚙️ How the Indicator Works:
Swing Detection: Identifies significant highs and lows based on pivot structures.
Rejection Filtering: Confirms strong rejections with wick-to-body ratio validation.
Block Creation: Highlights bullish or bearish rejection zones with customizable visuals.
Midline Plotting: (Optional) Marks the 50% midpoint of the block for entry targeting.
Mitigation and Cleanup: Blocks are deleted automatically when their structure is invalidated, maintaining a clean and accurate chart view.
🎯 How to Use It:
Identify Reaction Zones: Use rejection blocks as potential areas for price reversals or consolidations.
Plan Trade Entries: Monitor retests of the block boundaries or 50% lines for precision entries.
Manage Risk: If price closes beyond the block, treat it as a potential invalidation or Change in State of Delivery (CISD) event.
Best Contexts:
Near higher timeframe Points of Interest (POIs) such as Order Blocks or Fair Value Gaps.
During ICT Killzones (London Open, New York AM).
🔎 Underlying Concepts:
Wick Rejections: Indicate strong liquidity rejection, aligning with ICT liquidity sweep theories.
Mitigation Behavior: Blocks often serve as revisit zones where price rebalances after an aggressive move.
Adaptive Market Behavior: Rejection Blocks adjust dynamically based on real-time price action according to ICT market structure logic.
🎨 Customization Options:
Bullish and Bearish block colors with adjustable opacity.
Border visibility, border width, and 50% midline display toggles.
Label size customization for optimal chart clarity.
✅ Recommended for:
Traders following Inner Circle Trader (ICT) concepts.
Scalpers, intraday, and swing traders seeking accurate reversal and mitigation zones.
Traders looking to improve precision around liquidity rejection events.
Prop Firm Guard: Risk & Sizing Tracker by TFTProp Firm Guard: Risk & Sizing Tracker by TFT
Overview:
This script is designed to help prop firm traders stay within risk rules and avoid emotional overtrading. It tracks your max loss limits, daily loss rules, and gives real-time position sizing suggestions based on your account status.
This tool is especially helpful for newer traders navigating prop firm challenges and rules like trailing drawdowns and daily stopouts.
Key Features:
✅ Real-time tracking of max loss and daily loss limits
✅ Supports both Intraday and End-of-Day (EOD) drawdown styles
✅ Calculates remaining “distance” to max/daily loss levels
✅ Automatically locks max loss once it trails up to starting balance
✅ Provides smart, tier-based position sizing suggestions (5%–50%)
✅ Shows profit target progress and live daily P&L
Use Case Example:
Let’s say you’re trading a $50,000 prop account with a $2,000 max drawdown limit.
If you're using Intraday Drawdown:
• You start the day at $50,000.
• During the day, your balance grows to $51,000 (including unrealized profits).
• The drawdown logic will trail this intraday high — so your new max loss limit becomes $49,000 (51K - 2K).
• If your balance drops to $49,400, this tool will show you’re $400 away from breaching the limit.
• Sizing suggestions will adjust accordingly to keep you in a safe range.
If you're using End-of-Day (EOD) Drawdown:
• The same scenario (account grows to $51,000 intraday) won’t affect your max loss limit immediately.
• EOD drawdown is only updated based on your end-of-day closing balance.
• So even if you hit $51K intraday, your max loss limit still remains at $48,000 (50K - 2K) until the trading day closes and updates your best equity.
• This mode offers more flexibility during the day — and the tool reflects this in how it calculates distances and sizing.
📌 It will then suggest a conservative sizing range — maybe 5–10% of your allowed contract size — until you're safer again.
📌 Make sure you update your current balance after each trade and follow your risk settings.
Inputs Explained (with Tips):
• Overall Account Starting Balance: Your full prop account size (e.g., 50000 or 100000, 150000, 300000, so on)
• Day Start Balance: What your balance was when the trading day started
• Daily Max Loss: How much you’re allowed to lose in one day (used only for EOD drawdown)
• Daily Profit Target: Your goal for the day (e.g., 500 or 1000 or so on)
• Allowed Overall Drawdown: Usually 4% for prop firms — like 2000 on 50K, or 6000 on 300K
• Drawdown Mode:
→ Intraday: Includes floating/unrealized profits in drawdown logic
→ EOD: Uses only end-of-day equity for drawdown logic
• Best Day High: Your highest balance to date. If not above your starting balance, this is ignored
• Intraday High (Manual): Optional override if your peak balance isn’t same as equity (used only for intraday drawdown mode)
• Current Equity: Update this during the session to reflect your live balance — everything else updates automatically
What You’ll See on the Chart:
🟩 Equity Section: Start balance, current balance, intraday high, best day high
🟥 Risk Section:
• Max loss limit (based on trailing logic)
• Distance from current balance to that limit
• Daily loss limit and distance (EOD mode only)
🟦 Performance Metrics:
• Daily P&L in $ and %
• Progress to profit target (shows ✅ Accomplished when goal is hit)
📦 Sizing Suggestion:
Based on how close you are to a drawdown breach, and your total drawdown tier.
Ranges from ⚠️ 5–10% to ✅ 40–50% of your max allowed contract size.
Who It's Best For:
• Built and optimized for 50K prop firm accounts
• Works well with 100K, 150K, or even 300K — but the sizing logic is most precise at 50K
• Best suited for futures or forex prop firm traders using account challenge-style rules
Manual Input Required:
Due to TradingView limitations, we cannot read your actual trades or live balance.
You'll need to update the Current Equity field yourself — but the rest is auto-calculated from there.
Most inputs (like overall balance and drawdown) are set once and rarely changed.
Beta Notice:
This tool is currently in beta and under testing. It's free for now and designed to help the trading community — but accuracy may vary.
Please send feedback if you'd like to suggest improvements or report bugs.
Disclaimer:
This tool is for educational purposes only and does not provide trading advice or signal any trades.
Always trade according to your firm’s rules. The author is not responsible for losses resulting from use of this script.

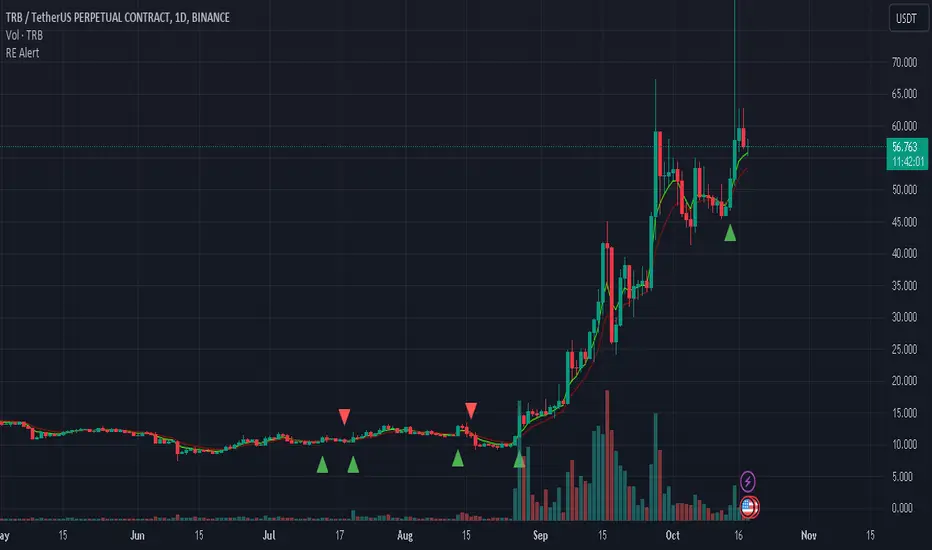
MACD & Bollinger Bands Overbought OversoldMACD & Bollinger Bands Reversal Detector
This indicator combines the power of MACD divergence analysis with Bollinger Bands to help traders identify potential reversal points in the market.
Key Features:
MACD Calculation & Divergence:
The script calculates the standard MACD components (MACD line, Signal line, and Histogram) using configurable fast, slow, and signal lengths. It includes a simplified divergence detection mechanism that flags potential bearish divergence—when the price makes a new swing high but the MACD fails to confirm the move. This divergence can serve as an early warning that the bullish momentum is waning.
Bollinger Bands:
A 20-period simple moving average (SMA) is used as the basis, with upper and lower bands drawn at 2 standard deviations. These bands help visualize overbought and oversold conditions. For example, a close at or above the upper band suggests the market may be overextended (overbought), while a close at or below the lower band may indicate oversold conditions.
Visual Alerts:
The indicator plots the Bollinger Bands on the chart along with labels marking overbought and oversold conditions. Additionally, it marks potential bearish divergence with a downward triangle, providing a quick visual cue to traders.
Usage Suggestions:
Confluence with Other Signals:
Use the divergence signals and Bollinger Band conditions as filters. For example, even if another indicator suggests a long entry, you might avoid it if the price is overbought or if MACD divergence warns of weakening momentum.
Customization:
All key parameters, such as the MACD lengths, Bollinger Band period, and multiplier, are fully configurable. This flexibility allows you to adjust the indicator to suit different markets or trading styles.
Disclaimer:
This script is provided for educational purposes only. Always perform your own analysis and backtesting before trading with live capital.

Forward Curve Visualization ToolProvide the spot symbol and the futures product root, and the script automatically scans all relevant contracts for you—no more tedious manual searches. The result is a clean, intuitive chart showing the live forward curve in real time.
It also detects contango or backwardation conditions (based on spot < F1 < F2 < F3).
Future Features:
Plot historical snapshots of the curve (1 day, 1 week, or 1 month ago) to understand market trends over time.
Display additional metrics such as annualized basis, cost of carry (CoC), and even volume or open interest for deeper insights.
If you trade futures and watch the forward curve, this script will give you the actionable data you need and get more ideas or features you’d like to see. Let’s build them together!
Disclaimer
Please remember that past performance may not be indicative of future results.
Due to various factors, including changing market conditions, the strategy may no longer perform as well as in historical backtesting.
This post and the script don’t provide any financial advice.

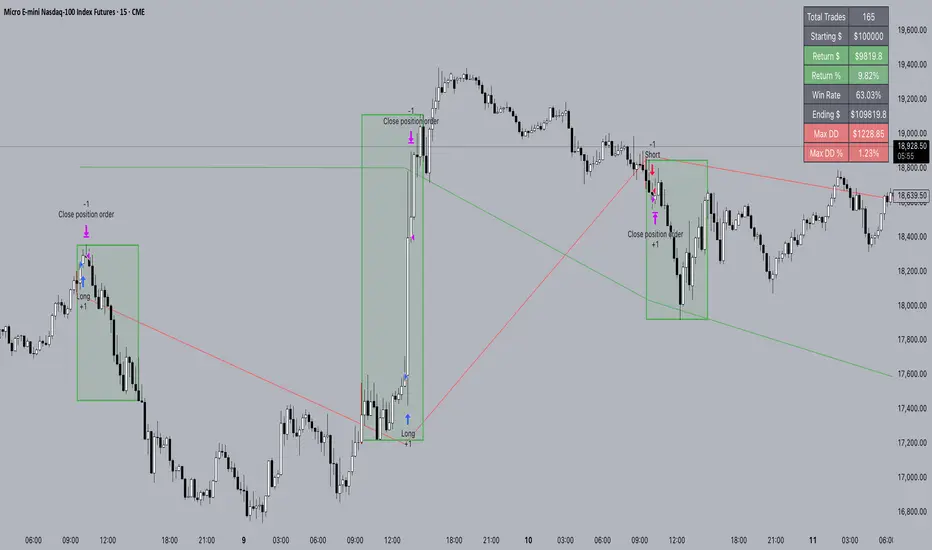
FXC NQ Opening Range Breakout Strategy V2.4Mechanical Strategy that trades breakouts on NQ futures on the 15min timeframe during the NYSE session. It's designed to manage Apex and Top Step accounts with the lowest risk possible.
Risk Disclaimer:
Past results as well as strategy tester reports do not indicate future performance. Guarantees do not exist in trading. By using this strategy you risk losing all your money.
Important:
It only trades on Monday, Wednesday and Friday and takes usually only 1 trade per trading day.
It works on the 15min timeframe only.
The settings are optimised already for NQ but feel free to change them.
How it works:
Every selected trading day it measures the range of the first 15min candle after the NYSE open. As soon as price closes above on the 15min timeframe, it will trade the breakout targeting a set risk to reward ratio. SL on the opposite side of the range. It will trail the SL after a set amount of points and uses a buffer of the set amount of points to trail it.
Settings:
Opening Range Time : This is the time of the day in hours and minutes when the strategy starts looking for trades. It's in the EST/ NY Timezone and set to 9:30-09:45 by default
because that's the NYSE open.
Session Time : This is the time of the day in hours and minutes until the strategy trades. It's in the EST/ NY Timezone and set to 09:45-14:45 by default.
because that's what gave the best results in backtesting. Open trades will get closed automatically once the end of the session is reached. No matter if win or loss. This is just to prevent holding positions over night.
Session Border This setting is to select the border color in which the session box will be plotted.
Opening Range Box This setting is to select the fill color of the opening range box.
Opening Range Border This setting is to select the border color of the session box.
Trade Timeframe This setting determines on which timeframe candle has to close outside the opening range box in order to take a trade. It's set to 15min by default because this is what worked by far the best in backtests and live trading.
Stop Loss Buffer in Points: This is simply the buffer in points that is added to the SL for safety reasons. If you have it on 0, the SL will be at the exact price of the opposite side of the range. By default it's set to 0 pips because this is what delivered the best results in backtests.
Profit Target Factor: This is simply the total SL size in points multiplied by x.
Example: If you put 2, you get a 1:2 Risk to Reward Ratio. By Default it's set to 4 because this gave the best results in backtests, because trades always get closed either by trailing SL or because the end of the session is reached.
Use Trailing Stop Loss: This setting is to enable/ disable the trailing stop loss. It's enabled by default because this is a fundamental part of the strategy.
Trailing Stop Buffer: This setting determines after how many points in profit the trailing SL will be activated.
Risk Type: You can chose either between Fixed USD Amount, Risk per Trade in % or Fixed Contract Size. By default it's set to fixed contract size.
Risk Amount (USD or Contracts): This setting is to set how many USD or how many contracts you want to risk per trade. Make sure to check which risk type you have selected before you chose the risk amount.
Use Limit Orders If enabled, the strategy will place a pending order x points from the current price, instead of a market order. Limit orders are enabled by default for a better performance. Important: It doesn't actually place a limit order. The strategy will just wait for a pullback and then enter with a market order. It's more like a hidden limit order.
Limit Order Distance (points): If you have limit orders enabled, this setting determines how many points from the current price the limit order will be placed.
Trading Days: These checkboxes are to select on which week days the strategy has to trade. Thursday is disabled by default because backtests have shown that Thursday is the least profitable day
Backtest Settings:
For the backtest the commissions ere set to 0.35 USD per mini contract which is the highest amount Tradeovate charges. Margin was not accounted for because typically on Apex accounts you can use way more contracts than you need for the extremely low max drawdown. Margin would be important on personal accounts but even there typically it's not an issue at all especially because this strategy runs on the 15min timeframe so it won't use a lot of contracts anyways.
What makes it unique:
This script is unique because it's designed to be used on Apex and Top Step accounts with extremely strict drawdown rules.
The strategy is optimised to be traded with a fixed contract size instead of using % risk. The reason for that is that the drawdown rules of these Futures Prop Accounts are very strict and the fact that the smallest trade-able contract size is 1.
Why the source code is hidden:
The source code is hidden because I invested a lot of time and money into developing this strategy and optimising it with paid 3rd party software. Also since I use it myself on my Apex accounts and prop firms don't allow copy trading I don't want it to be used by too many traders.
DNSE VN301!, SMA & EMA Cross StrategyDiscover the tailored Pinescript to trade VN30F1M Future Contracts intraday, the strategy focuses on SMA & EMA crosses to identify potential entry/exit points. The script closes all positions by 14:25 to avoid holding any contracts overnight.
HNX:VN301!
www.tradingview.com
Setting & Backtest result:
1-minute chart, initial capital of VND 100 million, entering 4 contracts per time, backtest result from Jan-2024 to Nov-2024 yielded a return over 40%, executed over 1,000 trades (average of 4 trades/day), winning trades rate ~ 30% with a profit factor of 1.10.
The default setting of the script:
A decent optimization is reached when SMA and EMA periods are set to 60 and 15 respectively while the Long/Short stop-loss level is set to 20 ticks (2 points) from the entry price.
Entry & Exit conditions:
Long signals are generated when ema(15) crosses over sma(60) while Short signals happen when ema(15) crosses under sma(60). Long orders are closed when ema(15) crosses under sma(60) while Short orders are closed when ema(15) crosses over sma(60).
Exit conditions happen when (whichever came first):
Another Long/Short signal is generated
The Stop-loss level is reached
The Cut-off time is reached (14:25 every day)
*Disclaimers:
Futures Contracts Trading are subjected to a high degree of risk and price movements can fluctuate significantly. This script functions as a reference source and should be used after users have clearly understood how futures trading works, accessed their risk tolerance level, and are knowledgeable of the functioning logic behind the script.
Users are solely responsible for their investment decisions, and DNSE is not responsible for any potential losses from applying such a strategy to real-life trading activities. Past performance is not indicative/guarantee of future results, kindly reach out to us should you have specific questions about this script.
---------------------------------------------------------------------------------------
Khám phá Pinescript được thiết kế riêng để giao dịch Hợp đồng tương lai VN30F1M trong ngày, chiến lược tập trung vào các đường SMA & EMA cắt nhau để xác định các điểm vào/ra tiềm năng. Chiến lược sẽ đóng tất cả các vị thế trước 14:25 để tránh giữ bất kỳ hợp đồng nào qua đêm.
Thiết lập & Kết quả backtest:
Chart 1 phút, vốn ban đầu là 100 triệu đồng, vào 4 hợp đồng mỗi lần, kết quả backtest từ tháng 1/2024 tới tháng 11/2024 mang lại lợi nhuận trên 40%, thực hiện hơn 1.000 giao dịch (trung bình 4 giao dịch/ngày), tỷ lệ giao dịch thắng ~ 30% với hệ số lợi nhuận là 1,10.
Thiết lập mặc định của chiến lược:
Đạt được một mức tối ưu ổn khi SMA và EMA periods được đặt lần lượt là 60 và 15 trong khi mức cắt lỗ được đặt thành 20 tick (2 điểm) từ giá vào.
Điều kiện Mở và Đóng vị thế:
Tín hiệu Long được tạo ra khi ema(15) cắt trên sma(60) trong khi tín hiệu Short xảy ra khi ema(15) cắt dưới sma(60). Lệnh Long được đóng khi ema(15) cắt dưới sma(60) trong khi lệnh Short được đóng khi ema(15) cắt lên sma(60).
Điều kiện đóng vị thể xảy ra khi (tùy điều kiện nào đến trước):
Một tín hiệu Long/Short khác được tạo ra
Giá chạm mức cắt lỗ
Lệnh chưa đóng nhưng tới giờ cut-off (14:25 hàng ngày)
*Tuyên bố miễn trừ trách nhiệm:
Giao dịch hợp đồng tương lai có mức rủi ro cao và giá có thể dao động đáng kể. Chiến lược này hoạt động như một nguồn tham khảo và nên được sử dụng sau khi người dùng đã hiểu rõ cách thức giao dịch hợp đồng tương lai, đã đánh giá mức độ chấp nhận rủi ro của bản thân và hiểu rõ về logic vận hành của chiến lược này.
Người dùng hoàn toàn chịu trách nhiệm về các quyết định đầu tư của mình và DNSE không chịu trách nhiệm về bất kỳ khoản lỗ tiềm ẩn nào khi áp dụng chiến lược này vào các hoạt động giao dịch thực tế. Hiệu suất trong quá khứ không chỉ ra/cam kết kết quả trong tương lai, vui lòng liên hệ với chúng tôi nếu bạn có thắc mắc cụ thể về chiến lược giao dịch này.

Bull Flag DetectionThe FuturesGod bull flag indicator aims to identify the occurrence of bull flags.
Bull flags are a popular trading pattern that allows users to gauge long entries into a given market. Flags consist of a pole that is followed by either a downward or sideways consolidation period.
This script can be used on any market but was intended for futures (NQ, ES) trading on the intraday timeframe.
The script does the following:
1. Identifies the occurrence of a flag pole. This is based on a lookback period and percentage threshold decided by the user.
2. Marks the consolidation area after the pole occurrence using swing highs and swing lows.
3. Visually the above is represented by a shaded green area.
4. When a pole is detected, it is marked by a downward off-white triangle. Note that if the percentage threshold is reached several times on the same upward climb, the script will continue to identify points where the threshold for pole detection is met.
5. Also visualized are the 20, 50 and 200 period exponential moving averages. The area between the 20 and 50 EMAs are shaded to provide traders a visual of a possible support area.

REMA CROSSOVER BY JUGNUThis indicator triggers alerts for long and short positions on DAILY TIME FRAME for SWING trades based on the conditions which described below. This script will generate alerts when the following conditions are met:
LONG POSITION:
RSI(14) above 50.
EMA(5) crosses above EMA(10).
Indicator Triangle Green below price bars
SHORT POSITION:
RSI(14) below 50.
EMA(5) crosses down EMA(10).
Indicator Triangle RED above price bars
This script plots green and red triangles below and above the price bars to indicate long and short alert conditions, respectively. It also triggers alerts when these conditions are met.
BB_MDL_V1Simple indicator that is based on the average line of the bollinger bands and the exponential average of 200 periods.
The customizable variable is bollinger bands length, currently the default is 35, you can tweak it to your liking and see how trend identification changes.
My recommendation is to work in 5-minute time frames in values such as SOL, FTM or MASK (cryptos)
This simple strategy can be combined with many others to gain more insight and get better market entries and exits.

Failed Breakdown Detection'Failed Breakdowns' are a popular set up for long entries.
In short, the set up requires:
1) A significant low is made ('initial low')
2) Initial low is undercut with a new low
3) Price action then 'reclaims' the initial low by moving +8-10 points from the initial low
This script aims at detecting such set ups. It was coded with the ES Futures 15 minute chart in mind but may be useful on other instruments and time frames.
Business Logic:
1) Uses pivot lows to detect 'significant' initial lows
2) Uses amplitude threshold to detect a new low beneath the initial low; used /u/ben_zen script for this
3) Looks for a valid reclaim - a green candle that occurs within 10 bars of the new low
4) Price must reclaim at least 8 points for the set up to be valid
5) If a signal is detected, the initial low value (pivot low) is stored in array that prevents duplicate signals from being generated.
6) FBD Signal is plotted on the chart with "X"
7) Pivot low detection is plotted on the chart with "P" and a label
8) New lows are plotted on the chart with a blue triangle
Notes:
User input
- My preference is to use the defaults as is, but as always feel free to experiment
- Can modify pivot length but in my experience 10/10 work best for pivot lows
- New low detection - 55 bars and 0.05 amplitude work well based on visual checks of signals
- Can modify the number of points needed to reclaim a low, and the # of bars limit under which this must occur.
Alerts:
- Alerts are available for detection of new lows and detection of failed breakdowns
- Alerts are also available for these signals but only during 7:30PM-4PM EST - 'prime time' US trading hours
Limitations:
- Current version of the script only compares new lows to the most recent pivot low, does not look at anything prior to that
- Best used as a discretionary signal
Visit /u/ben_zen's Profile:
www.tradingview.com
Profile Link www.tradingview.com

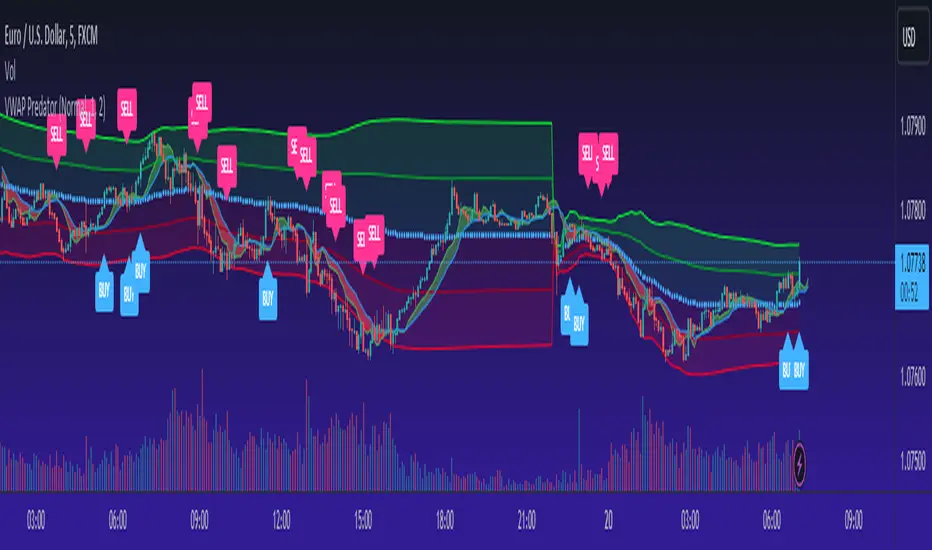
VWAP PredatorUsing VWAP as a start point, the VWAP Predator uses proprietary Fibonacci bands to help determine signal criteria. Most traders use VWAP in a simple way to determine whether an instrument is in a bearish or bullish state, but that doesn't help choosing the correct time to go long or short.
The xBat VWAP Predator uses behavioural analysis with volume, price action with open and close proximities to the Fibonacci bands/zones (Fib Zones). The following describes how the xBrat VWAP Predator is different to any standard use of Volume Weighted Average Price and uses xBrat Proprietary Behavioural logic to determine high probability long and Short signals. All of this heavy lifting and logic is done behind the scenes, keeping traders charts clean.
Long Trading Signals - Candle Coloured in Blue - There are many states with the logic to produce these signals, which are briefly described below:
1. The only standard criteria here - The price action must be above the VWAP Line
2. The Price must open below the boundary of one Fib Zone and close into the next Fib Zone
3. That Same Candle has to be an Accumulation Candle (more volume than the preceding candle and More Buyers) - This is determined with our proprietary logic coding
4. The Same signal candle also has to be higher than average volume. Again, our proprietary xBrat Logic just doesn't look back over a set number of bars, it looks at times of day and day of week, plus more to determine a true valuation of higher, lower or equal to average volume.
5. Only when these states are met, plus two more ema proximity logic, Does the xBrat VWAP predator give a Long Signal.
6. Trade Management is either set targets or indeed a simple ema cross which we provide as a ribbon on the chart to help traders. These ema's are different to entry logic. When the Ribbon turns from green to red, the trader should consider exiting the trade
Short Trading Signals - Candle Coloured in Pink - There are many states with the logic to produce these signals, which are briefly described below:
1. The only standard criteria here - The price action must be below the VWAP Line
2. The Price must open above the boundary of one Fib Zone and close into the next Fib Zone
3. That Same Candle has to be a Distribution Candle (more volume than the preceding candle and More Sellers) - This is determined with our proprietary logic coding
4. The Same signal candle also has to be higher than average volume. Again, our proprietary xBrat Logic just doesn't look back over a set number of bars, it looks at times of day and day of week, plus more to determine a true valuation of higher, lower or equal to average volume.
5. Only when these states are met, plus two more ema proximity logic, Does the xBrat VWAP predator give a Short Signal.
6. Trade Management is either set targets or indeed a simple ema cross which we provide as a ribbon on the chart to help traders. These ema's are different to entry logic. When the Ribbon turns from red to green, the trader should consider exiting the trade.
VWAP Predator is a day trading and scalping signals trading indicator.
Future Risk CalculatorCreated out of revenge against the difficulty of controlling psychology, greed, and risk management. Designed for cryptocurrency futures trading by following the risk management principles from Kevin Sailly. Very welcome if there are suggestions and input to improve the quality of this "indicator". Please use wisely.
How to use:
1. Open indicator settings.
2. Fill out all the forms. (Note: I make Max Loss Risk only has 5 options. Because, you know, to control the greed. You can choose by considering your risk profiles and market condition)
3. All of the information and calculation will appear on the label (right side of the bar chart) and top-right box.
4. You can adjust the three prices (target, entry, and stop) by clicking any part of the indicator. There will be three dots in the middle of the chart window (align with three prices). Click that dots and drag them up/down to customize according to your wishes. The price order must be correct, for LONG direction the price order from the top is target-entry-stop. Vice versa for SHORT direction. There will be "SETUP ERROR" text in the top-right box if the price order is not correct.
"Never, ever argue with your trading system." (by Michael Covel)
Regards,
Ircham

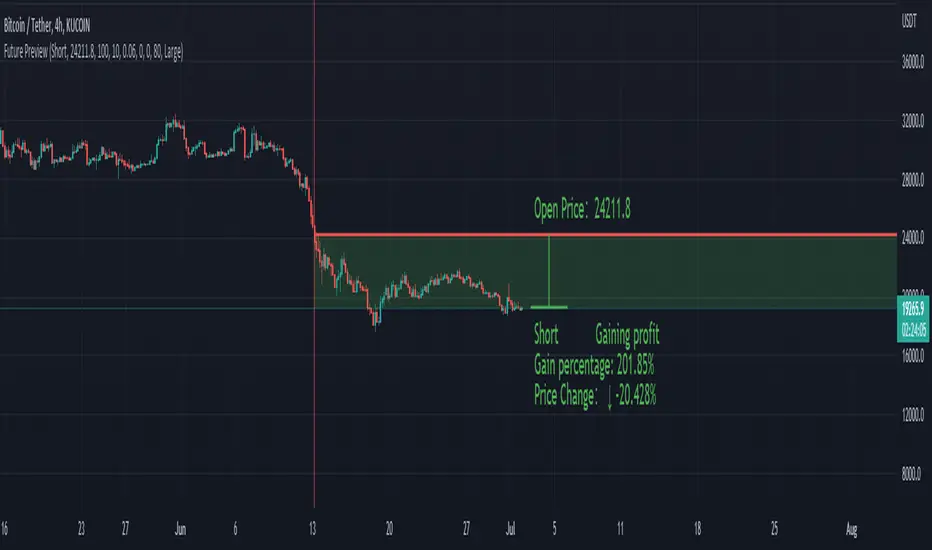
Future PreviewFuture Preview
Calculate real-time future order profit with open price, leverage and commission fee. Simple and straight forward. If you need any additional feature, please leave a comment below. I am glad to help.
Usage:
When adding Future Preview to chart, it will ask order open time and open price on the chart by clicking with left mouse on the desired value. These value can be changed lately, as well as the leverage and commission fee. Default leverage is 10 and default commission fee is 0.06% (taker).
There will be two horizontal lines. The solid longer line is the open price line, it shows the order open price. The shorter line moving with real-time price is the current price line, it shows the current price. There will be preview data shows on top or below the price line. Open price line is red for short order and green for long order. The current price line is red when the order is losing and it is green when it profiting. The back ground color follows the color of current price line. Background color transparency and gain/loss color can be changed in options.
There will be one horizontal line on the left if the option of showing open time is on (default is on). It shows the time stamp when current order opened.
After adding Future Preview to chart, there is option to add Taking Profit(TP) or Stop Loss(SL) to the chart.
Font size can be changed in option
Metals:Backwardation/ContangoMETALS: Gold , Silver , Copper ( GC , SI, HG)
Quickly visualize carrying charge market vs backwardized market by comparing the price of the next 2 years of futures contracts.
Carrying charge (contract prices increasing into the future) = normal, representing the costs of carrying/storage of a commodity. When this is flipped to Backwardation (contract prices decreasing into the future): its a bullish sign: Buyers want this commodity, and they want it NOW.
Note: indicator does not map to time axis in the same way as price; it simply plots the progression of contract months out into the future; left to right; so timeframe DOESN'T MATTER for this plot
There's likely some more efficient way to write this; e.g. when plotting for Gold ( GC ); 21 of the security requests are redundant; but they are still made; and can make this slower to load
TO UPDATE(once a year will do): in REQUEST CONTRACTS section, delete old contracts (top) and add new ones (bottom). Then in PLOTTING section, Delete old contract labels (bottom); add new contract labels (top); adjust the X in 'bar_index-(X+_historical)' numbers accordingly
This is one of three similar indicators: Meats | Metals | Grains
-If you want to build from this; to work on other commodities ; be aware that Tradingview limits the number of contract calls to 40 (hence the 3 seperate indicators)
Tips:
-Right click and reset chart if you can't see the plot; or if you have trouble with the scaling.
-Right click and add to new scale if you prefer this not to overlay directly on price. Or move to new pane below.
--Added historical input: input days back in time; to see the historical shape of the Futures curve via selecting 'days back' snapshot
updated 15th June 2022
© twingall

Grains:Backwardation/ContangoGRAINS: Wheat , Soybeans , Corn (ZW, ZS, ZC )
Quickly visualize carrying charge market vs backwardized market by comparing the price of the next 2 years of futures contracts.
Carrying charge (contract prices increasing into the future) = normal, representing the costs of carrying/storage of a commodity. When this is flipped to Backwardation (contract prices decreasing into the future): its a bullish sign: Buyers want this commodity, and they want it NOW.
The above chart shows a nice example of backwardation.
Note: indicator does not map to time axis in the same way as price; it simply plots the progression of contract months out into the future; left to right; so timeframe DOESN'T MATTER for this plot
There's likely some more efficient way to write this; e.g. when plotting for Wheat (ZW); 15 of the security requests are redundant; but they are still made; and can make this slower to load
TO UPDATE(once a year will do): in REQUEST CONTRACTS section, delete old contracts (top) and add new ones (bottom). Then in PLOTTING section, Delete old contract labels (bottom); add new contract labels (top); adjust the X in 'bar_index-(X+_historical)' numbers accordingly
This is one of three similar indicators: Meats | Metals | Grains
-If you want to build from this; to work on other commodities ; be aware that Tradingview limits the number of contract calls to 40 (hence the 3 seperate indicators)
Tips:
-Right click and reset chart if you can't see the plot; or if you have trouble with the scaling.
-Right click and add to new scale if you prefer this not to overlay directly on price. Or move to new pane below.
--Added historical input: input days back in time; to see the historical shape of the Futures curve via selecting 'days back' snapshot
updated 15th June 2022
© twingall

Settlement priceThis script is meant to be used intraday, on futures products.
It charts the previous day/week/month settlement price as a constant level intraday.
The settlement price of a product is calculated by the exchange at the end of each day. It is shown in the D/W/M chart as the close price. The settlement price does not coincide with the last close price intraday, thus creating the need of a script like this.
The settlement price can be a pivotal price in intraday futures trading, as it can act as support or resistance
You can select the resolution of the settlement by the "Resolution" input
xBrat BIAS DEPTH HeatmapThis Trading Indicator is the "Go - No Go Gauge" for any trading signals strategy. A Sub-Chart that looks up 6 time frames and gives you real time BIAS. Bullish, Neutral or Bearish on each level. Making decisions, acting on trading signals easier! Only identifying those highest probability trades, no matter what signals trading indicator you are using. Ideal for Forex Trading, Futures Trading, Crypto Trading and Stocks Trading
This BIAS Depth Heatmap includes:
6 Levels of BIAS Depth
Scalping Setting
Day Trading Setting
Swing Trading Setting
And by only concentrating on trading the highest probability trades of any trading strategy, we can block out all the other noise and concentrate on a simple set of rules!
This is why our Founder, Paul Bratby, decided to help filter out all the noise and allow traders to see what's going off on higher timeframes "in depth" to help make those important trade entry decisions. This more global view of the BIAS DEPTH is designed to help traders make decisions faster!

action zone - ATR stop reverse order strategy v0.1 by 9nckACTION ZONE-ATR MOD v0.1 DOCUMENTATION
Overview
This tradingview pine script strategy is mainly created to enrich my coding skill. It is a combination of “CDC-ACTIONZONE” and my personal studies of trading techniques in various sources e.g.book, course or blog. This strategy purposefully built to connect with my automatic trading bot. However, It will be very useful to aid your trading routine by diminishing mental distraction which possibly leads to bad trades.
How does it work?
This strategy will do a basic simple thing that most traders do by creating entry signals on both sides long/short and also set the stop loss. Furthermore, It will also reverse the order (from long to short and vice versa (if long/short conditions are met). Finally, it will recalculate the stop loss/take profit price in every complete bar to increase the chance of winning and limit our loss.
Entry rules(Long/Short)
If you have no open order, an order will be created when a fast EMA crosses(up(long)/down(short) the slow EMA(It’s as simple as that).
If you have an open order, the current order will be (sold if long, covered if short) and the opposite side order will be created.
Exit and Reverse rules(Long/Short)
If fast EMA cross (DOWN(long), UP(short)), the current order will be closed, THE OPPOSITE SIDE ORDER WILL ALSO BE CREATED.
Risk management
FLEX STOP PRICE : initial value will be set at the bar which order created. It is a fast ema (+/-) MIDDLE ATR value.
If MIDDLE ATR value rises, it will be our new stop price.
If MIDDLE ATR value falls, stop price unchanged
If Price OVERBOUGHT(long)/SOLD(short), LOW of that bar will be a new stop price.
Minimum position hold period
In order to eliminate risk of repeatedly open, close orders in sideway trends. Minimum hold period must be passed to start exit our position. However, It always respects stop loss prices. The value refers to the number of bars.
MUST READ!!!
This strategy uses only MARKET ORDER. If you trade with a bot, make sure you choose only enormous market cap tokens.
This strategy is bi-direction strategy. It will work best in the DERIVATIVE market.
It was initially designed to compete in the cryptocurrency market which has very high volume and volatility.
I only use this strategy in 1HR (acceptable change rate, optimum trade frequency)
How (should) we use it?
Choose crypto future pairs (recommend only top 10-15 market volume pairs in Binance, let’s say 1000M+ trade value)
Choose your time frame (1H is strongly recommended)
Setup your portfolio profile (Setting->Properties) such as Initial cap, order size, commission. DO NOT USE CAL ON EVERY TICK IT WILL CAUSE REPAINTING AND YOUR CAPITAL IS BLEEDING !!!
BACKTEST FIRST!! Back test is a combination of art, math and statis(and a bit of luck). You can apply to train and test methods or whatever you are familiar with. In my opinion, your test period should include UPTREND, SIDEWAY, DOWNTREND. Fine tune fast, slow ema first(my best ema length of 1H timeframe around 7-10, 17-22). Try to eliminate fault breakout trade and use other options only necessary. Hopefully we can use automatic optimization on Pine Script soon.
Don’t forget to turn off using a specific backtest date option to start your strategy.A
THIS IS NOT A PERFECT (OR EVEN PROFITABLE) STRATEGY. USE AT YOUR OWN RISK AND TRADE RESPONSIBLY. DYOR DUDE.

NCTA Aurora SystemAurora System
This system is designed to present a simple view of trending signals. The signals within the Aurora System will alert the beginning of a possible new trend. The signals also indicate when a trend is continuing or weakening, which advises the trader to adjust their stop or exit the trade. If the trend resumes, the system will print a new confirmation of an entry.
When traded properly, using a 2-3 timeframe alignment, the system will display both trending trades, which anticipate a potentially longer move, or catch trades which are likely shorter moves, which at times may be counter trend, so traders will be looking for a smaller profit.
There are two settings, CXA and PBA. CXA is more sensitive to triggering possible entries while PBA is more conservative. The system will display on the indicator which “mode” is set, CXA or PBA.
How to Use:
When the first red bar appears, labeled with a “S”, go short. This is indicating the start of a possible short trend.
When the first blue bar appears, labeled with a “L”, go long. This is indicating the start of a possible long trend.
White bars indicate a neutral or no trend.
This system can be used individually on a single time frame, but reduces chop and noise when used on a combination of time frames such as an alignment between the 3 minute and 10 minute chart for intraday trading.
3 Minute and 10 Minute Alignment Example:
For example: When the 10 minute PBA signal appears (Red bar with “S” or Blue bar with “L”), monitor the 3 minute chart for a confirmation of that signal (Red bar with “S” or Blue bar with “L”) and enter based on the 3 minute chart
At times, the 10m will first print when the 3m is on a retracement. It may take another 3 - 6 min before the 3m signals a valid entry
Exit when 10m PBA signal stops (could be a white bar or just a blank space on the indicator)
Next Bar Alert:
Included is an optional "Next Bar Alert" setting. Since many of these signals benefit from very prompt action at the beginning of a price bar, there is an additional option in Settings to set an arbitrary number of seconds to be alerted before the next price bar opens. Simply set this to a level you prefer, then set an alert in TradingView on the indicator using the "Next Bar Alert" alert parameter.
