FVG Premium [no1x]█ OVERVIEW
This indicator provides a comprehensive toolkit for identifying, visualizing, and tracking Fair Value Gaps (FVGs) across three distinct timeframes (current chart, a user-defined Medium Timeframe - MTF, and a user-defined High Timeframe - HTF). It is designed to offer traders enhanced insight into FVG dynamics through detailed state monitoring (formation, partial fill, full mitigation, midline touch), extensive visual customization for FVG representation, and a rich alert system for timely notifications on FVG-related events.
█ CONCEPTS
This indicator is built upon the core concept of Fair Value Gaps (FVGs) and their significance in price action analysis, offering a multi-layered approach to their detection and interpretation across different timeframes.
Fair Value Gaps (FVGs)
A Fair Value Gap (FVG), also known as an imbalance, represents a range in price delivery where one side of the market (buying or selling) was more aggressive, leaving an inefficiency or an "imbalance" in the price action. This concept is prominently featured within Smart Money Concepts (SMC) and Inner Circle Trader (ICT) methodologies, where such gaps are often interpreted as footprints left by "smart money" due to rapid, forceful price movements. These methodologies suggest that price may later revisit these FVG zones to rebalance a prior inefficiency or to seek liquidity before continuing its path. These gaps are typically identified by a three-bar pattern:
Bullish FVG : This is a three-candle formation where the second candle shows a strong upward move. The FVG is the space created between the high of the first candle (bottom of FVG) and the low of the third candle (top of FVG). This indicates a strong upward impulsive move.
Bearish FVG : This is a three-candle formation where the second candle shows a strong downward move. The FVG is the space created between the low of the first candle (top of FVG) and the high of the third candle (bottom of FVG). This indicates a strong downward impulsive move.
FVGs are often watched by traders as potential areas where price might return to "rebalance" or find support/resistance.
Multi-Timeframe (MTF) Analysis
The indicator extends FVG detection beyond the current chart's timeframe (Low Timeframe - LTF) to two higher user-defined timeframes: Medium Timeframe (MTF) and High Timeframe (HTF). This allows traders to:
Identify FVGs that might be significant on a broader market structure.
Observe how FVGs from different timeframes align or interact.
Gain a more comprehensive perspective on potential support and resistance zones.
FVG State and Lifecycle Management
The indicator actively tracks the lifecycle of each detected FVG:
Formation : The initial identification of an FVG.
Partial Fill (Entry) : When price enters but does not completely pass through the FVG. The indicator updates the "current" top/bottom of the FVG to reflect the filled portion.
Midline (Equilibrium) Touch : When price touches the 50% level of the FVG.
Full Mitigation : When price completely trades through the FVG, effectively "filling" or "rebalancing" the gap. The indicator records the mitigation time.
This state tracking is crucial for understanding how price interacts with these zones.
FVG Classification (Large FVG)
FVGs can be optionally classified as "Large FVGs" (LV) if their size (top to bottom range) exceeds a user-defined multiple of the Average True Range (ATR) for that FVG's timeframe. This helps distinguish FVGs that are significantly larger relative to recent volatility.
Visual Customization and Information Delivery
A key concept is providing extensive control over how FVGs are displayed. This control is achieved through a centralized set of visual parameters within the indicator, allowing users to configure numerous aspects (colors, line styles, visibility of boxes, midlines, mitigation lines, labels, etc.) for each timeframe. Additionally, an on-chart information panel summarizes the nearest unmitigated bullish and bearish FVG levels for each active timeframe, providing a quick glance at key price points.
█ FEATURES
This indicator offers a rich set of features designed to provide a highly customizable and comprehensive Fair Value Gap (FVG) analysis experience. Users can tailor the FVG detection, visual representation, and alerting mechanisms across three distinct timeframes: the current chart (Low Timeframe - LTF), a user-defined Medium Timeframe (MTF), and a user-defined High Timeframe (HTF).
Multi-Timeframe FVG Detection and Display
The core strength of this indicator lies in its ability to identify and display FVGs from not only the current chart's timeframe (LTF) but also from two higher, user-selectable timeframes (MTF and HTF).
Timeframe Selection: Users can specify the exact MTF (e.g., "60", "240") and HTF (e.g., "D", "W") through dedicated inputs in the "MTF (Medium Timeframe)" and "HTF (High Timeframe)" settings groups. The visibility of FVGs from these higher timeframes can be toggled independently using the "Show MTF FVGs" and "Show HTF FVGs" checkboxes.
Consistent Detection Logic: The FVG detection logic, based on the classic three-bar imbalance pattern detailed in the 'Concepts' section, is applied consistently across all selected timeframes (LTF, MTF, HTF)
Timeframe-Specific Visuals: Each timeframe's FVGs (LTF, MTF, HTF) can be customized with unique colors for bullish/bearish states and their mitigated counterparts. This allows for easy visual differentiation of FVGs originating from different market perspectives.
Comprehensive FVG Visualization Options
The indicator provides extensive control over how FVGs are visually represented on the chart for each timeframe (LTF, MTF, HTF).
FVG Boxes:
Visibility: Main FVG boxes can be shown or hidden per timeframe using the "Show FVG Boxes" (for LTF), "Show Boxes" (for MTF/HTF) inputs.
Color Customization: Colors for bullish, bearish, active, and mitigated FVG boxes (including Large FVGs, if classified) are fully customizable for each timeframe.
Box Extension & Length: FVG boxes can either be extended to the right indefinitely ("Extend Boxes Right") or set to a fixed length in bars ("Short Box Length" or "Box Length" equivalent inputs).
Box Labels: Optional labels can display the FVG's timeframe and fill percentage on the box. These labels are configurable for all timeframes (LTF, MTF, and HTF). Please note: If FVGs are positioned very close to each other on the chart, their respective labels may overlap. This can potentially lead to visual clutter, and it is a known behavior in the current version of the indicator.
Box Borders: Visibility, width, style (solid, dashed, dotted), and color of FVG box borders are customizable per timeframe.
Midlines (Equilibrium/EQ):
Visibility: The 50% level (midline or EQ) of FVGs can be shown or hidden for each timeframe.
Style Customization: Width, style, and color of the midline are customizable per timeframe. The indicator tracks if this midline has been touched by price.
Mitigation Lines:
Visibility: Mitigation lines (representing the FVG's opening level that needs to be breached for full mitigation) can be shown or hidden for each timeframe. If shown, these lines are always extended to the right.
Style Customization: Width, style, and color of the mitigation line are customizable per timeframe.
Mitigation Line Labels: Optional price labels can be displayed on mitigation lines, with a customizable horizontal bar offset for positioning. For optimal label placement, the following horizontal bar offsets are recommended: 4 for LTF, 8 for MTF, and 12 for HTF.
Persistence After Mitigation: Users can choose to keep mitigation lines visible even after an FVG is fully mitigated, with a distinct color for such lines. Importantly, this option is only effective if the general setting 'Hide Fully Mitigated FVGs' is disabled, as otherwise, the entire FVG and its lines will be removed upon mitigation.
FVG State Management and Behavior
The indicator tracks and visually responds to changes in FVG states.
Hide Fully Mitigated FVGs: This option, typically found in the indicator's general settings, allows users to automatically remove all visual elements of an FVG from the chart once price has fully mitigated it. This helps maintain chart clarity by focusing on active FVGs.
Partial Fill Visualization: When price enters an FVG, the indicator offers a dynamic visual representation: the portion of the FVG that has been filled is shown as a "mitigated box" (typically with a distinct color), while the original FVG box shrinks to clearly highlight the remaining, unfilled portion. This two-part display provides an immediate visual cue about how much of the FVG's imbalance has been addressed and what potential remains within the gap.
Visual Filtering by ATR Proximity: To help users focus on the most relevant price action, FVGs can be dynamically hidden if they are located further from the current price than a user-defined multiple of the Average True Range (ATR). This behavior is controlled by the "Filter Band Width (ATR Multiple)" input; setting this to zero disables the filter entirely, ensuring all detected FVGs remain visible regardless of their proximity to price.
Alternative Usage Example: Mitigation Lines as Key Support/Resistance Levels
For traders preferring a minimalist chart focused on key Fair Value Gap (FVG) levels, the indicator's visualization settings can be customized to display only FVG mitigation lines. This approach leverages these lines as potential support and resistance zones, reflecting areas where price might revisit to address imbalances.
To configure this view:
Disable FVG Boxes: Turn off "Show FVG Boxes" (for LTF) or "Show Boxes" (for MTF/HTF) for the desired timeframes.
Hide Midlines: Disable the visibility of the 50% FVG Midlines (Equilibrium/EQ).
Ensure Mitigation Lines are Visible: Keep "Mitigation Lines" enabled.
Retain All Mitigation Lines:
Disable the "Hide Fully Mitigated FVGs" option in the general settings.
Enable the feature to "keep mitigation lines visible even after an FVG is fully mitigated". This ensures lines from all FVGs (active or fully mitigated) remain on the chart, which is only effective if "Hide Fully Mitigated FVGs" is disabled.
This setup offers:
A Decluttered Chart: Focuses solely on the FVG opening levels.
Precise S/R Zones: Treats mitigation lines as specific points for potential price reactions.
Historical Level Analysis: Includes lines from past, fully mitigated FVGs for a comprehensive view of significant price levels.
For enhanced usability with this focused view, consider these optional additions:
The on-chart Information Panel can be activated to display a quick summary of the nearest unmitigated FVG levels.
Mitigation Line Labels can also be activated for clear price level identification. A customizable horizontal bar offset is available for positioning these labels; for example, offsets of 4 for LTF, 8 for MTF, and 12 for HTF can be effective.
FVG Classification (Large FVG)
This feature allows for distinguishing FVGs based on their size relative to market volatility.
Enable Classification: Users can enable "Classify FVG (Large FVG)" to identify FVGs that are significantly larger than average.
ATR-Based Threshold: An FVG is classified as "Large" if its height (price range) is greater than or equal to the Average True Range (ATR) of its timeframe multiplied by a user-defined "Large FVG Threshold (ATR Multiple)". The ATR period for this calculation is also configurable.
Dedicated Colors: Large FVGs (both bullish/bearish and active/mitigated) can be assigned unique colors, making them easily distinguishable on the chart.
Panel Icon: Large FVGs are marked with a special icon in the Info Panel.
Information Panel
An on-chart panel provides a quick summary of the nearest unmitigated FVG levels.
Visibility and Position: The panel can be shown/hidden and positioned in any of the nine standard locations on the chart (e.g., Top Right, Middle Center).
Content: It displays the price levels of the nearest unmitigated bullish and bearish FVGs for LTF, MTF (if active), and HTF (if active). It also indicates if these nearest FVGs are Large FVGs (if classification is enabled) using a selectable icon.
Styling: Text size, border color, header background/text colors, default text color, and "N/A" cell background color are customizable.
Highlighting: Background and text colors for the cells displaying the overall nearest bullish and bearish FVG levels (across all active timeframes) can be customized to draw attention to the most proximate FVG.
Comprehensive Alert System
The indicator offers a granular alert system for various FVG-related events, configurable for each timeframe (LTF, MTF, HTF) independently. Users can enable alerts for:
New FVG Formation: Separate alerts for new bullish and new bearish FVG formations.
FVG Entry/Partial Fill: Separate alerts for price entering a bullish FVG or a bearish FVG.
FVG Full Mitigation: Separate alerts for full mitigation of bullish and bearish FVGs.
FVG Midline (EQ) Touch: Separate alerts for price touching the midline of a bullish or bearish FVG.
Alert messages are detailed, providing information such as the timeframe, FVG type (bull/bear, Large FVG), relevant price levels, and timestamps.
█ NOTES
This section provides additional information regarding the indicator's usage, performance considerations, and potential interactions with the TradingView platform. Understanding these points can help users optimize their experience and troubleshoot effectively.
Performance and Resource Management
Maximum FVGs to Track : The "Max FVGs to Track" input (defaulting to 25) limits the number of FVG objects processed for each category (e.g., LTF Bullish, MTF Bearish). Increasing this value significantly can impact performance due to more objects being iterated over and potentially drawn, especially when multiple timeframes are active.
Drawing Object Limits : To manage performance, this script sets its own internal limits on the number of drawing objects it displays. While it allows for up to approximately 500 lines (max_lines_count=500) and 500 labels (max_labels_count=500), the number of FVG boxes is deliberately restricted to a maximum of 150 (max_boxes_count=150). This specific limit for boxes is a key performance consideration: displaying too many boxes can significantly slow down the indicator, and a very high number is often not essential for analysis. Enabling all visual elements for many FVGs across all three timeframes can cause the indicator to reach these internal limits, especially the stricter box limit
Optimization Strategies : To help you manage performance, reduce visual clutter, and avoid exceeding drawing limits when using this indicator, I recommend the following strategies:
Maintain or Lower FVG Tracking Count: The "Max FVGs to Track" input defaults to 25. I find this value generally sufficient for effective analysis and balanced performance. You can keep this default or consider reducing it further if you experience performance issues or prefer a less dense FVG display.
Utilize Proximity Filtering: I suggest activating the "Filter Band Width (ATR Multiple)" option (found under "General Settings") to display only those FVGs closer to the current price. From my experience, a value of 5 for the ATR multiple often provides a good starting point for balanced performance, but you should feel free to adjust this based on market volatility and your specific trading needs.
Hide Fully Mitigated FVGs: I strongly recommend enabling the "Hide Fully Mitigated FVGs" option. This setting automatically removes all visual elements of an FVG from the chart once it has been fully mitigated by price. Doing so significantly reduces the number of active drawing objects, lessens computational load, and helps maintain chart clarity by focusing only on active, relevant FVGs.
Disable FVG Display for Unused Timeframes: If you are not actively monitoring certain higher timeframes (MTF or HTF) for FVG analysis, I advise disabling their display by unchecking "Show MTF FVGs" or "Show HTF FVGs" respectively. This can provide a significant performance boost.
Simplify Visual Elements: For active FVGs, consider hiding less critical visual elements if they are not essential for your specific analysis. This could include box labels, borders, or even entire FVG boxes if, for example, only the mitigation lines are of interest for a particular timeframe.
Settings Changes and Platform Limits : This indicator is comprehensive and involves numerous calculations and drawings. When multiple settings are changed rapidly in quick succession, it is possible, on occasion, for TradingView to issue a "Runtime error: modify_study_limit_exceeding" or similar. This can cause the indicator to temporarily stop updating or display errors.
Recommended Approach : When adjusting settings, it is advisable to wait a brief moment (a few seconds) after each significant change. This allows the indicator to reprocess and update on the chart before another change is made
Error Recovery : Should such a runtime error occur, making a minor, different adjustment in the settings (e.g., toggling a checkbox off and then on again) and waiting briefly will typically allow the indicator to recover and resume correct operation. This behavior is related to platform limitations when handling complex scripts with many inputs and drawing objects.
Multi-Timeframe (MTF/HTF) Data and Behavior
HTF FVG Confirmation is Essential: : For an FVG from a higher timeframe (MTF or HTF) to be identified and displayed on your current chart (LTF), the three-bar pattern forming the FVG on that higher timeframe must consist of fully closed bars. The indicator does not draw speculative FVGs based on incomplete/forming bars from higher timeframes.
Data Retrieval and LTF Processing: The indicator may use techniques like lookahead = barmerge.lookahead_on for timely data retrieval from higher timeframes. However, the actual detection of an FVG occurs after all its constituent bars on the HTF have closed.
Appearance Timing on LTF (1 LTF Candle Delay): As a natural consequence of this, an FVG that is confirmed on an HTF (i.e., its third bar closes) will typically become visible on your LTF chart one LTF bar after its confirmation on the HTF.
Example: Assume an FVG forms on a 30-minute chart at 15:30 (i.e., with the close of the 30-minute bar that covers the 15:00-15:30 period). If you are monitoring this FVG on a 15-minute chart, the indicator will detect this newly formed 30-minute FVG while processing the data for the 15-minute bar that starts at 15:30 and closes at 15:45. Therefore, the 30-minute FVG will become visible on your 15-minute chart at the earliest by 15:45 (i.e., with the close of that relevant 15-minute LTF candle). This means the HTF FVG is reflected on the LTF chart with a delay equivalent to one LTF candle.
FVG Detection and Display Logic
Fair Value Gaps (FVGs) on the current chart timeframe (LTF) are detected based on barstate.isconfirmed. This means the three-bar pattern must be complete with closed bars before an FVG is identified. This confirmation method prevents FVGs from being prematurely identified on the forming bar.
Alerts
Alert Setup : To receive alerts from this indicator, you must first ensure you have enabled the specific alert conditions you are interested in within the indicator's own settings (see 'Comprehensive Alert System' under the 'FEATURES' section). Once configured, open TradingView's 'Create Alert' dialog. In the 'Condition' tab, select this indicator's name, and crucially, choose the 'Any alert() function call' option from the dropdown list. This setup allows the indicator to trigger alerts based on the precise event conditions you have activated in its settings
Alert Frequency : Alerts are designed to trigger once per bar close (alert.freq_once_per_bar_close) for the specific event.
User Interface (UI) Tips
Settings Group Icons: In the indicator settings menu, timeframe-specific groups are marked with star icons for easier navigation: 🌟 for LTF (Current Chart Timeframe), 🌟🌟 for MTF (Medium Timeframe), and 🌟🌟🌟 for HTF (High Timeframe).
Dependent Inputs: Some input settings are dependent on others being enabled. These dependencies are visually indicated in the settings menu using symbols like "↳" (dependent setting on the next line), "⟷" (mutually exclusive inline options), or "➜" (directly dependent inline option).
Settings Layout Overview: The indicator settings are organized into logical groups for ease of use. Key global display controls – such as toggles for MTF FVGs, HTF FVGs (along with their respective timeframe selectors), and the Information Panel – are conveniently located at the very top within the '⚙️ General Settings' group. This placement allows for quick access to frequently adjusted settings. Other sections provide detailed customization options for each timeframe (LTF, MTF, HTF), specific FVG components, and alert configurations.
█ FOR Pine Script® CODERS
This section provides a high-level overview of the FVG Premium indicator's internal architecture, data flow, and the interaction between its various library components. It is intended for Pine Script™ programmers who wish to understand the indicator's design, potentially extend its functionality, or learn from its structure.
System Architecture and Modular Design
The indicator is architected moduarly, leveraging several custom libraries to separate concerns and enhance code organization and reusability. Each library has a distinct responsibility:
FvgTypes: Serves as the foundational data definition layer. It defines core User-Defined Types (UDTs) like fvgObject (for storing all attributes of an FVG) and drawSettings (for visual configurations), along with enumerations like tfType.
CommonUtils: Provides utility functions for common tasks like mapping user string inputs (e.g., "Dashed" for line style) to their corresponding Pine Script™ constants (e.g., line.style_dashed) and formatting timeframe strings for display.
FvgCalculations: Contains the core logic for FVG detection (both LTF and MTF/HTF via requestMultiTFBarData), FVG classification (Large FVGs based on ATR), and checking FVG interactions with price (mitigation, partial fill).
FvgObject: Implements an object-oriented approach by attaching methods to the fvgObject UDT. These methods manage the entire visual lifecycle of an FVG on the chart, including drawing, updating based on state changes (e.g., mitigation), and deleting drawing objects. It's responsible for applying the visual configurations defined in drawSettings.
FvgPanel: Manages the creation and dynamic updates of the on-chart information panel, which displays key FVG levels.
The main indicator script acts as the orchestrator, initializing these libraries, managing user inputs, processing data flow between libraries, and handling the main event loop (bar updates) for FVG state management and alerts.
Core Data Flow and FVG Lifecycle Management
The general data flow and FVG lifecycle can be summarized as follows:
Input Processing: User inputs from the "Settings" dialog are read by the main indicator script. Visual style inputs (colors, line styles, etc.) are consolidated into a types.drawSettings object (defined in FvgTypes). Other inputs (timeframes, filter settings, alert toggles) control the behavior of different modules. CommonUtils assists in mapping some string inputs to Pine constants.
FVG Detection:
For the current chart timeframe (LTF), FvgCalculations.detectFvg() identifies potential FVGs based on bar patterns.
For MTF/HTF, the main indicator script calls FvgCalculations.requestMultiTFBarData() to fetch necessary bar data from higher timeframes, then FvgCalculations.detectMultiTFFvg() identifies FVGs.
Newly detected FVGs are instantiated as types.fvgObject and stored in arrays within the main script. These objects also undergo classification (e.g., Large FVG) by FvgCalculations.
State Update & Interaction: On each bar, the main indicator script iterates through active FVG objects to manage their state based on price interaction:
Initially, the main script calls FvgCalculations.fvgInteractionCheck() to efficiently determine if the current bar's price might be interacting with a given FVG.
If a potential interaction is flagged, the main script then invokes methods directly on the fvgObject instance (e.g., updateMitigation(), updatePartialFill(), checkMidlineTouch(), which are part of FvgObject).
These fvgObject methods are responsible for the detailed condition checking and the actual modification of the FVG's state. For instance, the updateMitigation() and updatePartialFill() methods internally utilize specific helper functions from FvgCalculations (like checkMitigation() and checkPartialMitigation()) to confirm the precise nature of the interaction before updating the fvgObject’s state fields (such as isMitigated, currentTop, currentBottom, or isMidlineTouched).
Visual Rendering:
The FvgObject.updateDrawings() method is called for each fvgObject. This method is central to drawing management; it creates, updates, or deletes chart drawings (boxes, lines, labels) based on the FVG's current state, its prev_* (previous bar state) fields for optimization, and the visual settings passed via the drawSettings object.
Information Panel Update: The main indicator script determines the nearest FVG levels, populates a panelData object (defined in FvgPanelLib), and calls FvgPanel.updatePanel() to refresh the on-chart display.
Alert Generation: Based on the updated FVG states and user-enabled alert settings, the main indicator script constructs and triggers alerts using Pine Script's alert() function."
Key Design Considerations
UDT-Centric Design: The fvgObject UDT is pivotal, acting as a stateful container for all information related to a single FVG. Most operations revolve around creating, updating, or querying these objects.
State Management: To optimize drawing updates and manage FVG lifecycles, fvgObject instances store their previous bar's state (e.g., prevIsVisible, prevCurrentTop). The FvgObject.updateDrawings() method uses this to determine if a redraw is necessary, minimizing redundant drawing calls.
Settings Object: A drawSettings object is populated once (or when inputs change) and passed to drawing functions. This avoids repeatedly reading numerous input() values on every bar or within loops, improving performance.
Dynamic Arrays for FVG Storage: Arrays are used to store collections of fvgObject instances, allowing for dynamic management (adding new FVGs, iterating for updates).
Fvg

FvgPanel█ OVERVIEW
This library provides functionalities for creating and managing a display panel within a Pine Script™ indicator. Its primary purpose is to offer a structured way to present Fair Value Gap (FVG) information, specifically the nearest bullish and bearish FVG levels across different timeframes (Current, MTF, HTF), directly on the chart. The library handles the table's structure, header initialization, and dynamic cell content updates.
█ CONCEPTS
The core of this library revolves around presenting summarized FVG data in a clear, tabular format. Key concepts include:
FVG Data Aggregation and Display
The panel is designed to show at-a-glance information about the closest active FVG mitigation levels. It doesn't calculate these FVGs itself but relies on the main script to provide this data. The panel is structured with columns for timeframes (TF), Bullish FVGs, and Bearish FVGs, and rows for "Current" (LTF), "MTF" (Medium Timeframe), and "HTF" (High Timeframe).
The `panelData` User-Defined Type (UDT)
To facilitate the transfer of information to be displayed, the library defines a UDT named `panelData`. This structure is central to the library's operation and is designed to hold all necessary values for populating the panel's data cells for each relevant FVG. Its fields include:
Price levels for the nearest bullish and bearish FVGs for LTF, MTF, and HTF (e.g., `nearestBullMitLvl`, `nearestMtfBearMitLvl`).
Boolean flags to indicate if these FVGs are classified as "Large Volume" (LV) (e.g., `isNearestBullLV`, `isNearestMtfBearLV`).
Color information for the background and text of each data cell, allowing for conditional styling based on the FVG's status or proximity (e.g., `ltfBullBgColor`, `mtfBearTextColor`).
The design of `panelData` allows the main script to prepare all display-related data and styling cues in one object, which is then passed to the `updatePanel` function for rendering. This separation of data preparation and display logic keeps the library focused on its presentation task.
Visual Cues and Formatting
Price Formatting: Price levels are formatted to match the instrument's minimum tick size using an internal `formatPrice` helper function, ensuring consistent and accurate display.
Large FVG Icon: If an FVG is marked as a "Large Volume" FVG in the `panelData` object, a user-specified icon (e.g., an emoji) is prepended to its price level in the panel, providing an immediate visual distinction.
Conditional Styling: The background and text colors for each FVG level displayed in the panel can be individually controlled via the `panelData` object, enabling the main script to implement custom styling rules (e.g., highlighting the overall nearest FVG across all timeframes).
Handling Missing Data: If no FVG data is available for a particular cell (i.e., the corresponding level in `panelData` is `na`), the panel displays "---" and uses a specified background color for "Not Available" cells.
█ CALCULATIONS AND USE
Using the `FvgPanel` typically involves a two-stage process: initialization and dynamic updates.
Step 1: Panel Creation
First, an instance of the panel table is created once, usually during the script's initial setup. This is done using the `createPanel` function.
Call `createPanel()` with parameters defining its position on the chart, border color, border width, header background color, header text color, and header text size.
This function initializes the table with three columns ("TF", "Bull FVG", "Bear FVG") and three data rows labeled "Current", "MTF", and "HTF", plus a header row.
Store the returned `table` object in a `var` variable to persist it across bars.
// Example:
var table infoPanel = na
if barstate.isfirst
infoPanel := panel.createPanel(
position.top_right,
color.gray,
1,
color.new(color.gray, 50),
color.white,
size.small
)
Step 2: Panel Updates
On each bar, or whenever the FVG data changes (typically on `barstate.islast` or `barstate.isrealtime` for efficiency), the panel's content needs to be refreshed. This is done using the `updatePanel` function.
Populate an instance of the `panelData` UDT with the latest FVG information. This includes setting the nearest bullish/bearish mitigation levels for LTF, MTF, and HTF, their LV status, and their desired background and text colors.
Call `updatePanel()`, passing the persistent `table` object (from Step 1), the populated `panelData` object, the icon string for LV FVGs, the default text color for FVG levels, the background color for "N/A" cells, and the general text size for the data cells.
The `updatePanel` function will then clear previous data and fill the table cells with the new values and styles provided in the `panelData` object.
// Example (inside a conditional block like 'if barstate.islast'):
var panelData fvgDisplayData = panelData.new()
// ... (logic to populate fvgDisplayData fields) ...
// fvgDisplayData.nearestBullMitLvl = ...
// fvgDisplayData.ltfBullBgColor = ...
// ... etc.
if not na(infoPanel)
panel.updatePanel(
infoPanel,
fvgDisplayData,
"🔥", // LV FVG Icon
color.white,
color.new(color.gray, 70), // NA Cell Color
size.small
)
This workflow ensures that the panel is drawn only once and its cells are efficiently updated as new data becomes available.
█ NOTES
Data Source: This library is solely responsible for the visual presentation of FVG data in a table. It does not perform any FVG detection or calculation. The calling script must compute or retrieve the FVG levels, LV status, and desired styling to populate the `panelData` object.
Styling Responsibility: While `updatePanel` applies colors passed via the `panelData` object, the logic for *determining* those colors (e.g., highlighting the closest FVG to the current price) resides in the calling script.
Performance: The library uses `table.cell()` to update individual cells, which is generally more efficient than deleting and recreating the table on each update. However, the frequency of `updatePanel` calls should be managed by the main script (e.g., using `barstate.islast` or `barstate.isrealtime`) to avoid excessive processing on historical bars.
`series float` Handling: The price level fields within the `panelData` UDT (e.g., `nearestBullMitLvl`) can accept `series float` values, as these are typically derived from price data. The internal `formatPrice` function correctly handles `series float` for display.
Dependencies: The `FvgPanel` itself is self-contained and does not import other user libraries. It uses standard Pine Script™ table and string functionalities.
█ EXPORTED TYPES
panelData
Represents the data structure for populating the FVG information panel.
Fields:
nearestBullMitLvl (series float) : The price level of the nearest bullish FVG's mitigation point (bottom for bull) on the LTF.
isNearestBullLV (series bool) : True if the nearest bullish FVG on the LTF is a Large Volume FVG.
ltfBullBgColor (series color) : Background color for the LTF bullish FVG cell in the panel.
ltfBullTextColor (series color) : Text color for the LTF bullish FVG cell in the panel.
nearestBearMitLvl (series float) : The price level of the nearest bearish FVG's mitigation point (top for bear) on the LTF.
isNearestBearLV (series bool) : True if the nearest bearish FVG on the LTF is a Large Volume FVG.
ltfBearBgColor (series color) : Background color for the LTF bearish FVG cell in the panel.
ltfBearTextColor (series color) : Text color for the LTF bearish FVG cell in the panel.
nearestMtfBullMitLvl (series float) : The price level of the nearest bullish FVG's mitigation point on the MTF.
isNearestMtfBullLV (series bool) : True if the nearest bullish FVG on the MTF is a Large Volume FVG.
mtfBullBgColor (series color) : Background color for the MTF bullish FVG cell.
mtfBullTextColor (series color) : Text color for the MTF bullish FVG cell.
nearestMtfBearMitLvl (series float) : The price level of the nearest bearish FVG's mitigation point on the MTF.
isNearestMtfBearLV (series bool) : True if the nearest bearish FVG on the MTF is a Large Volume FVG.
mtfBearBgColor (series color) : Background color for the MTF bearish FVG cell.
mtfBearTextColor (series color) : Text color for the MTF bearish FVG cell.
nearestHtfBullMitLvl (series float) : The price level of the nearest bullish FVG's mitigation point on the HTF.
isNearestHtfBullLV (series bool) : True if the nearest bullish FVG on the HTF is a Large Volume FVG.
htfBullBgColor (series color) : Background color for the HTF bullish FVG cell.
htfBullTextColor (series color) : Text color for the HTF bullish FVG cell.
nearestHtfBearMitLvl (series float) : The price level of the nearest bearish FVG's mitigation point on the HTF.
isNearestHtfBearLV (series bool) : True if the nearest bearish FVG on the HTF is a Large Volume FVG.
htfBearBgColor (series color) : Background color for the HTF bearish FVG cell.
htfBearTextColor (series color) : Text color for the HTF bearish FVG cell.
█ EXPORTED FUNCTIONS
createPanel(position, borderColor, borderWidth, headerBgColor, headerTextColor, headerTextSize)
Creates and initializes the FVG information panel (table). Sets up the header rows and timeframe labels.
Parameters:
position (simple string) : The position of the panel on the chart (e.g., position.top_right). Uses position.* constants.
borderColor (simple color) : The color of the panel's border.
borderWidth (simple int) : The width of the panel's border.
headerBgColor (simple color) : The background color for the header cells.
headerTextColor (simple color) : The text color for the header cells.
headerTextSize (simple string) : The text size for the header cells (e.g., size.small). Uses size.* constants.
Returns: The newly created table object representing the panel.
updatePanel(panelTable, data, lvIcon, defaultTextColor, naCellColor, textSize)
Updates the content of the FVG information panel with the latest FVG data.
Parameters:
panelTable (table) : The table object representing the panel to be updated.
data (panelData) : An object containing the FVG data to display.
lvIcon (simple string) : The icon (e.g., emoji) to display next to Large Volume FVGs.
defaultTextColor (simple color) : The default text color for FVG levels if not highlighted.
naCellColor (simple color) : The background color for cells where no FVG data is available ("---").
textSize (simple string) : The text size for the FVG level data (e.g., size.small).
Returns: _void

FvgCalculations█ OVERVIEW
This library provides the core calculation engine for identifying Fair Value Gaps (FVGs) across different timeframes and for processing their interaction with price. It includes functions to detect FVGs on both the current chart and higher timeframes, as well as to check for their full or partial mitigation.
█ CONCEPTS
The library's primary functions revolve around the concept of Fair Value Gaps and their lifecycle.
Fair Value Gap (FVG) Identification
An FVG, or imbalance, represents a price range where buying or selling pressure was significant enough to cause a rapid price movement, leaving an "inefficiency" in the market. This library identifies FVGs based on three-bar patterns:
Bullish FVG: Forms when the low of the current bar (bar 3) is higher than the high of the bar two periods prior (bar 1). The FVG is the space between the high of bar 1 and the low of bar 3.
Bearish FVG: Forms when the high of the current bar (bar 3) is lower than the low of the bar two periods prior (bar 1). The FVG is the space between the low of bar 1 and the high of bar 3.
The library provides distinct functions for detecting FVGs on the current (Low Timeframe - LTF) and specified higher timeframes (Medium Timeframe - MTF / High Timeframe - HTF).
FVG Mitigation
Mitigation refers to price revisiting an FVG.
Full Mitigation: An FVG is considered fully mitigated when price completely closes the gap. For a bullish FVG, this occurs if the current low price moves below or touches the FVG's bottom. For a bearish FVG, it occurs if the current high price moves above or touches the FVG's top.
Partial Mitigation (Entry/Fill): An FVG is partially mitigated when price enters the FVG's range but does not fully close it. The library tracks the extent of this fill. For a bullish FVG, if the current low price enters the FVG from above, that low becomes the new effective top of the remaining FVG. For a bearish FVG, if the current high price enters the FVG from below, that high becomes the new effective bottom of the remaining FVG.
FVG Interaction
This refers to any instance where the current bar's price range (high to low) touches or crosses into the currently unfilled portion of an active (visible and not fully mitigated) FVG.
Multi-Timeframe Data Acquisition
To detect FVGs on higher timeframes, specific historical bar data (high, low, and time of bars at indices and relative to the higher timeframe's last completed bar) is required. The requestMultiTFBarData function is designed to fetch this data efficiently.
█ CALCULATIONS AND USE
The functions in this library are typically used in a sequence to manage FVGs:
1. Data Retrieval (for MTF/HTF FVGs):
Call requestMultiTFBarData() with the desired higher timeframe string (e.g., "60", "D").
This returns a tuple of htfHigh1, htfLow1, htfTime1, htfHigh3, htfLow3, htfTime3.
2. FVG Detection:
For LTF FVGs: Call detectFvg() on each confirmed bar. It uses high , low, low , and high along with barstate.isconfirmed.
For MTF/HTF FVGs: Call detectMultiTFFvg() using the data obtained from requestMultiTFBarData().
Both detection functions return an fvgObject (defined in FvgTypes) if an FVG is found, otherwise na. They also can classify FVGs as "Large Volume" (LV) if classifyLV is true and the FVG size (top - bottom) relative to the tfAtr (Average True Range of the respective timeframe) meets the lvAtrMultiplier.
3. FVG State Updates (on each new bar for existing FVGs):
First, check for overall price interaction using fvgInteractionCheck(). This function determines if the current bar's high/low has touched or entered the FVG's currentTop or currentBottom.
If interaction occurs and the FVG is not already mitigated:
Call checkMitigation() to determine if the FVG has been fully mitigated by the current bar's currentHigh and currentLow. If true, the FVG's isMitigated status is updated.
If not fully mitigated, call checkPartialMitigation() to see if the price has further entered the FVG. This function returns the newLevel to which the FVG has been filled (e.g., currentLow for a bullish FVG, currentHigh for bearish). This newLevel is then used to update the FVG's currentTop or currentBottom.
The calling script (e.g., fvgMain.c) is responsible for storing and managing the array of fvgObject instances and passing them to these update functions.
█ NOTES
Bar State for LTF Detection: The detectFvg() function relies on barstate.isconfirmed to ensure FVG detection is based on closed bars, preventing FVGs from being detected prematurely on the currently forming bar.
Higher Timeframe Data (lookahead): The requestMultiTFBarData() function uses lookahead = barmerge.lookahead_on. This means it can access historical data from the higher timeframe that corresponds to the current bar on the chart, even if the higher timeframe bar has not officially closed. This is standard for multi-timeframe analysis aiming to plot historical HTF data accurately on a lower timeframe chart.
Parameter Typing: Functions like detectMultiTFFvg and detectFvg infer the type for boolean (classifyLV) and numeric (lvAtrMultiplier) parameters passed from the main script, while explicitly typed series parameters (like htfHigh1, currentAtr) expect series data.
fvgObject Dependency: The FVG detection functions return fvgObject instances, and fvgInteractionCheck takes an fvgObject as a parameter. This UDT is defined in the FvgTypes library, making it a dependency for using FvgCalculations.
ATR for LV Classification: The tfAtr (for MTF/HTF) and currentAtr (for LTF) parameters are expected to be the Average True Range values for the respective timeframes. These are used, if classifyLV is enabled, to determine if an FVG's size qualifies it as a "Large Volume" FVG based on the lvAtrMultiplier.
MTF/HTF FVG Appearance Timing: When displaying FVGs from a higher timeframe (MTF/HTF) on a lower timeframe (LTF) chart, users might observe that the most recent MTF/HTF FVG appears one LTF bar later compared to its appearance on a native MTF/HTF chart. This is an expected behavior due to the detection mechanism in `detectMultiTFFvg`. This function uses historical bar data from the MTF/HTF (specifically, data equivalent to `HTF_bar ` and `HTF_bar `) to identify an FVG. Therefore, all three bars forming the FVG on the MTF/HTF must be fully closed and have shifted into these historical index positions relative to the `request.security` call from the LTF chart before the FVG can be detected and displayed on the LTF. This ensures that the MTF/HTF FVG is identified based on confirmed, closed bars from the higher timeframe.
█ EXPORTED FUNCTIONS
requestMultiTFBarData(timeframe)
Requests historical bar data for specific previous bars from a specified higher timeframe.
It fetches H , L , T (for the bar before last) and H , L , T (for the bar three periods prior)
from the requested timeframe.
This is typically used to identify FVG patterns on MTF/HTF.
Parameters:
timeframe (simple string) : The higher timeframe to request data from (e.g., "60" for 1-hour, "D" for Daily).
Returns: A tuple containing: .
- htfHigh1 (series float): High of the bar at index 1 (one bar before the last completed bar on timeframe).
- htfLow1 (series float): Low of the bar at index 1.
- htfTime1 (series int) : Time of the bar at index 1.
- htfHigh3 (series float): High of the bar at index 3 (three bars before the last completed bar on timeframe).
- htfLow3 (series float): Low of the bar at index 3.
- htfTime3 (series int) : Time of the bar at index 3.
detectMultiTFFvg(htfHigh1, htfLow1, htfTime1, htfHigh3, htfLow3, htfTime3, tfAtr, classifyLV, lvAtrMultiplier, tfType)
Detects a Fair Value Gap (FVG) on a higher timeframe (MTF/HTF) using pre-fetched bar data.
Parameters:
htfHigh1 (float) : High of the first relevant bar (typically high ) from the higher timeframe.
htfLow1 (float) : Low of the first relevant bar (typically low ) from the higher timeframe.
htfTime1 (int) : Time of the first relevant bar (typically time ) from the higher timeframe.
htfHigh3 (float) : High of the third relevant bar (typically high ) from the higher timeframe.
htfLow3 (float) : Low of the third relevant bar (typically low ) from the higher timeframe.
htfTime3 (int) : Time of the third relevant bar (typically time ) from the higher timeframe.
tfAtr (float) : ATR value for the higher timeframe, used for Large Volume (LV) FVG classification.
classifyLV (bool) : If true, FVGs will be assessed to see if they qualify as Large Volume.
lvAtrMultiplier (float) : The ATR multiplier used to define if an FVG is Large Volume.
tfType (series tfType enum from no1x/FvgTypes/1) : The timeframe type (e.g., types.tfType.MTF, types.tfType.HTF) of the FVG being detected.
Returns: An fvgObject instance if an FVG is detected, otherwise na.
detectFvg(classifyLV, lvAtrMultiplier, currentAtr)
Detects a Fair Value Gap (FVG) on the current (LTF - Low Timeframe) chart.
Parameters:
classifyLV (bool) : If true, FVGs will be assessed to see if they qualify as Large Volume.
lvAtrMultiplier (float) : The ATR multiplier used to define if an FVG is Large Volume.
currentAtr (float) : ATR value for the current timeframe, used for LV FVG classification.
Returns: An fvgObject instance if an FVG is detected, otherwise na.
checkMitigation(isBullish, fvgTop, fvgBottom, currentHigh, currentLow)
Checks if an FVG has been fully mitigated by the current bar's price action.
Parameters:
isBullish (bool) : True if the FVG being checked is bullish, false if bearish.
fvgTop (float) : The top price level of the FVG.
fvgBottom (float) : The bottom price level of the FVG.
currentHigh (float) : The high price of the current bar.
currentLow (float) : The low price of the current bar.
Returns: True if the FVG is considered fully mitigated, false otherwise.
checkPartialMitigation(isBullish, currentBoxTop, currentBoxBottom, currentHigh, currentLow)
Checks for partial mitigation of an FVG by the current bar's price action.
It determines if the price has entered the FVG and returns the new fill level.
Parameters:
isBullish (bool) : True if the FVG being checked is bullish, false if bearish.
currentBoxTop (float) : The current top of the FVG box (this might have been adjusted by previous partial fills).
currentBoxBottom (float) : The current bottom of the FVG box (similarly, might be adjusted).
currentHigh (float) : The high price of the current bar.
currentLow (float) : The low price of the current bar.
Returns: The new price level to which the FVG has been filled (e.g., currentLow for a bullish FVG).
Returns na if no new partial fill occurred on this bar.
fvgInteractionCheck(fvg, highVal, lowVal)
Checks if the current bar's price interacts with the given FVG.
Interaction means the price touches or crosses into the FVG's
current (possibly partially filled) range.
Parameters:
fvg (fvgObject type from no1x/FvgTypes/1) : The FVG object to check.
Its isMitigated, isVisible, isBullish, currentTop, and currentBottom fields are used.
highVal (float) : The high price of the current bar.
lowVal (float) : The low price of the current bar.
Returns: True if price interacts with the FVG, false otherwise.

FvgTypes█ OVERVIEW
This library serves as a foundational module for Pine Script™ projects focused on Fair Value Gaps (FVGs). Its primary purpose is to define and centralize custom data structures (User-Defined Types - UDTs) and enumerations that are utilized across various components of an FVG analysis system. By providing standardized types for FVG characteristics and drawing configurations, it promotes code consistency, readability, and easier maintenance within a larger FVG indicator or strategy.
█ CONCEPTS
The library introduces several key data structures (User-Defined Types - UDTs) and an enumeration to organize Fair Value Gap (FVG) related data logically. These types are central to the functioning of FVG analysis tools built upon this library.
Timeframe Categorization (`tfType` Enum)
To manage and differentiate FVGs based on their timeframe of origin, the `tfType` enumeration is defined. It includes:
`LTF`: Low Timeframe (typically the current chart).
`MTF`: Medium Timeframe.
`HTF`: High Timeframe.
This allows for distinct logic and visual settings to be applied depending on the FVG's source timeframe.
FVG Data Encapsulation (`fvgObject` UDT)
The `fvgObject` is a comprehensive UDT designed to encapsulate all pertinent information and state for an individual Fair Value Gap throughout its lifecycle. Instead of listing every field, its conceptual structure can be understood as holding:
Core Definition: The FVG's fundamental price levels (top, bottom) and its formation time (`startTime`).
Classification Attributes: Characteristics such as its direction (`isBullish`) and whether it qualifies as a Large Volume FVG (`isLV`), along with its originating timeframe category (`tfType`).
Lifecycle State: Current status indicators including full mitigation (`isMitigated`, `mitigationTime`), partial fill levels (`currentTop`, `currentBottom`), midline interaction (`isMidlineTouched`), and overall visibility (`isVisible`).
Drawing Identifiers: References (`boxId`, `midLineId`, `mitLineLabelId`, etc.) to the actual graphical objects drawn on the chart to represent the FVG and its components.
Optimization Cache: Previous-bar state values (`prevIsMitigated`, `prevCurrentTop`, etc.) crucial for optimizing drawing updates by avoiding redundant operations.
This comprehensive structure facilitates easy access to all FVG-related information through a single object, reducing code complexity and improving manageability.
Drawing Configuration (`drawSettings` UDT)
The `drawSettings` UDT centralizes all user-configurable parameters that dictate the visual appearance of FVGs across different timeframes. It's typically populated from script inputs and conceptually groups settings for:
General Behavior: Global FVG classification toggles (e.g., `shouldClassifyLV`) and general display rules (e.g., `shouldHideMitigated`).
FVG Type Specific Colors: Colors for standard and Large Volume FVGs, both active and mitigated (e.g., `lvBullColor`, `mitigatedBearBoxColor`).
Timeframe-Specific Visuals (LTF, MTF, HTF): Detailed parameters for each timeframe category, covering FVG boxes (visibility, colors, extension, borders, labels), midlines (visibility, style, color), and mitigation lines (visibility, style, color, labels, persistence after mitigation).
Contextual Information: The current bar's time (`currentTime`) for accurate positioning of time-dependent drawing elements and timeframe display strings (`tfString`, `mtfTfString`, `htfTfString`).
This centralized approach allows for extensive customization of FVG visuals and simplifies the management of drawing parameters within the main script. Such centralization also enhances the maintainability of the visual aspects of the FVG system.
█ NOTES
User-Defined Types (UDTs): This library extensively uses UDTs (`fvgObject`, `drawSettings`) to group related data. This improves code organization and makes it easier to pass complex data between functions and libraries.
Mutability and Reference Behavior of UDTs: When UDT instances are passed to functions or methods in other libraries (like `fvgObjectLib`), those functions might modify the fields of the passed object if they are not explicitly designed to return new instances. This is because UDTs are passed by reference and are mutable in Pine Script™. Users should be aware of this standard behavior to prevent unintended side effects.
Optimization Fields: The `prev_*` fields in `fvgObject` are crucial for performance optimization in the drawing logic. They help avoid unnecessary redrawing of FVG elements if their state or relevant settings haven't changed.
No Direct Drawing Logic: `FvgTypes` itself does not contain any drawing logic. It solely defines the data structures. The actual drawing and manipulation of these objects are handled by other libraries (e.g., `fvgObjectLib`).
Centralized Definitions: By defining these types in a separate library, any changes to the structure of FVG data or settings can be made in one place, ensuring consistency across all dependent scripts and libraries.
█ EXPORTED TYPES
fvgObject
fvgObject Represents a Fair Value Gap (FVG) object.
Fields:
top (series float) : The top price level of the FVG.
bottom (series float) : The bottom price level of the FVG.
startTime (series int) : The start time (timestamp) of the bar where the FVG formed.
isBullish (series bool) : Indicates if the FVG is bullish (true) or bearish (false).
isLV (series bool) : Indicates if the FVG is a Large Volume FVG.
tfType (series tfType) : The timeframe type (LTF, MTF, HTF) to which this FVG belongs.
isMitigated (series bool) : Indicates if the FVG has been fully mitigated.
mitigationTime (series int) : The time (timestamp) when the FVG was mitigated.
isVisible (series bool) : The current visibility status of the FVG, typically managed by drawing logic based on filters.
isMidlineTouched (series bool) : Indicates if the price has touched the FVG's midline (50% level).
currentTop (series float) : The current top level of the FVG after partial fills.
currentBottom (series float) : The current bottom level of the FVG after partial fills.
boxId (series box) : The drawing ID for the main FVG box.
mitigatedBoxId (series box) : The drawing ID for the box representing the partially filled (mitigated) area.
midLineId (series line) : The drawing ID for the FVG's midline.
mitLineId (series line) : The drawing ID for the FVG's mitigation line.
boxLabelId (series label) : The drawing ID for the FVG box label.
mitLineLabelId (series label) : The drawing ID for the mitigation line label.
testedBoxId (series box) : The drawing ID for the box of a fully mitigated (tested) FVG, if kept visible.
keptMitLineId (series line) : The drawing ID for a mitigation line that is kept after full mitigation.
prevIsMitigated (series bool) : Stores the isMitigated state from the previous bar for optimization.
prevCurrentTop (series float) : Stores the currentTop value from the previous bar for optimization.
prevCurrentBottom (series float) : Stores the currentBottom value from the previous bar for optimization.
prevIsVisible (series bool) : Stores the visibility status from the previous bar for optimization (derived from isVisibleNow passed to updateDrawings).
prevIsMidlineTouched (series bool) : Stores the isMidlineTouched status from the previous bar for optimization.
drawSettings
drawSettings A structure containing settings for drawing FVGs.
Fields:
shouldClassifyLV (series bool) : Whether to classify FVGs as Large Volume (LV) based on ATR.
shouldHideMitigated (series bool) : Whether to hide FVG boxes once they are fully mitigated.
currentTime (series int) : The current bar's time, used for extending drawings.
lvBullColor (series color) : Color for Large Volume Bullish FVGs.
mitigatedLvBullColor (series color) : Color for mitigated Large Volume Bullish FVGs.
lvBearColor (series color) : Color for Large Volume Bearish FVGs.
mitigatedLvBearColor (series color) : Color for mitigated Large Volume Bearish FVGs.
shouldShowBoxes (series bool) : Whether to show FVG boxes for the LTF.
bullBoxColor (series color) : Color for LTF Bullish FVG boxes.
mitigatedBullBoxColor (series color) : Color for mitigated LTF Bullish FVG boxes.
bearBoxColor (series color) : Color for LTF Bearish FVG boxes.
mitigatedBearBoxColor (series color) : Color for mitigated LTF Bearish FVG boxes.
boxLengthBars (series int) : Length of LTF FVG boxes in bars (if not extended).
shouldExtendBoxes (series bool) : Whether to extend LTF FVG boxes to the right.
shouldShowCurrentTfBoxLabels (series bool) : Whether to show labels on LTF FVG boxes.
shouldShowBoxBorder (series bool) : Whether to show a border for LTF FVG boxes.
boxBorderWidth (series int) : Border width for LTF FVG boxes.
boxBorderStyle (series string) : Border style for LTF FVG boxes (e.g., line.style_solid).
boxBorderColor (series color) : Border color for LTF FVG boxes.
shouldShowMidpoint (series bool) : Whether to show the midline (50% level) for LTF FVGs.
midLineWidthInput (series int) : Width of the LTF FVG midline.
midpointLineStyleInput (series string) : Style of the LTF FVG midline.
midpointColorInput (series color) : Color of the LTF FVG midline.
shouldShowMitigationLine (series bool) : Whether to show the mitigation line for LTF FVGs.
(Line always extends if shown)
mitLineWidthInput (series int) : Width of the LTF FVG mitigation line.
mitigationLineStyleInput (series string) : Style of the LTF FVG mitigation line.
mitigationLineColorInput (series color) : Color of the LTF FVG mitigation line.
shouldShowCurrentTfMitLineLabels (series bool) : Whether to show labels on LTF FVG mitigation lines.
currentTfMitLineLabelOffsetX (series float) : The horizontal offset value for the LTF mitigation line's label.
shouldKeepMitigatedLines (series bool) : Whether to keep showing mitigation lines of fully mitigated LTF FVGs.
mitigatedMitLineColor (series color) : Color for kept mitigation lines of mitigated LTF FVGs.
tfString (series string) : Display string for the LTF (e.g., "Current TF").
shouldShowMtfBoxes (series bool) : Whether to show FVG boxes for the MTF.
mtfBullBoxColor (series color) : Color for MTF Bullish FVG boxes.
mtfMitigatedBullBoxColor (series color) : Color for mitigated MTF Bullish FVG boxes.
mtfBearBoxColor (series color) : Color for MTF Bearish FVG boxes.
mtfMitigatedBearBoxColor (series color) : Color for mitigated MTF Bearish FVG boxes.
mtfBoxLengthBars (series int) : Length of MTF FVG boxes in bars (if not extended).
shouldExtendMtfBoxes (series bool) : Whether to extend MTF FVG boxes to the right.
shouldShowMtfBoxLabels (series bool) : Whether to show labels on MTF FVG boxes.
shouldShowMtfBoxBorder (series bool) : Whether to show a border for MTF FVG boxes.
mtfBoxBorderWidth (series int) : Border width for MTF FVG boxes.
mtfBoxBorderStyle (series string) : Border style for MTF FVG boxes.
mtfBoxBorderColor (series color) : Border color for MTF FVG boxes.
shouldShowMtfMidpoint (series bool) : Whether to show the midline for MTF FVGs.
mtfMidLineWidthInput (series int) : Width of the MTF FVG midline.
mtfMidpointLineStyleInput (series string) : Style of the MTF FVG midline.
mtfMidpointColorInput (series color) : Color of the MTF FVG midline.
shouldShowMtfMitigationLine (series bool) : Whether to show the mitigation line for MTF FVGs.
(Line always extends if shown)
mtfMitLineWidthInput (series int) : Width of the MTF FVG mitigation line.
mtfMitigationLineStyleInput (series string) : Style of the MTF FVG mitigation line.
mtfMitigationLineColorInput (series color) : Color of the MTF FVG mitigation line.
shouldShowMtfMitLineLabels (series bool) : Whether to show labels on MTF FVG mitigation lines.
mtfMitLineLabelOffsetX (series float) : The horizontal offset value for the MTF mitigation line's label.
shouldKeepMtfMitigatedLines (series bool) : Whether to keep showing mitigation lines of fully mitigated MTF FVGs.
mtfMitigatedMitLineColor (series color) : Color for kept mitigation lines of mitigated MTF FVGs.
mtfTfString (series string) : Display string for the MTF (e.g., "MTF").
shouldShowHtfBoxes (series bool) : Whether to show FVG boxes for the HTF.
htfBullBoxColor (series color) : Color for HTF Bullish FVG boxes.
htfMitigatedBullBoxColor (series color) : Color for mitigated HTF Bullish FVG boxes.
htfBearBoxColor (series color) : Color for HTF Bearish FVG boxes.
htfMitigatedBearBoxColor (series color) : Color for mitigated HTF Bearish FVG boxes.
htfBoxLengthBars (series int) : Length of HTF FVG boxes in bars (if not extended).
shouldExtendHtfBoxes (series bool) : Whether to extend HTF FVG boxes to the right.
shouldShowHtfBoxLabels (series bool) : Whether to show labels on HTF FVG boxes.
shouldShowHtfBoxBorder (series bool) : Whether to show a border for HTF FVG boxes.
htfBoxBorderWidth (series int) : Border width for HTF FVG boxes.
htfBoxBorderStyle (series string) : Border style for HTF FVG boxes.
htfBoxBorderColor (series color) : Border color for HTF FVG boxes.
shouldShowHtfMidpoint (series bool) : Whether to show the midline for HTF FVGs.
htfMidLineWidthInput (series int) : Width of the HTF FVG midline.
htfMidpointLineStyleInput (series string) : Style of the HTF FVG midline.
htfMidpointColorInput (series color) : Color of the HTF FVG midline.
shouldShowHtfMitigationLine (series bool) : Whether to show the mitigation line for HTF FVGs.
(Line always extends if shown)
htfMitLineWidthInput (series int) : Width of the HTF FVG mitigation line.
htfMitigationLineStyleInput (series string) : Style of the HTF FVG mitigation line.
htfMitigationLineColorInput (series color) : Color of the HTF FVG mitigation line.
shouldShowHtfMitLineLabels (series bool) : Whether to show labels on HTF FVG mitigation lines.
htfMitLineLabelOffsetX (series float) : The horizontal offset value for the HTF mitigation line's label.
shouldKeepHtfMitigatedLines (series bool) : Whether to keep showing mitigation lines of fully mitigated HTF FVGs.
htfMitigatedMitLineColor (series color) : Color for kept mitigation lines of mitigated HTF FVGs.
htfTfString (series string) : Display string for the HTF (e.g., "HTF").

ICT HTF Candles [Pro] (fadi)The ICT HTF Candles shows you multi-timeframe price action by plotting up to six higher timeframe candles on your chart, scaled to real price levels. Set candle counts per timeframe or toggle them off for a clean view, saving you time switching between charts. This helps you spot trends and reversals quickly, align trades with the market’s direction, and time setups like sweeps or bounces better. From scalping on the 1m to swinging on the 4H, it simplifies ICT and Smart Money Concepts (SMC), revealing trend shifts and institutional moves clearly. Once you use it, trading without this clarity just won’t feel right.
Key Features:
In-Depth Price Action Levels
These levels track ICT PD arrays and confluences across timeframes, making it easy to see how price action flows from higher timeframes and what your setup faces. Is your 5m trade about to run into a 1H bearish order block? Did it bounce off a higher timeframe FVG and create an SMT with a correlated asset? They make your chart a clear roadmap to market structure, helping you find strong setups, save time, and align with institutional moves:
Change in State of Delivery (CISD): In ICT trading, CISD marks potential reversal levels on each timeframe by showing the open of the highest series of up (green) candles for a bullish shift or the open of the lowest series of down (red) candles for a bearish shift. These levels are set at the opening price of the first candle in those runs, highlighting where the market turns. The indicator makes these levels easy to spot across timeframes, so you can track reversal points clearly. You can set your own confirmation criteria—a close or wick above/below the CISD line (bearish/bullish) or a close or wick above/below the high/low—to verify the CISD level cross. When confirmed, there is a high probability that we have a change in trend, and a reversal order block forms. CISD helps you track these reversal levels and confirm market shifts, making multi-timeframe analysis straightforward.
Order Blocks: When a CISD level cross is confirmed, the price is now below a series of up (green) candles or above a series of down (red) candles, marking these candles as order blocks that usually support the new trend direction. The indicator shows these levels clearly across timeframes, making it easy to spot high-probability reversal or consolidation areas. Keep in mind that price may sometimes move to mitigate an imbalance, so use your best judgment based on your multi-timeframe analysis to confirm they meet your trading criteria.
Trend Bias: Traders often struggle figuring out market bias—guessing the trend wrong, losing on trades against the flow, or missing how lower and higher timeframes line up. The Trend Bias feature tracks order blocks and change in state of delivery, displaying bullish or bearish trends for each timeframe to help you choose trades that go with the market’s direction. The indicator shows these trends clearly across timeframes, so you can quickly see if the 5m matches the 1H or if you’re going against the bigger trend. This makes it easier to avoid bad trades and make decisions faster, keeping you on track with setups that follow the main trend.
Immediate Rebalance: When looking at price action, you’ll see the market doesn’t usually leave behind many Fair Value Gaps (FVGs). That’s because the market is efficient and always rebalancing any inefficiencies. When the market starts a strong move, the last candle will usually close above the previous candle high (for up moves) or below the low (for down moves). At this point, the market will do one of two things: immediately rebalance by retracing first, or have a small retracement but leave behind an FVG. The Immediate Rebalance feature tracks rebalance levels across multiple timeframes, clearly showing where price rebalances. This helps traders have a better expectation of how the market may need to retrace and anticipate Power of Three (PO3) setups by being ready for a Judas swing to rebalance the imbalance.
Fair Value Gaps and Volume Imbalances: If the market fails to immediately rebalance, it will usually attempt to come back and rebalance it at a later time. FVGs and VIs give you a clear area where the price might be heading if it starts breaking structure on lower timeframes. These inefficiencies—price gaps (FVGs) or aggressive moves (VIs)—show where the market’s working to fix imbalances. The Fair Value Gaps and Volume Imbalances feature tracks these levels across timeframes.
Previous Candle Levels: The Previous Candle Levels feature marks the high, low, and middle of the prior candle on each timeframe, helping you identify key price levels for sweeps, bounces, or breakouts. It tracks the candle’s high and low as its extremes and the middle as the 50% mark, which you can set to calculate using the high-to-low range or the open-to-close range. These levels can provide tradable setups on lower timeframes.
Smart Money Techniques (SMT): What’s an ICT indicator without an SMT feature to track cracks in correlated assets? The ICT HTF Candles monitors your chosen correlated assets, like EUR/USD and GBP/USD or SQ and NQ, for signs of strength or weakness to use as confluence with other features and build the case for A+ setups. The SMT feature spots divergences when one asset makes a higher high or lower low while the other doesn’t follow, hinting at potential reversals or market shifts. It tests SMT using two immediate candles, since higher timeframes (HTFs) create larger gaps on lower timeframes. Traders can easily see these divergence levels, like a 15m SMT lining up with a 1H order block or CISD, helping you confirm high-probability setups and strengthen trade entries with multi-timeframe confluence.

FVG Candle HighlighterThis indicator highlights only the true Fair Value Gap (FVG) creator candle — the middle candle in a 3-bar FVG formation — with zero clutter.
🔹 Bullish FVG: Candle is colored if price gaps above the high two bars back
🔹 Bearish FVG: Candle is colored if price gaps below the low two bars back
✨ No boxes. No zones. Just pure, visual price-action accuracy.
🔧 Powered by Pine Script v6
🧠 Based on institutional-style FVG logic
🎯 Ideal for Smart Money / ICT / Order Block strategies

Balanced Price Range | Flux Charts💎 GENERAL OVERVIEW
Introducing our new Balanced Price Range (BPR) indicator! A Balanced Price Range is a trading concept used by price action traders. It is detected by finding overlapping area between two contrary Fair Value Gaps (FVGs). These areas can be used as entry points during market pullbacks. For more information about the process, please check the "HOW DOES IT WORK ?" section.
Balanced Price Range Features :
Balanced Price Range Detection : Identifies areas where bullish and bearish FVGs overlap, suggesting a zone of price equilibrium.
Customizable FVG & BPR Detection : You can fine-tune FVG detection and sensitivity for BPR detection to your liking.
Retest Labels : Bullish & Bearish retest labels will be rendered for BPRs.
Alerts : You can set alerts for Bullish & Bearish BPR detection and their retests.
🚩 UNIQUENESS
This indicator doesn't just detect standard FVGs but specifically looks for areas where bullish and bearish IFVGs (Invalidated Fair Value Gaps) overlap, defining a Balanced Price Range. It also actively manages and updates identified BPR zones, removing them when they are invalidated or remain untouched for a specified period. It highlights and alerts users to retests of established BPR zones, signaling potential trading opportunities. Users can tailor the appearance of the BPR zones and retest markers, as well as configure specific alerts for new BPR formations and retests.
📌 HOW DOES IT WORK ?
A Fair Value Gap generally occur when there is an imbalance in the market. They can be detected by specific formations within the chart. The indicator first detects bullish & bearish FVG zones according to their formations on chart. Then, they are dynamically tracked and flagged as invalidated if the price crosses them, turning them into IFVGs. When a FVG & IFVG of the same type overlaps, the indicator combines them into a single BPR of corresponding type. The detected BPR is updated as new data comes in, and renders retests labels as they occur. A bullish BPR can be used to find long trade entry opportunities, while a bearish BPR can be used to find short trade entry opportunities. Retests can also indicate potential movements in the corresponding direction of the BPR. Users can set-up alerts for BPR detection & BPR retests and will get notified as they occur.
⚙️ SETTINGS
Show Historic Zones: If enabled, invalidated or expired BPR zones will remain visible on the chart.
Balanced Price Range:
FVG Detection Method: Determines the criteria for the bar types forming the initial FVG.
Same: All three bars forming the FVG must be of the same type (all bullish or all bearish).
Mixed: The bar types must vary (a mix of bullish and bearish bars).
All: Bar types can vary or be the same.
FVG Invalidation Method: Determines which part of the candle (wick or close) invalidates the initial FVG.
BPR Invalidation Method: Determines which part of the candle (wick or close) invalidates the Balanced Price Range.
Sensitivity: Adjusts the sensitivity of FVG detection. Higher values may identify fewer, larger BPRs, while lower values may detect more, smaller BPRs.
Labels: Toggles the display of text labels on the identified zones.
Retests: Enables or disables the detection and visualization of BPR retests.

Higher Timeframe Candles (Dynamic Display)Key Features:
1. Higher Timeframe Candles Visualization:
Displays up to 5 candles from a user-selected higher timeframe (e.g., 15-minute, hourly).
Each candle includes:
Body (open-close range) and wicks (high-low range).
Customizable appearance settings for width, colors, and transparency.
2. Horizontal Price Levels:
Calculates and plots important levels based on the higher timeframe candles:
Max High: Highest price among the displayed candles.
Min Low: Lowest price among the displayed candles.
Midpoint: The midpoint between Max High and Min Low.
Quarter Points: 25% and 75% levels within the Max-Min range.
Each level's line appearance (color, width, style) can be customized, and price labels can be displayed.
3. Fair Value Gaps (FVG):
Detects bullish and bearish fair value gaps (FVGs) based on three consecutive candles:
Bullish FVG: Middle candle's low is higher than the previous candle's high.
Bearish FVG: Middle candle's high is lower than the previous candle's low.
Highlights FVGs with colored boxes and optional labels showing gap height.
4. Inside/Outside Bar Detection:
Identifies inside bars (current candle is entirely within the previous candle) and outside bars (current candle exceeds the previous candle's range).
Labels these patterns above the candles for easy identification.
5. Alerts for Key Levels:
Alerts are triggered when the current price crosses:
Max High
Min Low
Midpoint
Alerts help traders act without monitoring the chart constantly.
6. Customization Options:
Fully customizable input options for candles, levels, FVGs, and labels:
Appearance settings: Colors, widths, styles, transparency.
Toggle visibility for specific features (e.g., FVGs, labels, quarter points).
Label precision and positioning.

Time-Based Fair Value Gaps (FVG) with Inversions (iFVG)Overview
The Time-Based Fair Value Gaps (FVG) with Inversions (iFVG) (ICT/SMT) indicator is a specialized tool designed for traders using Inner Circle Trader (ICT) methodologies. Inspired by LuxAlgo's Fair Value Gap indicator, this script introduces significant enhancements by integrating ICT principles, focusing on precise time-based FVG detection, inversion tracking, and retest signals tailored for institutional trading strategies. Unlike LuxAlgo’s general FVG approach, this indicator filters FVGs within customizable 10-minute windows aligned with ICT’s macro timeframes and incorporates ICT-specific concepts like mitigation, liquidity grabs, and session-based gap prioritization.
This tool is optimized for 1–5 minute charts, though probably best for 1 minute charts, identifying bullish and bearish FVGs, tracking their mitigation into inverted FVGs (iFVGs) as key support/resistance zones, and generating retest signals with customizable “Close” or “Wick” confirmation. Features like ATR-based filtering, optional FVG labels, mitigation removal, and session-specific FVG detection (e.g., first FVG in AM/PM sessions) make it a powerful tool for ICT traders.
Originality and Improvements
While inspired by LuxAlgo’s FVG indicator (credit to LuxAlgo for their foundational work), this script significantly extends the original concept by:
1. Time-Based FVG Detection: Unlike LuxAlgo’s continuous FVG identification, this script filters FVGs within user-defined 10-minute windows each hour (:00–:10, :10–:20, etc.), aligning with ICT’s emphasis on specific periods of institutional activity, such as hourly opens/closes or kill zones (e.g., New York 7:00–11:00 AM EST). This ensures FVGs are relevant to high-probability ICT setups.
2. Session-Specific First FVG Option: A unique feature allows traders to display only the first FVG in ICT-defined AM (9:30–10:00 AM EST) or PM (1:30–2:00 PM EST) sessions, reflecting ICT’s focus on initial market imbalances during key liquidity events.
3. ICT-Driven Mitigation and Inversion Logic: The script tracks FVG mitigation (when price closes through a gap) and converts mitigated FVGs into iFVGs, which serve as ICT-style support/resistance zones. This aligns with ICT’s view that mitigated gaps become critical reversal points, unlike LuxAlgo’s simpler gap display.
4. Customizable Retest Signals: Retest signals for iFVGs are configurable for “Close” (conservative, requiring candle body confirmation) or “Wick” (faster, using highs/lows), catering to ICT traders’ need for precise entry timing during liquidity grabs or Judas swings.
5. ATR Filtering and Mitigation Removal: An optional ATR filter ensures only significant FVGs are displayed, reducing noise, while mitigation removal declutters the chart by removing filled gaps, aligning with ICT’s principle that mitigated gaps lose relevance unless inverted.
6. Timezone and Timeframe Safeguards: A timezone offset setting aligns FVG detection with EST for ICT’s New York-centric strategies, and a timeframe warning alerts users to avoid ≥1-hour charts, ensuring accuracy in time-based filtering.
These enhancements make the script a distinct tool that builds on LuxAlgo’s foundation while offering ICT traders a tailored, high-precision solution.
How It Works
FVG Detection
FVGs are identified when a candle’s low is higher than the high of two candles prior (bullish FVG) or a candle’s high is lower than the low of two candles prior (bearish FVG). Detection is restricted to:
• User-selected 10-minute windows (e.g., :00–:10, :50–:60) to capture ICT-relevant periods like hourly transitions.
• AM/PM session first FVGs (if enabled), focusing on 9:30–10:00 AM or 1:30–2:00 PM EST for key market opens.
An optional ATR filter (default: 0.25× ATR) ensures only gaps larger than the threshold are displayed, prioritizing significant imbalances.
Mitigation and Inversion
When price closes through an FVG (e.g., below a bullish FVG’s bottom), the FVG is mitigated and becomes an iFVG, plotted as a support/resistance zone. iFVGs are critical in ICT for identifying reversal points where institutional orders accumulate.
Retest Signals
The script generates signals when price retests an iFVG:
• Close: Triggers when the candle body confirms the retest (conservative, lower noise).
• Wick: Triggers when the candle’s high/low touches the iFVG (faster, higher sensitivity). Signals are visualized with triangular markers (▲ for bullish, ▼ for bearish) and can trigger alerts.
Visualization
• FVGs: Displayed as colored boxes (green for bullish, red for bearish) with optional “Bull FVG”/“Bear FVG” labels.
• iFVGs: Shown as extended boxes with dashed midlines, limited to the user-defined number of recent zones (default: 5).
• Mitigation Removal: Mitigated FVGs/iFVGs are removed (if enabled) to keep the chart clean.
How to Use
Recommended Settings
• Timeframe: Use 1–5 minute charts for precision, avoiding ≥1-hour timeframes (a warning label appears if misconfigured).
• Time Windows: Enable :00–:10 and :50–:60 for hourly open/close FVGs, or use the “Show only 1st presented FVG” option for AM/PM session focus.
• ATR Filter: Keep enabled (multiplier 0.25–0.5) for significant gaps; disable on 1-minute charts for more FVGs during volatility.
• Signal Preference: Use “Close” for conservative entries, “Wick” for aggressive setups.
• Timezone Offset: Set to -5 for EST (or -4 for EDT) to align with ICT’s New York session.
Trading Strategy
1. Macro Timeframes: Focus on New York (7:00–11:00 AM EST) or London (2:00–5:00 AM EST) kill zones for high institutional activity.
2. FVG Entries: Trade bullish FVGs as support in uptrends or bearish FVGs as resistance in downtrends, especially in :00–:10 or :50–:60 windows.
3. iFVG Retests: Enter on retest signals (▲/▼) during liquidity grabs or Judas swings, using “Close” for confirmation or “Wick” for speed.
4. Session FVGs: Use the “Show only 1st presented FVG” option to target the first gap in AM/PM sessions, often tied to ICT’s market maker algorithms.
5. Risk Management: Combine with ICT concepts like order blocks or breaker blocks for confluence, and set stops beyond FVG/iFVG boundaries.
Alerts
Set alerts for:
• “Bullish FVG Detected”/“Bearish FVG Detected”: New FVGs in selected windows.
• “Bullish Signal”/“Bearish Signal”: iFVG retest confirmations.
Settings Description
• Show Last (1–100, default: 5): Number of recent iFVGs to display. Lower values reduce clutter.
• Show only 1st presented FVG : Limits FVGs to the first in 9:30–10:00 AM or 1:30–2:00 PM EST sessions (overrides time window checkboxes).
• Time Window Checkboxes: Enable/disable FVG detection in 10-minute windows (:00–:10, :10–:20, etc.). All enabled by default.
• Signal Preference: “Close” (default) or “Wick” for iFVG retest signals.
• Use ATR Filter: Enables ATR-based size filtering (default: true).
• ATR Multiplier (0–∞, default: 0.25): Sets FVG size threshold (higher values = larger gaps).
• Remove Mitigated FVGs: Removes filled FVGs/iFVGs (default: true).
• Show FVG Labels: Displays “Bull FVG”/“Bear FVG” labels (default: true).
• Timezone Offset (-12 to 12, default: -5): Aligns time windows with EST.
• Colors: Customize bullish (green), bearish (red), and midline (gray) colors.
Why Use This Indicator?
This indicator empowers ICT traders with a tool that goes beyond generic FVG detection, offering precise, time-filtered gaps and inversion tracking aligned with institutional trading principles. By focusing on ICT’s macro timeframes, session-specific imbalances, and customizable signal logic, it provides a clear edge for scalping, swing trading, or reversal setups in high-liquidity markets.

FVG [TakingProphets]🧠 Purpose
This indicator is built for traders applying Inner Circle Trader (ICT) methodology. It detects and manages Fair Value Gaps (FVGs) — price imbalances that often act as future reaction zones. It also highlights New Day Opening Gaps (NDOGs) and New Week Opening Gaps (NWOGs) that frequently play a role in early-session price behavior.
📚 What is a Fair Value Gap?
A Fair Value Gap forms when price moves rapidly, skipping over a portion of the chart between three candles — typically between the high of the first candle and the low of the third. These zones are considered inefficient, meaning institutions may return to them later to:
-Rebalance unfilled orders
-Enter or scale into positions
-Engineer liquidity with minimal slippage
In ICT methodology, FVGs are seen as both entry zones and targets, depending on market structure and context.
⚙️ How It Works
-This script automatically identifies and manages valid FVGs using the following logic:
-Bullish FVGs: When the low of the current candle is above the high from two candles ago
-Bearish FVGs: When the high of the current candle is below the body of two candles ago
-Minimum Gap Filter: Gaps must be larger than 0.05% of price
-Combine Consecutive Gaps (optional): Merges adjacent gaps of the same type
-Consequent Encroachment Line (optional): Plots the midpoint of each gap
-NDOG/NWOG Tracking: Labels gaps created during the 5–6 PM session transition
-Automatic Invalidation: Gaps are removed once price closes beyond their boundary
🎯 Practical Use
-Use unmitigated FVGs as potential entry points or targets
-Monitor NDOG and NWOG for context around daily or weekly opens
-Apply the midpoint (encroachment) line for precise execution decisions
-Let the script handle cleanup — only active, relevant zones remain visible
🎨 Customization
-Control colors for bullish, bearish, and opening gaps
-Toggle FVG borders and midpoint lines
-Enable or disable combining of consecutive gaps
-Fully automated zone management, no manual intervention required
✅ Summary
This tool offers a clear, rules-based approach to identifying price inefficiencies rooted in ICT methodology. Whether used for intraday or swing trading, it helps traders stay focused on valid, active Fair Value Gaps while filtering out noise and maintaining chart clarity.

Smarter Money Concepts - MTF IFVGs [PhenLabs]📊 Smarter Money Concepts - MTF IFVG
Version: PineScript™ v6
📌 Description
This multi-timeframe indicator identifies Inverse Fair Value Gaps (IFVGs) and their inversions across simultaneous chart intervals, helping traders spot liquidity voids and potential reversal zones. By analyzing price action through the lens of institutional order flow patterns, it solves the problem of manual gap tracking across timeframes while incorporating volatility-adjusted parameters and psychological level analysis for higher-probability setups.
🚀 Points of Innovation
• Multi-Timeframe Engine - Simultaneous analysis of 3 higher timeframes
• Adaptive Parameters - Auto-adjusts to market volatility conditions
• Quality Scoring System - Ranks gaps using RVI strength and size metrics
• Inversion Tracking - Monitors failed gaps for counter-trend signals
• Render Optimization - Prevents chart clutter with smart gap management
🔧 Core Components
FVG Detection Logic: Identifies gaps using customizable price source (Close/Wick)
Inversion Tracker: Manages failed gaps and generates counter signals
Multi-Timeframe Engine: Processes 3 independent higher timeframe analyses
Dashboard System: Real-time display of active gaps across all timeframes
🔥 Key Features
• Volatility-adjusted gap size filters (ATR-based)
• Customizable timeframe confluence analysis
• Color-coded quality scoring
• Non-repainting inversion signals
• Mobile-optimized visual rendering
🎨 Visualization
• Colored Boxes: Translucent zones show active gaps (green/bullish, red/bearish)
• Midline Plot: Dashed gray line marks gap midpoint for price targets
• Inversion Markers: Intense colors show failed gaps (dark red/bullish failure, bright green/bearish failure)
• HTF Differentiation: Higher timeframe gaps shown in blue/teal hues
📖 Usage Guidelines
Multi-Timeframe Settings
• Higher Timeframe 1
Default: 30 | Range: Any > Chart TF | Controls primary confluence timeframe
• Show All Timeframes
Default: True | Toggles multi-TF gap displays
Gap Settings
• Source
Default: Close | Options: | Determines gap measurement method
• RVI Period
Default: 14 | Range: 1-50 | Sets momentum confirmation sensitivity
• RVI Value
Default 0.1 | 0 to see all IFVGs | Increase min RVI to see the most powerful IFVGs
✅ Best Use Cases
• Identifying confluence across timeframes
• Spotting institutional order blocks
• High-probability reversal trading
• Trend continuation confirmation
• Volatility breakout setups
⚠️ Limitations
• Repaints historical gap zones
• Requires understanding of FVG concepts
• Higher timeframe data latency
• Quality scores rely on RVI/ATR settings
💡 What Makes This Unique
First FVG indicator with true multi-timeframe processing
Adaptive parameters that auto-adjust to volatility
Quantifiable quality scoring system
Professional-grade dashboard with HTF tracking
🔬 How It Works
Gap Detection: Identifies FVGs using price relationships and RVI confirmation
Inversion Tracking: Monitors price breaches to flag failed gaps
Quality Assessment: Scores gaps based on size, momentum, and location
Adaptive Filtering: Adjusts parameters using ATR-based volatility analysis
Multi-TF Synthesis: Correlates gaps across user-selected timeframes
Visual Rendering: Displays only relevant, active gaps to prevent clutter
💡 Note:
Start with default settings and gradually adjust parameters after observing market interactions. Focus on gaps with quality scores above 7 that align with higher timeframe trends. Combine with price action at psychological levels for highest-probability setups. Remember that higher timeframe gaps generally carry more significance than current chart gaps.

FVG# Fair Value Gap (FVG) Indicator
## Overview
The Fair Value Gap (FVG) indicator is a technical analysis tool designed to identify potential areas of price imbalance in the market. These imbalances, known as "fair value gaps," represent discontinuities in price movement where supply and demand were significantly imbalanced, potentially creating zones that price may return to in the future. This indicator was developed by Michele Amori for TradingView and operates as an overlay on price charts.
## Core Concept
Fair Value Gaps occur when price makes a significant move in one direction, leaving behind an area where no trading occurred. Specifically:
- **Bullish FVG**: Forms when the low of the current candle is higher than the high of the candle two positions back, creating an upward gap in price movement.
- **Bearish FVG**: Forms when the high of the current candle is lower than the low of the candle two positions back, creating a downward gap in price movement.
These gaps represent potential "fair value" areas that price may revisit to establish equilibrium between buyers and sellers.
## Visual Representation
The indicator displays FVGs in the following manner:
1. **Bullish FVGs**:
- Represented by semi-transparent green boxes
- Extend from the high of the candle two positions back to the low of the current candle
- Include a dashed green center line representing the middle point of the gap
2. **Bearish FVGs**:
- Represented by semi-transparent red boxes
- Extend from the low of the candle two positions back to the high of the current candle
- Include a dashed red center line representing the middle point of the gap
All FVG boxes and their center lines are extended to the right of the chart, making them visible until they are filled or invalidated.
## Invalidation Logic
The indicator automatically removes FVGs when they are considered filled or invalidated:
- **Bullish FVGs**: Removed when the closing price falls below the bottom of the FVG box, indicating that the upward gap has been filled.
- **Bearish FVGs**: Removed when the closing price rises above the top of the FVG box, indicating that the downward gap has been filled.
This removal only occurs after a candle is confirmed (fully formed), ensuring that premature invalidation doesn't occur during candle formation.
## Technical Implementation
The indicator uses arrays to store and manage the FVG boxes and their center lines. Key features of the implementation include:
- Creation of new FVGs only after candle confirmation
- Dynamic addition and removal of visual elements
- Transparent coloring (75% transparency) for better chart visibility
- Dashed center lines with less transparency (25%) to highlight the middle point of gaps

First Presented Fair Value Gap [TakingProphets]🧠 Indicator Purpose:
The "First Presented Fair Value Gap" (FPFVG) by Taking Prophets is a precision tool designed for traders utilizing Inner Circle Trader (ICT) concepts. It automatically detects and highlights the first valid Fair Value Gap (FVG) that forms between 9:30 AM and 10:00 AM New York time — one of the most critical windows in ICT-based trading frameworks.
It also plots the Opening Range Equilibrium (the average of the previous day's 4:14 PM close and today's 9:30 AM open) — a key ICT reference point for premium/discount analysis.
🌟 What Makes This Indicator Unique:
This script is highly specialized for early session trading and offers:
Automatic Detection: Finds the first Fair Value Gap after the 9:30 AM NYSE open.
Clear Visualization: Highlights the FVG zone and labels it with optional time stamps.
Equilibrium Line: Plots the Opening Range Equilibrium for instant premium/discount context.
Time-Sensitive Logic: Limits detection to the most volatile early session (9:30 AM - 10:00 AM).
Extension Options: You can extend both the FVG box and Equilibrium line out to 3:45 PM (end of major session liquidity).
⚙️ How the Indicator Works (Detailed):
Pre-Market Setup:
Captures the previous day's 4:14 PM close.
Captures today's 9:30 AM open.
Calculates the Equilibrium (midpoint between the two).
After 9:30 AM (New York Time):
Monitors each 1-minute candle for the creation of a Fair Value Gap:
Bullish FVG: Low of the current candle is above the high two candles ago.
Bearish FVG: High of the current candle is below the low two candles ago.
The first valid gap is boxed and optionally labeled.
Post-Detection Management:
The FVG box and label extend forward in time until 3:45 PM (or the current time, based on settings).
If enabled, the Equilibrium line and label also extend to help with premium/discount analysis.
🎯 How to Use It:
Step 1: Wait for market open (9:30 AM New York time).
Step 2: Watch for the first presented FVG on the 1-minute chart.
Step 3: Use the FPFVG zone to guide entries (retracements, rejections, or breaks).
Step 4: Use the Opening Range Equilibrium to determine premium vs. discount conditions:
Price above Equilibrium = Premium market.
Price below Equilibrium = Discount market.
Best Application:
In combination with ICT Killzones, especially during the London or New York Open.
When framing intraday bias and identifying optimal trade locations based on liquidity theory.
🔎 Underlying Concepts:
Fair Value Gaps: Price imbalances where liquidity is likely inefficient and future rebalancing can occur.
Opening Range Equilibrium: Key ICT price anchor used to separate premium and discount conditions post-open.
Time-Gated Setup: Limits focus to early session price action, aligning with inner circle trader timing models.
🎨 Customization Options:
FVG color, label visibility, and label size.
Opening Range Equilibrium line visibility and label styling.
Extend lines and boxes to 3:45 PM automatically for full session tracking.
✅ Recommended for:
Traders applying Inner Circle Trader (ICT) models.
Intraday scalpers or day traders trading the New York session open.
Traders who want to frame early session bias and liquidity traps effectively.
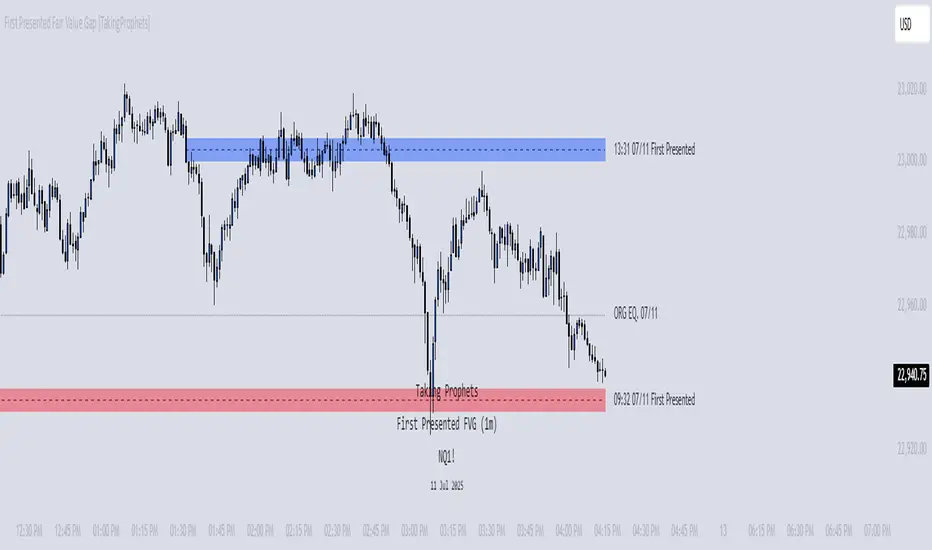
FVG TheoryThe indicator is intended to facilitate trading with FVGs. It consists of 3 components:
1. Swings:
A swing is a 3-candle formation based on the Williams Fractal Indicator.
The interaction with the last swing is always displayed as a red line. This allows you to recognize the last interaction directly and draw conclusions about the further course of the price (sweep / break).
In addition, the closest fractal is always shown as a green line, which acts as a potential target.
2. FVGs:
FVGs are also known as Inbalance, it is a 3 candle formation where a gap is created in the market. The market often runs into this and reacts.
If the market reacts from an imbalance before it has reached the swing low in the bullish case, the next FVG appears in a different color.
This formation has more power and is therefore color-coded.
If the FVG is particularly strong, measured by the fact that the 3rd candle in the formation breaks the 2nd candle with a candle body, this is marked with a small arrow in the FVG (break away gap).
3. overlapping
If there is a structure point within an FVG (order block, significant swing), a line is drawn there.
These overlaps have a higher confluence than FVGs alone. The wick is preferred, but if there is no overlap, the body of the structure is used.
The line thickness and colors are individually adjustable.

London ORB + Session High/Low + FVGLondon ORB + Session High/Low + FVG
📘 Script Description: London ORB + Session High/Low + Fair Value Gap
This script is designed to assist intraday traders during the London session open by combining:
🕒 1. Opening Range Breakout (ORB)
Captures the high and low of the first 15-minute candle after the London open (08:00–08:15 GMT).
Draws lines and labels for the ORB High and Low levels.
Detects breakouts above or below the ORB and plots a triangle signal at the breakout bar.
🌐 2. Asian & US Session Levels
Automatically marks the highs and lows of the Asian (00:00–06:00 GMT) and US (13:30–20:00 GMT) sessions.
Useful for identifying prior session liquidity zones, key support/resistance levels, and potential reaction areas.
📉 3. Fair Value Gaps (FVG)
Highlights imbalances in price action between non-overlapping candles (also known as FVGs or inefficiencies).
Draws a shaded box between candles where gaps exist:
Green for bullish FVGs
Red for bearish FVGs
🔔 4. Alert Support
Optional alerts are built in for:
Long breakout (price breaks above ORB)
Short breakout (price breaks below ORB)
🎯 Use Case
Perfect for:
Day traders looking to capitalize on early volatility at the London open
Traders using liquidity-based strategies, retests, or gap-fills
Visualizing and aligning with prior session highs/lows for structure and context

First FVG Custom Time RangeFirst FVG — Opening Range Fair Value Gap Detector
Smart Money Opening Imbalance Strategy Tool
This script automatically detects and highlights the first Fair Value Gap (FVG) that forms between 9:30 and 10:00 AM Eastern Time (New York session open) — a critical period often referred to as the Opening Range. It’s designed for Smart Money traders looking to isolate early-morning inefficiencies that may influence market behavior throughout the trading day.
🔍 What This Script Does:
Automatically Detects the First FVG in the Opening Range
Scans price action between 9:30 and 10:00 AM ET and identifies the first valid bullish or bearish FVG that forms.
Only one FVG is shown per day — ensuring a clean, focused view.
Draws a Visual Zone
Once detected, the FVG zone is extended forward on the chart (customizable duration).
A labeled zone helps users track how price reacts to it throughout the session.
Optional Retest Alerts
Alerts you when price re-enters the zone — a potential reaction point used by SMC traders.
Customization Options
Set your preferred session time window
Adjust zone duration (in bars)
Customize label font size, colors, and visibility
Enable/disable alert on retest
📈 Why the First FVG Matters:
Time-Sensitive Setup: The first FVG typically forms no earlier than 9:31 AM ET and represents a potential “time distortion” or imbalance zone created by aggressive market participants during the open.
Behavioral Study: Many traders journal how price behaves around this zone each day — whether it acts as support, resistance, or gets traded through later in the session.
Predictive Value: Observing how this zone is respected or broken can provide anticipatory insight into intraday price action, rather than reactive analysis.
Great for New Traders: This opening FVG is often recommended as a starting reference point for building trade models and understanding how institutional imbalances unfold.
🚀 What Makes It Unique:
This tool doesn’t spam your chart with every FVG. It laser-focuses on a single, time-bound zone backed by institutional logic — the first presented imbalance of the day during the opening range.
Use it to:
Monitor price behavior around early inefficiencies
Plan journal entries and pattern recognition
Align intraday setups with a high-probability SMC model
Whether you’re scalping, journaling market structure, or refining entries based on liquidity behavior — this script helps you make the first 30 minutes count.

FVG + Swings + ConfigurableOverview
This Pine Script v5 indicator highlights Fair Value Gaps (FVGs), plots swing‑high and swing‑low pivots, and marks single breakouts above the last swing‑high or below the last swing‑low by recoloring the breakout candle. Every aspect—gap size, count limits, colors, and feature toggles—is exposed as an input so you can tailor it to your own workflow.
Key Features
Fair Value Gaps
Detects bullish gaps when the high of bar i-2 is below the low of the current bar.
Detects bearish gaps when the low of bar i-2 is above the high of the current bar.
Draws a semi‑transparent rectangle spanning from bar i-2 to bar i + extension.
Automatically deletes oldest boxes when exceeding the user’s “Max FVG Boxes” limit.
Swing‑High / Swing‑Low Pivots
Identifies a swing‑high when the middle candle of a three‑bar sequence has the highest high.
Identifies a swing‑low when the middle candle has the lowest low.
Marks each pivot with a tiny dot above (high) or below (low) the bar.
Single Breakouts
Tracks the most recent swing‑high and swing‑low levels.
On the first close above the last swing‑high (or below the last swing‑low), recolors that single candle.
Prevents repeated coloring until a new swing pivot forms.
Full Customization
Show/Hide toggles for FVGs, swing pivots, breakouts.
Numeric inputs for FVG extension length and maximum retained boxes.
Color pickers for bullish/bearish gaps, swing pivots, and breakout candles.

FVG, Swing, Target, D/W/M High Low Detector Basic by Trader Riaz"FVG, Swing, Target, D/W/M High Low Detector Basic by Trader Riaz " is a powerful TradingView indicator designed to enhance your trading strategy by identifying key market structures and levels. This all-in-one tool detects Fair Value Gaps (FVGs), Swing Highs/Lows, and previous Day, Previous Week, and Previous Month Highs/Lows, helping traders make informed decisions with ease.
Key Features:
Bullish & Bearish FVG Detection: Highlights Fair Value Gaps with customizable colors, labels, and extension options.
Swing Highs & Lows: Automatically detects and marks Swing Highs and Lows with adjustable display settings and extensions.
Next Target Levels: Identifies potential price targets based on market direction (rising or falling).
Daily, Weekly, and Monthly High/Low Levels: Displays previous day, week, and month highs/lows with customizable colors.
Customizable Settings: Fully adjustable inputs for colors, number of levels to display, and extension periods.
Clean Visuals: Intuitive and non-intrusive design with dashed lines, labels, and tooltips for better chart readability.
This indicator is ideal for traders looking to identify key price levels, improve market structure analysis, and enhance their trading strategies.
Happy Trading,
Trader Riaz

Consecutive CandlesSummary
This indicator helps visualize short-term momentum by automatically drawing boxes around sequences of consecutive same-colored candles (bullish or bearish). It's designed to quickly highlight periods of sustained buying or selling pressure directly on your chart.
How it Works
Consecutive Candle Detection: The script monitors the chart bar by bar, tracking consecutive candles where close > open (bullish) or close < open (bearish).
Box Drawing: When a sequence of same-colored candles reaches a user-defined minimum length (default is 3) and this sequence is then broken by an opposite-colored candle or a doji, a box is drawn.
Box Boundaries:
The top of the box is set to the highest high price reached during the sequence.
The bottom of the box is set to the lowest low price reached during the sequence.
The left edge of the box aligns with the start time of the first candle in the sequence.
The right edge of the box aligns with the end time of the last candle in the sequence.
Stability: Uses xloc = xloc.bar_time to ensure boxes remain accurately anchored to the price bars when zooming or panning the chart.
Real-time Extension: For active sequences meeting the minimum length on the latest developing bar, the box is optionally extended to the right.
Features
Automatically identifies and boxes sequences of 3 or more (customizable) consecutive bullish candles.
Automatically identifies and boxes sequences of 3 or more (customizable) consecutive bearish candles.
Extends box in real-time for active qualifying sequences.
Customizable minimum candle count (>= 2).
Customizable colors for bullish/bearish boxes and borders.
Settings
You can customize the indicator via the Settings menu (gear icon):
Minimum Consecutive Candles: Define how many candles in a row are needed to draw a box (Default: 3).
Bullish Box Color: Set the fill color for boxes around bullish sequences.
Bearish Box Color: Set the fill color for boxes around bearish sequences.
Box Border Color: Set the color for the border of all boxes.
Potential Use Cases
Momentum Identification: Quickly spot periods of strong, uninterrupted buying or selling.
Exhaustion/Reversal Signals: Very long sequences might indicate potential exhaustion, setting up reversal opportunities.
Consolidation Breakouts: A box forming after a period of tight consolidation can highlight the range just before a potential breakout.
Confirmation: Use the boxes as confirmation for entries or exits based on momentum shifts.
Disclaimer: This indicator provides visual aids based on price action. It should not be used as a standalone trading system. Always use indicators in conjunction with your own analysis and risk management rules.

Multitimeframe Fair Value Gap – FVG (Zeiierman)█ Overview
The Multitimeframe Fair Value Gap – FVG (Zeiierman) indicator provides a dynamic and customizable visualization of institutional imbalances (Fair Value Gaps) across multiple timeframes. Built for traders who seek to analyze price inefficiencies, this tool helps highlight potential entry points, unmitigated gaps, and directional bias using smart volume logic and adaptive visual elements.
A Fair Value Gap (FVG) forms when there's a three-candle sequence in which a market imbalance leaves a "gap" between the wicks of candle 1 and candle 3. These areas are often considered footprints of institutional activity, and this indicator gives you the tools to track them with surgical precision across any timeframe you choose—regardless of the one you're viewing.
This indicator also includes a trend filter powered by a low-pass Butterworth filter, enabling traders to distinguish between countertrend vs. trend-aligned FVGs for more intelligent decision-making. On top of that, it features a dynamic FVG table for live tracking and bull/bear volume power visualization inside each gap, adding powerful clarity to market intent.
█ How It Works
The indicator analyzes the open, high, low, close, and volume of candles from a user-selected timeframe. It identifies Fair Value Gaps based on wick logic and only confirms those that meet customizable strength criteria. Once detected, the indicator visualizes each FVG with dynamically extending boxes, optional buy/sell volume bars, and a real-time mitigation check.
⚪ Multitimeframe Logic
Users can analyze FVGs from a higher or lower timeframe regardless of their current chart.
This is achieved using request.security() to fetch OHLCV data from the chosen timeframe.
⚪ Wick Sensitivity & Impulse Filter
The script measures the wick size of potential FVG candles and compares them to a running average. Only FVGs with wick sizes above a certain sensitivity threshold (user-controlled) are plotted. This ensures only meaningful price dislocations (e.g., strong impulsive moves) are shown, reducing noise.
⚪ Midpoint Mitigation Logic
FVGs are marked as "mitigated" when the price revisits the gap area. Traders can choose whether full gap closure or just a midpoint touch is required. This allows faster reactivity in real-time trading environments.
⚪ Bull & Bear Power – Volume-Weighted Visualization
Every Fair Value Gap box includes sub-bars representing the estimated buy and sell effort that created the gap. These are calculated using the candle's close in relation to its high/low range and volume:
Buy Volume % ≈ effort from low to close
Sell Volume % ≈ effort from high to close
Each sub-bar inside the FVG:
Is color-coded (UpCol for bullish, DnCol for bearish)
Is drawn proportionally to the strength of buyers or sellers
Visually displays who was in control during the imbalance
⚪ FVG Table – Dynamic On-Chart Overview
The indicator includes an optional on-chart table that displays all currently active (unmitigated) FVGs in a side panel format:
Automatic updates as gaps are formed and mitigated
Color-coded rows to show bullish vs. bearish FVGs
Timestamps to know precisely when the gap formed
User-controlled position via Table Left and Table Right
This is a gap watchlist overlay, giving traders a concise view of current inefficiencies without manually scanning the chart.
⚪ FVG Trend Filter (Butterworth Smoother)
Using a two-pole Butterworth low-pass filter, the indicator computes a trendline based on average FVG values, offering a smooth but responsive directional signal.
Passband Ripple (dB): Controls sensitivity and overshoot tolerance
Cutoff Frequency (0–0.5): Sets how quickly the trendline reacts
The trendline helps categorize each FVG:
Trend up → favor bullish FVGs
Trend down → favor bearish FVGs
It adds an extra dimension to FVG entries, helping distinguish between trend-aligned and countertrend signals.
█ How to Use
⚪ Identify Institutional Gaps
Use this tool to identify areas where institutions may have left imbalances behind quickly.
These areas often become:
Strong support/resistance zones
Areas where price might react sharply
Targets for liquidity sweeps or retracements
⚪ React to Trend or Countertrend
The built-in trendline helps categorize each FVG:
Trend up → Bullish FVGs have higher validity
Trend down → Bearish FVGs have higher validity
⚪ Volume Context via Bull/Bear Power
Each Fair Value Gap is more than just a price imbalance — it’s a story of effort and intent. The Bull/Bear Power feature visualizes the buy and sell pressure behind each FVG, helping you understand how the gap was formed and who was in control.
A bullish FVG with a strong buy effort suggests continuation potential — buyers dominated the move.
A bullish FVG with a dominant sell effort could signal a trap or reversal — sellers may have overwhelmed the breakout.
These insights allow you to confirm imbalance strength, spot traps early, and add confidence to entries based on dominant volume profiles.
Instead of viewing gaps as static zones, this feature turns each into a live volume map — a visual breakdown of who moved the market and whether that move had conviction.
⚪ Plan with the FVG Table
The FVG Table acts as your on-chart control center for tracking active imbalances. When enabled, it provides a clear summary of all unmitigated Fair Value Gaps, helping you stay organized and focused during fast-moving sessions.
Track live and historical gaps: See exactly when and where each FVG formed.
Monitor older, still-valid zones: Gaps off-screen but not mitigated remain in play — perfect for anticipating future reactions.
Gauge market bias at a glance: The balance of bullish vs. bearish FVGs helps you understand overall directional pressure.
Plan entries confidently: Use the table to reference all zones for risk management, confluence stacking, or layered execution strategies.
Instead of manually scanning your chart, the FVG Table offers a clean, at-a-glance overview of the market’s inefficiencies — giving you the structure needed to act with precision.
█ Settings
FVG Timeframe
Select any timeframe to source FVGs independent of your current chart.
Sensitivity
Filter FVGs by how impulsive the move is — it helps you eliminate weak gaps.
Mitigated on Mid
Control whether gaps are removed at midpoint touch or full fill.
Table Settings
Control the table position and width. Cleanly view all active FVGs.
FVG Style
Customize gap box colors, length, and bullish/bearish overlays.
Trend Filter
Enable or disable the smoothed FVG-based trendline with customizable smoothing controls.
-----------------
Disclaimer
The content provided in my scripts, indicators, ideas, algorithms, and systems is for educational and informational purposes only. It does not constitute financial advice, investment recommendations, or a solicitation to buy or sell any financial instruments. I will not accept liability for any loss or damage, including without limitation any loss of profit, which may arise directly or indirectly from the use of or reliance on such information.
All investments involve risk, and the past performance of a security, industry, sector, market, financial product, trading strategy, backtest, or individual's trading does not guarantee future results or returns. Investors are fully responsible for any investment decisions they make. Such decisions should be based solely on an evaluation of their financial circumstances, investment objectives, risk tolerance, and liquidity needs.

Smarter Money Concepts - FVGs [PhenLabs]📊 Smarter Money Concepts - FVGs
Version: PineScript™ v6
📌 Description
Smarter Money Concepts - FVGs is a sophisticated indicator designed to identify and track Fair Value Gaps (FVGs) in price action. These gaps represent market inefficiencies where price moves quickly, creating imbalances that often attract subsequent price action for mitigation. By highlighting these key areas, traders can identify potential zones for reversals, continuations, and price targets.
The indicator employs volume filtering ideology to highlight only the most significant FVGs, reducing noise and focusing on gaps formed during periods of higher relative volume. This combination of price structure analysis and volume confirmation provides traders with high-probability areas of interest that institutional smart money may target during future price movements.
🚀 Points of Innovation
Volume-Filtered Gap Detection : Eliminates low-significance FVGs by requiring a minimum volume threshold, focusing only on gaps formed with institutional participation
Equilibrium Line Visualization : Displays the midpoint of each gap as a potential precision target for trades
Automated Gap Mitigation Tracking : Monitors when price revisits and mitigates gaps, automatically managing visual elements
Time-Based Gap Management : Intelligently filters gaps based on a configurable timeframe, maintaining chart clarity
Dual Direction Analysis : Simultaneously tracks both bullish and bearish gaps, providing a complete market structure view
Memory-Optimized Design : Implements efficient memory management for smooth chart performance even with numerous FVGs
🔧 Core Components
Fair Value Gap Detection : Identifies price inefficiencies where the current candle’s low is higher than the previous candle’s high (bearish FVG) or where the current candle’s high is lower than the previous candle’s low (bullish FVG).
Volume Filtering Mechanism : Calculates relative volume compared to a moving average to qualify only gaps formed during significant market activity.
Mitigation Tracking : Continuously monitors price action to detect when gaps get filled, with options to either hide or maintain visual representation of mitigated gaps.
🔥 Key Features
Customizable Gap Display : Toggle visibility of bullish and bearish gaps independently to focus on your preferred market direction
Volume Threshold Control : Adjust the minimum volume ratio required for gap qualification, allowing fine-tuning between sensitivity and significance
Flexible Mitigation Methods : Choose between “Wick” or “Close” methods for determining when a gap has been mitigated, adapting to different trading styles
Visual Customization : Full control over colors, transparency, and style of gap boxes and equilibrium lines
🎨 Visualization
Gap Boxes : Rectangular highlights showing the exact price range of each Fair Value Gap. Bullish gaps indicate potential upward price targets, while bearish gaps show potential downward targets.
Equilibrium Lines : Dotted lines running through the center of each gap, representing the mathematical midpoint that often serves as a precision target for price movement.
📖 Usage Guidelines
General Settings
Days to Analyze : Default: 15, Range: 1-100. Controls how many days of historical gaps to display, balancing between comprehensive analysis and chart clarity
Visual Settings
Bull Color : Default:(#596fd33f). Color for bullish Fair Value Gaps, typically using high transparency for clear chart visibility
Bear Color : Default:(#d3454575). Color for bearish Fair Value Gaps, typically using high transparency for clear chart visibility
Equilibrium Line : Default: Enabled. Toggles visibility of the center equilibrium line for each FVG
Eq. Line Color : Default: Black with 99% transparency. Sets the color of equilibrium lines, usually kept subtle to avoid chart clutter
Eq. Line Style : Default: Dotted, Options: Dotted, Solid, Dashed. Determines the line style for equilibrium lines
Mitigation Settings
Mitigation Method : Default: Wick, Options: Wick, Close. Determines how gap mitigation is calculated - “Wick” uses high/low values while “Close” uses open/close values for more conservative mitigation criteria
Hide Mitigated : Default: Enabled. When enabled, gaps become transparent once mitigated, reducing visual clutter while maintaining historical context
Volume Filter
Volume Filter : Default: Enabled. When enabled, only shows gaps formed with significant volume relative to recent average
Min Ratio : Default: 1.5, Range: 0.1-10.0. Minimum volume ratio compared to average required to display an FVG; higher values filter out more gaps
Periods : Default: 15, Range: 5-50. Number of periods used to calculate the average volume baseline
✅ Best Use Cases
Identifying potential reversal zones where price may react after extended moves
Finding precise targets for take-profit placement in trend-following strategies
Detecting institutional interest areas for potential breakout or breakdown confirmations
Plotting significant support and resistance zones based on structural imbalances
Developing fade strategies at key market structure points
Confirming trade entries when price approaches significant unfilled gaps
⚠️ Limitations
Works best on higher timeframes where gaps reflect more significant market inefficiencies
Very choppy or ranging markets may produce small gaps with limited predictive value
Volume filtering depends on accurate volume data, which may be less reliable for some symbols
Performance may be affected when displaying a very large number of historical gaps
Some gaps may never be fully mitigated, particularly in strongly trending markets
💡 What Makes This Unique
Volume Intelligence : Unlike basic FVG indicators, this script incorporates volume analysis to identify the most significant structural imbalances, focusing on quality over quantity.
Visual Clarity Management : Automatic handling of mitigated gaps and memory management ensures your chart remains clean and informative even over extended analysis periods.
Dual-Direction Comprehensive Analysis : Simultaneously tracks both bullish and bearish gaps, providing a complete market structure picture rather than forcing a directional bias.
🔬 How It Works
1. Gap Detection Process :
The indicator examines each candle in relation to previous candles, identifying when a gap forms between the low of candle and high of candle (bearish FVG) or between the high of candle and low of candle (bullish FVG). This specific candle relationship identifies true structural imbalances.
2. Volume Qualification :
For each potential gap, the algorithm calculates the relative volume compared to the configured period average. Only gaps formed with volume exceeding the minimum ratio threshold are displayed, ensuring focus on institutionally significant imbalances.
3. Equilibrium Calculation :
For each qualified gap, the script calculates the precise mathematical midpoint, which becomes the equilibrium line - a key target that price often gravitates toward during mitigation attempts.
4. Mitigation Tracking :
The indicator continuously monitors price action against existing gaps, determining mitigation based on the selected method (wick or close). When price reaches the equilibrium point, the gap is considered mitigated and can be visually updated accordingly.
💡 Note:
Fair Value Gaps represent market inefficiencies that often, but not always, get filled. Use this indicator as part of a complete trading strategy rather than as a standalone system. The most valuable signals typically come from combining FVG analysis with other confirmatory indicators and overall market context. For optimal results, start with the default settings and gradually adjust parameters to match your specific trading timeframe and style.

Imbalance(FVG) DetectorImbalance (FVG) Detector
Overview
The Imbalance (FVG) Detector is a technical analysis tool designed to highlight price inefficiencies by identifying Fair Value Gaps (FVGs). These gaps occur when rapid price movement leaves an area with little to no traded volume, which may later act as a zone of interest. The indicator automatically detects and marks these imbalances on the chart, allowing users to observe historical price behavior more effectively.
Key Features
- Automatic Imbalance Detection: Identifies bullish and bearish imbalances based on a structured three-bar price action model.
- Customizable Sensitivity: Users can adjust the minimum imbalance percentage threshold to tailor detection settings to different assets and market conditions.
- Real-time Visualization: Marked imbalances are displayed as colored boxes directly on the chart.
- Dynamic Box Updates: Imbalance zones extend forward in time until price interacts with them.
- Alert System: Users can set alerts for when new imbalances appear or when price tests an existing imbalance.
How It Works
The indicator identifies market imbalances using a three-bar price structure:
- Bullish Imbalance: Occurs when the high of three bars ago is lower than the low of the previous bar, forming a price gap.
- Bearish Imbalance: Occurs when the low of three bars ago is higher than the high of the previous bar, creating a downward gap.
When an imbalance is detected:
- Green Boxes indicate bullish imbalances.
- Red Boxes indicate bearish imbalances.
- Once price interacts with an imbalance, the box fades to gray, marking it as tested.
! Designed for Crypto Markets
This indicator is particularly useful in crypto markets, where frequent volatility can create price inefficiencies. It provides a structured way to visualize gaps in price movement, helping users analyze historical liquidity areas.
Customization Options
- Min Imbalance Percentage Size: Adjusts the sensitivity of the imbalance detection.
- Alerts: Users can enable alerts to stay notified of new or tested imbalances.
Important Notes
- This indicator is a technical analysis tool and does not provide trading signals or financial advice.
- It does not predict future price movement but highlights historical price inefficiencies.
- Always use this tool alongside other market analysis methods and risk management strategies.

ICT FVG & Swing Detector Basic by Trader RiazICT FVG & Swing Detector Basic by Trader Riaz
Unlock Precision Trading with the Ultimate Fair Value Gap (FVG) and Swing Detection Tool!
Developed by Trader Riaz , the ICT FVG and Swing Detector Basic is a powerful Pine Script indicator designed to help traders identify key market structures with ease. Whether you're a day trader, swing trader, or scalper, this indicator provides actionable insights by detecting Bullish and Bearish Fair Value Gaps (FVGs) and Swing Highs/Lows on any timeframe. Perfect for trading forex, stocks, crypto, and more on TradingView!
Key Features:
1: Bullish and Bearish FVG Detection
- Automatically identifies Bullish FVGs (highlighted in green) and Bearish FVGs (highlighted in red) to spot potential reversal or continuation zones.
- Displays FVGs as shaded boxes with a dashed midline at 70% opacity, making it easy to see the midpoint of the gap for precise entries and exits.
- Labels are placed inside the FVG boxes at the extreme right for clear visibility.
2: Customizable FVG Display
- Control the number of Bullish and Bearish FVGs displayed on the chart with user-defined inputs (fvg_bull_count and fvg_bear_count).
- Toggle the visibility of Bullish and Bearish FVGs with simple checkboxes (show_bull_fvg and show_bear_fvg) to declutter your chart.
3: Swing High and Swing Low Detection
- Detects Swing Highs (blue lines) and Swing Lows (red lines) to identify key market turning points.
- Labels are positioned at the extreme right edge of the lines for better readability and alignment.
- Customize the number of Swing Highs and Lows displayed (swing_high_count and swing_low_count) to focus on the most recent market structures.
4: Fully Customizable Display
- Toggle visibility for Swing Highs and Lows (show_swing_high and show_swing_low) to suit your trading style.
- Adjust the colors of Swing High and Low lines (swing_high_color and swing_low_color) to match your chart preferences.
5: Clean and Efficient Design
- Built with Pine Script v6 for optimal performance on TradingView.
- Automatically removes older FVGs and Swing points when the user-defined count is exceeded, keeping your chart clean and focused.
- Labels are strategically placed to avoid clutter while providing clear information.
Why Use This Indicator?
Precision Trading: Identify high-probability setups with FVGs and Swing points, commonly used in Smart Money Concepts (SMC) and Institutional Trading strategies.
User-Friendly: Easy-to-use inputs allow traders of all levels to customize the indicator to their needs.
Versatile: Works on any market (Forex, Stocks, Crypto, Commodities) and timeframe (1M, 5M, 1H, 4H, Daily, etc.).
Developed by Trader Riaz: Backed by the expertise of Trader Riaz, a seasoned trader dedicated to creating tools that empower the TradingView community.
How to Use:
- Add the Custom FVG and Swing Detector to your chart on TradingView.
- Adjust the input settings to control the number of FVGs and Swing points displayed.
- Toggle visibility for Bullish/Bearish FVGs and Swing Highs/Lows as needed.
- Use the identified FVGs and Swing points to plan your trades, set stop-losses, and target key levels.
Ideal For:
- Traders using Smart Money Concepts (SMC), Price Action, or Market Structure strategies.
- Those looking to identify liquidity grabs, imbalances, and trend reversals.
- Beginners and advanced traders seeking a reliable tool to enhance their technical analysis.
Happy trading!
