Original Gann Swing Chart Rules [AlgoFuego]🔵 Original Gann Swing Chart Rules
An advanced indicator built on W.D. Gann’s original rules, enhanced with innovative mechanical trend-following methods.
🔹 Description
This indicator functions by balancing short-term adaptability with long-term trend analysis.
The indicator incorporates Gann’s principles alongside mechanical trend-following techniques to offer a structured method for analyzing trends and detecting potential market reversals.
Golden Rule: Non-trend bars are excluded from analysis, and each new bar is compared with the previous trend bar, it highlights significant swing points with greater clarity.
🔸 The core concept behind the golden rule on which this indicator is built.
The person watching the tide coming, wanting to pinpoint the exact spot that signals the high tide, places a stick in the sand at the points where the incoming waves reach until the stick reaches a position where the waves no longer rise, and eventually recedes enough to show that the tide has shifted.
This method is effective for monitoring and identifying tides and floods in the stock market.
🔸Rule 1: The trend bar is everything.
→It is a bar that forms a new high, low, or both.
🔸Rule 2: The professional traders track new highs and lows.
🔸Rule 3: The hidden bar is nothing.
→It is a bar that does not form a new high, low, or both.
🔸Rule 4: The sea has a wavy nature, and the market as well.
🔸Rule 5: The slope is the immediate direction of the swing.
Downward slope
→The downslope is the descending slope of a swing, shows a decline, reflecting a bearish price trend.
Upward slope
→The upslope is the ascending slope of a swing, shows an incline, reflecting a bullish price trend.
🔸Rule 6: The start and end of the movement are the swing points.
→The lowest or highest price of the last bar in the direction of the slope represents the swing point after the slopes direction changes.
Valley
→It is the lowest price of the last bar in a downslope before the market turns to a upslope.
End=> Downward slope and Start=> Upward slope
Peak
→It is the highest price of the last bar in a upslope before the market turns to an downslope.
End=> Upward slope and Start=> Downward slope
🔸Rule 7: The Golden Rule: Ignore all no-trend bars and compare the new bar with the previous trend bar.
→Applying the golden rule in upward slope
→Applying the golden rule in downward slope
🔸 Related content: Personal words of W.D Gann from the book Wall Street Stock Selector.
→"This was only one month's reaction the same as March 1925. The market held in a dull narrow range for about 2 months while accumulation was taking place and in June the main trend turned up again."
→The beginning of the main trend and the formation of the Valley.
→The beginning of the main trend and the formation of the Peak.
🔸 Rule 8: The Closing Price of the Bar to Understand Movement Direction.
Sequence is important
→ Downward bar
→ Upward bar
🔸 Outside Bar Rules
→Explanation of rules and calculations.
🔸 How does a trend start?
Upward trend
Trend change from Downward to Upward.
Prices must take out the nearest 'Peak' and the Trend was previously Downward.
A breakout above the previous peak signals a bullish reversal.
→ Model 1 - Dropping Valley Reversal
The market forms a dropping valley, followed by a breakout above the previous peak.
→ Model 2 - Equal Valley Reversal
The market forms an equal valley, followed by a breakout above the previous peak.
→ Model 3 - Rising Valley Reversal
The market forms a rising valley, followed by a breakout above the previous peak.
Downward trend
Trend change from Upward to Downward.
Prices must take out the nearest ‘Valley' and the Trend was previously Upward.
A breakdown below the previous valley signals a bearish reversal.
→ Model 1 - Rising Peak Reversal
The market forms a rising peak, followed by a breakdown below the previous valley.
→ Model 2 - Equal Peak Reversal
The market forms an equal peak, followed by a breakdown below the previous valley.
→ Model 3 - Dropping Peak Reversal
The market forms a dropping peak, followed by a breakdown below the previous valley.
🔸 The fractal nature of markets
Rising wave
→ The rising wave is the entire bull market between turning points
High point : When the Main trend turns from upward to downward, the peak of the primary trend is formed.
Dropping wave
→ The Dropping wave is the entire bear market between turning points.
Low point : When the Main trend turns from downward to upward, the primary trend valley is formed.
Fractal nature application.
Everything in one picture.
🔹 Features
Strict adherence to the rules: Follows the Original Gann Swing Chart Rules to detect swing points.
Fractal analysis: Uses trend bars and fractal analysis to identify swing points.
Robust functionality: Engineered to handle complex market conditions with advanced logic.
Custom alerts: Alerts for peak/valley completion, main and primary trend reversals & continuations.
Golden rule application: Filters out non-trend bars by comparing only with the last trend bar.
Reversal & trend detection: Applies eight outside bar rules to detect trend reversals and continuations.
Dynamic customization: Fully customizable settings.
🔹 Settings overview
Fine-tune the indicator to match your unique trading strategy by adjusting trend settings, customizing alerts, and modifying visualization options.
1. Main trend settings
Hide/Show Main trend options: Instantly hide all main trend options (alerts remain separate).
Main trendline display & alerts: Toggle trendline visibility and set alerts for peaks and valleys.
Trendline customization: Adjust styles, colors, and slopes for upward/downward trends.
Peaks & Valleys markers: Show/hide points and customize their color and size.
Opposite Main trend turning points: Enable alerts and modify style, width, color, and offset.
Breakout/Breakdown points: Set alerts and customize their appearance.
2. Primary trend settings
Hide/Show primary trend options: Instantly hide all primary trend options (alerts remain separate).
Primary trendline display & alerts: Toggle trendline visibility and set alerts for peaks and valleys.
Trendline customization: Adjust styles, colors, and slopes for upward/downward trends.
Peaks & Valleys markers: Show/hide points and customize their color and size.
Opposite primary trend turning points: Enable alerts and modify style, width, color, and offset.
Breakout/Breakdown points: Set alerts and customize their appearance.
3. Additional options
Tooltips display: Control tooltip visibility for labels and languages.
Candle/Bar coloring: Customize candle and bar colors based on algorithm-selected trends.
🔸 Additional features
🔹Custom reading of bars.
The arrow represents the direction of the slope, the dot is the type of trend, and the line is the closing price.
🔹 Advanced Moving Average Activator
The Advanced Moving Average Activator, this setting calculates the average closing prices of trend bars only, which are the only bars considered by Gann.
The advantage of this method is that it helps avoid hidden bars that are not accounted for, making the difference more evident in a ranging market. The values are updated only when new highs or lows occur.
Additionally, you can set alerts when the price closes above or below the moving average.
🔹 Bar Counter
After a trend change, you can see exactly when the shift occurred and customize the type of trend you want to track.
For example, by conducting your own research on the assets you trade, based on historical data, you might discover valuable insights, such as the primary trend possibly lasting longer than 20 bars!
You can use these insights to refine your trading strategy and make more data-driven decisions.
🔹 How to use
Step 1: Configure the settings and choose your trading approach
Adjust the indicator settings to match your trading style and market conditions.
Effectively using the indicator starts with selecting your preferred trading style.
You can trade in alignment with the primary trend, capitalize on market reversals, or take advantage of breakouts.
Trading with the primary trend: Best for traders who prefer longer-term positions with higher stability.
Trading reversals: Ideal for those looking to enter at potential turning points but requires additional confirmation.
Trading breakouts: Suitable for traders targeting strong price movements after key level breakouts.
Adapting to market volatility: Monitor changing volatility and adjust your strategy accordingly for optimal results.
Step 2: Analyze the chart
Apply the indicator to your TradingView chart and interpret swing signals for informed decisions.
Carefully study the chart patterns to detect subtle signals.
Check if similar signals worked well in past market conditions.
Use multi-timeframe analysis for a broader perspective.
Step 3: Trade with the primary trend
Utilize trend direction to align trades with prevailing market movements.
Always trade in the direction of the primary trend.
Confirm the trend direction using multiple indicators or by relying on the primary trend as confirmation!.
Avoid trading against strong market momentum.
Step 4: Identify entry signals
Use indicator signals to identify ideal trade entry points.
Look for confirmation before entering a trade.
Wait for clear signals to avoid false entries.
Practice on a demo account to build confidence in your entry strategy.
Step 5: Apply risk management
Define stop-loss and take-profit levels to protect your capital effectively.
Set stop-loss orders at strategic levels to limit potential losses.
Risk only a small percentage of your capital per trade.
Adjust risk levels based on your overall portfolio performance.
Step 6: Confirm with trend analysis
Validate trends using additional indicators for a higher probability of success.
Use complementary tools to confirm trend direction.
Monitor trend changes to adjust your strategy promptly.
Keep an eye on volume indicators for added confirmation.
Step 7: Execute the trade
Enter trades based on confirmed signals and predefined strategy rules.
Ensure all your criteria are met before executing a trade.
Stay disciplined and stick to your strategy.
Review market conditions right before execution.
Step 8: Monitor the trade
Track trade performance and make adjustments as necessary.
Keep an eye on market conditions throughout the trade.
Be ready to adjust your strategy if unexpected events occur.
Use trailing stops to secure profits while allowing for gains.
Step 9: Implement exit strategy
Close trades strategically based on your pre-established exit plan.
Plan your exit strategy in advance and adhere to it.
Consider partial exits to secure profits along the way.
Avoid emotional decisions when closing trades.
Step 10: Review performance
Analyze past trades to continuously refine and improve your strategy.
Regularly review and document your trades for insights.
Identify patterns in both your successes and mistakes.
Update your strategy based on comprehensive performance reviews.
🔹 Disclosure
While this script is useful and provides insight into market tops, bottoms, and trend trading, it's critical to understand that past performance is not necessarily indicative of future results and there are many more factors that go into being a profitable trader.
Gannanalysis

WD Gann: Vertical Lines for Predefined Days/Bars AgoThis Pine Script draws vertical lines on the chart at specific time intervals, inspired by WD Gann’s theories of time cycles . WD Gann, a famous trader, believed that market movements were influenced by predictable time cycles. This script enables traders to visualize these key time cycles on the chart by placing vertical lines at predefined intervals (in bars ago), helping to identify potential turning points in the market.
The time intervals used in this script are inspired by Gann’s work, as well as astrological and numerological principles , which many traders believe influence market behavior . You can customize which time intervals (such as 3, 7, 9, 21, etc.) you want to track by enabling or disabling specific vertical lines on the chart.
Key Features:
Time Cycles Based on Gann’s Theory: Draws vertical lines at significant time intervals such as 3, 7, 9, 21, 27 bars ago, which are commonly used by Gann traders.
Astrological & Numerological Significance: The predefined intervals also align with key numerological and astrological values, allowing for a broader perspective on market cycles.
Customizable Intervals: You can choose which time intervals to display by enabling or disabling checkboxes for each cycle, allowing flexibility in chart analysis.
Visual Labels: Each vertical line is labeled with its corresponding "bars ago" value, providing clear reference points for the selected time cycles.
What Users Can Do:
Track and analyze market movements based on time cycles that are significant to Gann’s theory, as well as numerological and astrological influences.
Enable or disable vertical lines for specific cycles, like the 3-bar cycle, 9-bar cycle, or 365-bar cycle, depending on the intervals that align with your trading strategy.
Combine with other technical analysis tools and Gann techniques (e.g., Gann Angles, Gann Fans, or Square of Nine) for a more comprehensive trading approach.
This tool is designed for traders who believe in the power of time cycles to influence market behavior, and is especially useful for predicting turning points or key price movements based on these cycles.

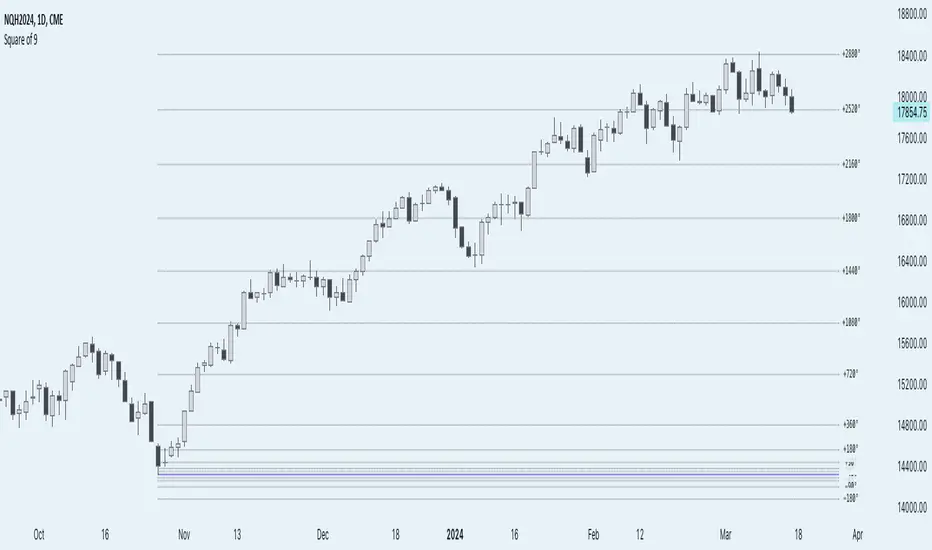
Anchored Square of 9 by AlgoCadosThe 'Anchored Square of 9 by AlgoCados' pine script indicator, leverages the non-discretionary, mathematical principles of W.D. Gann's Square of 9 for predicting vital support and resistance levels across all financial assets. Its mathematical precision and versatility make it a universally applicable tool, suitable for analysis of any financial asset without bias. Characterized by its adaptability to both high and low time frame analyses (HTF and LTF), this sophisticated indicator provides a structured, reliable method for market analysis, making it an essential asset for traders looking to apply a consistent and comprehensive approach across various market conditions and asset classes.
CME_MINI:NQH2024
Core Functionality
Anchored Price Point: The script allows users to define an anchor time and anchor point type (High, Low, Open, Close), serving as the basis for subsequent calculations. This flexibility enables precise adaptation to varying market conditions and analysis needs.
Angular Shifts and Projection: The indicator implements a range of angular shifts for LTF and HTF analyses, allowing for detailed and customizable projection of support and resistance levels. Angular shifts can range from 11.25° for finer intraday nuances up to 7200° for broader, long-term trend insights.
Mathematical Implementation
Anchor Point Selection: The script selects an anchor point based on user inputs for the anchor type and anchor time. This point serves as the basis for calculating deviations.
Angular Shift Calculation: The indicator calculates deviations by applying angular shifts to the square root of the anchor price. These deviations are used to project potential support and resistance levels.
Projection Lines and Labels: For each angular shift, the script generates projection lines and labels, which are dynamically adjusted as new data becomes available. This visual representation aids in identifying significant price levels.
CME_MINI:NQH2024
Key Features and Customization Options
Customizable Angular Shifts: Traders can enable or disable specific angular shifts to tailor the analysis to their trading strategy.
Projection Styles and Labels: Offers various styles (Solid, Dotted, Dashed) for equilibrium, upper shifts, and lower shifts lines, along with customizable label options (Levels, Prices, Levels + Prices) for enhanced clarity and information density.
Dynamic Labeling: Utilizes dynamic labeling for each projection line, indicating the angular degree and price level, facilitating a comprehensive understanding of potential market movements.
User-Friendly Inputs: Features user-defined inputs for anchor time and type, angular shifts, line styles, and labeling options, making the tool highly adaptable and intuitive.
Pine Script Technical Insight
Input Handling: The script incorporates a series of input controls to allow users to specify the anchor time, anchor type, and which angular shifts to display.
Line and Label Generation: Utilizes Pine Script's capabilities to dynamically generate and adjust projection lines and labels based on the calculated support and resistance levels.
Efficiency and Adaptability: Efficiently loops through a predefined set of angles, applying them to the anchored price point to calculate and project support and resistance levels, demonstrating the script's adaptability to both intraday and longer-term analysis.
Mathematical Formulation and Indicator Logic
Initial Setup and Inputs
The indicator starts by capturing user inputs for the anchor point—this can be a High, Low, Open, or Close price at a specified anchor time. These inputs determine the base price (P-base) from which all calculations are derived.
High if Anchor Type = "High"
Low if Anchor Type = "Low"
Open if Anchor Type = "Open"
Close if Anchor Type = "Close"
Angular Shifts and Projection Basis
The core of the "Anchored Square of 9" methodology involves calculating support and resistance levels through angular shifts applied to the Price-base (P-base).
The indicator enables a series of angular shifts, specified by the user, to project these levels dynamically.
Angular shifts are interpreted through the lens of Gann's theory, with each degree corresponding to a potential market turn or equilibrium point.
The script translates these angles into actionable projections using the square root of the anchor price, then applies the angular coefficients to find deviation points.
Angular Coefficients and Pi
In the context of the "Anchored Square of 9" indicator, angular shifts are crucial for projecting potential support and resistance levels. These shifts are quantified by angular coefficients derived from geometric principles, specifically leveraging the relationship between angles in degrees and their radian counterparts using π (Pi). Here's how angular coefficients are integrated:
Pi Reference for Angular Shifts: Given that 360° equates to 2π radians, angular coefficients (θ) for the indicator are calculated by translating degrees into a radian measure and then applying this measure to modify the square root of the base price (P-base).
Example of Angular Coefficients Shift:
A 180° shift corresponds to π radians. In the indicator's formula, this would translate to an angular coefficient of 1, since 180° = π in terms of π. Thus, applying this angular shift involves adding or subtracting 1 from the square root of P-base and then squaring the result to project a new price level.
Similarly, a 90° shift, equating to π/2, would have an angular coefficient equivalent to 0.5, reflecting its proportion of the circle (or square, in the context of Gann's geometry).
Implementation in Calculation of Deviations
Incorporating π into the formula for calculating deviations enriches the indicator's mathematical foundation, providing a direct link to geometric principles:
For each selected angular shift (θ), the script calculates positive and negative deviations from the square root of the anchor price. These deviations represent potential support and resistance levels.
P± = round (( sqrt root (P-base) ± θ)²)
Where:
P ± represents the calculated price levels for support (-) and resistance levels (+);
θ is the angular coefficient derived from the user-selected angular shifts;
sqrt root (P-base) is the square root of the base price;
round (⋅) ensures that the calculated levels are adjusted to the nearest tick size, maintaining relevance to actual trading scenarios.
Dynamic Projections and Visualization
The script generates lines and labels for these calculated levels, dynamically extending them as new market data becomes available. This feature ensures that traders have the most current and relevant information for decision-making.
For visualization:
Equilibrium Lines: Drawn at P-base to indicate the anchor or equilibrium point.
Support and Resistance Lines: Drawn at P- and P+, respectively, showing potential levels of market reaction
CME_MINI:NQH2024
Labeling and Style Customization
The indicator provides extensive customization for the appearance of projection lines and labels. Traders can select the line style, color, and text information (levels, prices, or both) to be displayed, tailoring the visual output to their preferences and trading strategy.
Implementation Details
This detailed approach to calculating support and resistance levels showcases the indicator's adherence to Gann's principles while leveraging modern computational methods to enhance trading analysis. By translating angular shifts into quantifiable projections, the "AlgoCados x Anchored Square of 9" indicator offers a powerful tool for identifying potential market movements with high precision.
The Pine Script implementation encapsulates this complex logic within a user-friendly interface, allowing traders to harness advanced analytical techniques within the TradingView platform. Through dynamic calculation and visualization, the indicator equips users with a deep understanding of market structures, enabling informed trading decisions based on mathematical projections.
Conclusion
The 'Anchored Square of 9 by AlgoCados' indicator merges mathematical precision with trading intuition, offering an advanced tool for traders seeking to leverage the time-tested principles of W.D. Gann's Square of 9. With its comprehensive set of features and customization options, it stands as a powerful addition to the TradingView platform, designed to enhance market analysis and decision-making for traders at all levels.
Embrace the essence of smarter trading where every insight is "Healthy For Your Trading."
Gann swings [promuckaj]This indicator is a tool that could help the users what the market trend is at any time, based on legendary trader, Mr. William D. Gann .
Gann it self called this the “Trendline Indicator”, but modern traders call it Swing.
Gann’s primary use his techniques in correlation with this trading tool helping him achieve his phenomenal trading results.
Gann swings automatically displays the swing chart and trend on any timeframe you choose. There is option to set desired color and width of the trend line.
There is 3 types of settings to determine the swings, from 1 to 3 which represent the number of bars as confirmation for the swing bar. Default is 2.
There is labels on bars that gives information about each bar, is it up, down, inside or outside bar. This can be turned off/on.
🡱 - Up bar
🡳 - Down bar
⬍ - Outside bar
x - Inside bar
Indicator is also fully customizable to display break-out lines, which indicate potential trend changes ahead of time. There is option to choose whether you want to mark only first breaks in a row or you want all of them in case there is multiple ones in the same direction.
Gann swings is an indicator that EVERY trader and investor should have, it can provide vital information that can help to determine the trend of any market and information about the upswings and downswings.
Everyone enjoy trading !
P.S.:
I have in my mind some additional features as upgrade that can include data about each swing, like data for tops/bottoms date, time, price, range in % between swings, and bar count of each swing that is formed on the chart.

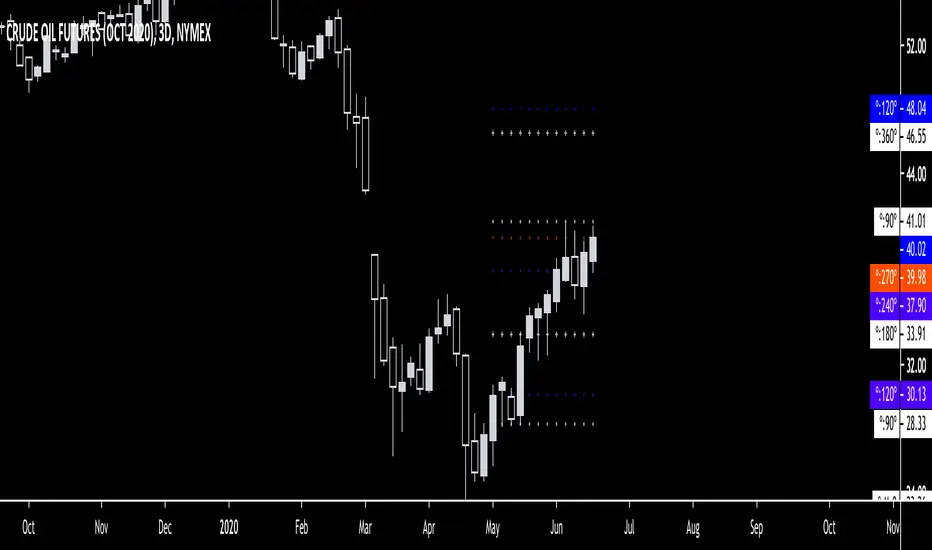
Gann Intraday Retracement Levels, by PVSharmaOne of the greatest technical analyst the world has seen, was The Legendary William Delbert Gann. He had simple, creative principles based on astronomical computations. Although he wasn't an intraday trader, his theories produced outcomes that are just as impressive as delivery trading.
On the basis of his approach, I have created an indicator based on intraday trades that offers high profits at extremely brief stop-losses.
This indicator has been well evaluated, and I can declare with confidence that its excellent performance are based on "buy at dip and sell on peak" principle. Although this indicator has been tested, it does not perform well enough in some instruments, such as Forex, some cryptocurrencies, and a few international commodities.
Please take note that this indicator is excellent for speculating on NSE indexes and is applicable to practically all NSE instruments (apart from Forex). I'm also working on several errors, that I plan to remedy and present to you in the near future

Magic levelsIt is by far the simplest on chart presentation of Gann square of 9. It calculates the levels based on previous day closing. These levels usually acts as support and resistance.

Gann Seasonal Dates V1.1Gann Seasonal Dates
// ========================================================================//
This script helps you spot important events in the market using Gann seasonal dates and cycles
This script inludes 4 major seasonal dates and 6 minor seasonal dates. All of which are very powerful if you are a time trader.
This script also complements the Gann ToolBox that I have on my tradingview page giving you good measurement of the market and some of its volatility dates.
// ========================================================================//
To get access to this add-on or for the full package including the toolbox you can see my information below.

GannLevelsHow to setup
This script gives ability to quickly add Gann levels on the chart. After adding this indicator on the chart, click setting and set base level. The base-level could be any number in Gann square.
This script will automatically calculate 7 levels below & above the base level. Each level will be at an angle of 22.5 deg in Gann square.
How to trade
This script will draw significant Gann levels on the chart. One may use this like a pivot level to trade.
Work of caution
This script is just an additional help to take trading discussion. This script does not give any buy or sell signals.
Let me know your feedback.

Gann Square Of 9 LevelsThis script uses the last hlc3 value of 1H, 4H, D and/or W and rotates it 360º up/down with four increments of 90º to find out potential support and resistance areas. Can be used as a dynamic support & resistance tool or just to gauge how overbought/oversold the market is. Special thanks to @Nv56 for his assistance in writing this script.