Unfilled ImbalancesUNFILLED IMBALANCES TRACKER - IDENTIFY HIGH-PROBABILITY REVERSAL ZONES
This advanced indicator automatically detects and tracks unfilled price imbalances (Fair Value Gaps/FVGs) between candle bodies, providing traders with crucial levels where price is likely to return.
METHODOLOGY
This indicator employs an approach to imbalance detection that differs from standard FVG indicators:
1. Body-to-Body Gap Detection: Unlike typical FVG indicators that use wicks, this system exclusively tracks gaps between candle bodies, filtering out noise and focusing on the most significant price inefficiencies.
2. Dynamic Partial Fill Tracking: Our unique algorithm continuously monitors and adjusts imbalance zones as they're partially filled, showing exactly how much of each gap remains unfilled in real-time. This feature helps traders identify the strongest remaining levels.
3. Dual Fill Detection Logic: Proprietary fill detection offers two distinct modes - Distal (gap filled when touched) and Through (requires complete price movement through the entire gap), allowing adaptation to different market behaviors.
KEY FEATURES
Real-Time Imbalance Detection
Identifies body-to-body gaps between consecutive candles
Tracks both bullish and bearish imbalances
Automatically removes filled imbalances from the chart
Advanced Fill Detection Modes
Distal Mode: Imbalance considered filled when price touches the near edge
Through Mode: Requires price to completely trade through the gap
Body Fill Option: Requires candle body (not just wick) to enter the gap zone
Partial Fill Visualization
Watch imbalances shrink in real-time as price partially fills them
Visual representation shows exact percentage of gap remaining
Critical for position sizing and risk management
Flexible Display Options
Full Box Mode: Shows complete imbalance zones
Line Mode: Displays only critical edge levels for cleaner charts
Customizable visual parameters (colors, transparency, line thickness)
Smart Extension Features
Auto-extends visual elements to current price bar
Optional extension into future (0-500 bars)
Statistics table showing active imbalances count and fill rates
TRADING METHODOLOGY
Unfilled imbalances represent areas where price moved too quickly, leaving behind inefficiencies that markets tend to revisit. This indicator helps identify:
High-probability entry zones for trend continuation trades
Logical take profit targets at unfilled gaps
Stop loss placement beyond strong imbalance zones
Market structure breaks when key imbalances are filled
Supply and demand zone identification
HOW TO USE
Apply the indicator to any timeframe (works best on 15m and above)
Configure fill detection mode based on your trading style
Watch for price approaching unfilled imbalance zones
Use partial fill information to gauge zone strength
Combine with your existing strategy for confirmation
TARGET AUDIENCE & BEST PRACTICES
This tool is designed for traders who understand price action and market structure. It works best on:
Liquid instruments with consistent volume
Trending markets where imbalances are more likely to be revisited
Higher timeframes for more reliable signals
LIMITATIONS & CONSIDERATIONS
Imbalances may not always be filled, especially in strong trending markets
Performance varies across different market conditions and instruments
Should be used in conjunction with other analysis methods, not as a standalone system
Gap detection is based on candle closes and may miss intrabar movements
Historical imbalances from many bars ago may lose relevance
SETTINGS EXPLANATION
The indicator includes multiple customization options:
Require Body Fill: Controls whether wicks or bodies must enter gaps
Fill Detection Mode: Choose between Distal or Through modes
Visual Display: Select between boxes or lines
Alert Configuration: Set minimum age before fill alerts trigger
Debug Mode: Learn how the algorithm works with visual feedback
This indicator represents months of research into price inefficiency patterns and provides a systematic approach to identifying and tracking these critical market levels.
Note: Works on all timeframes and markets. Best results on liquid instruments with consistent volume patterns.
Gaptrading

52SIGNAL RECIPE CME Gap Support & Resistance Detector═══ 52SIGNAL RECIPE CME Gap Support & Resistance Detector ═══
◆ Overview
The 52SIGNAL RECIPE CME Gap Support & Resistance Detector is an advanced technical indicator that automatically detects and visualizes all types of price gaps occurring in the CME Bitcoin futures market on trading charts. It captures not only gaps formed during weekend and holiday closures, but also those created during the daily 1-hour maintenance period on weekdays, and sudden price gaps resulting from economic indicator releases or news events.
The core value of this indicator lies beyond simply displaying gaps; it visualizes how these price discontinuities act as powerful support and resistance zones that influence future price movements. In real markets, these CME gaps have a high probability of either being "filled" or functioning as important reaction zones, providing traders with valuable entry and exit signals.
─────────────────────────────────────
◆ Key Features
• Comprehensive Gap Detection: Detects gaps in all market conditions
- Weekend/holiday closure gaps
- Weekday 1-hour maintenance period gaps
- Gaps from economic indicators/news events causing rapid price changes
• Intuitive Color Coding:
- Blue: When gaps act as support (price is above the gap)
- Red: When gaps act as resistance (price is below the gap)
- Gray: Filled gaps (price has completely passed through the gap area)
• Real-time Role Switching: Automatically changes colors as price moves above/below gaps, visualizing support↔resistance role transitions
• Status Tracking System: Automatically tracks whether gaps are "Filled" or "Unfilled"
• Dynamic Boxes: Clearly marks gap areas with boxes and dynamically changes colors based on price movement
• Precise Labeling: Accurately displays the price range of each gap to support trader decision-making
• Smart Filtering: Improved algorithm that solves consecutive gap detection issues for complete gap tracking
• Key Usage Points:
- Pay special attention when price approaches gap areas
- Color changes in gaps signal important market sentiment shifts
- Areas with multiple clustered gaps are particularly strong reaction zones
─────────────────────────────────────
◆ User Guide: Understanding Gap Roles Through Colors
■ Color System Interpretation
• Blue Gaps (Support Role):
▶ Meaning: Current price is above the gap, making the gap act as support
▶ Trading Application: Consider buying opportunities when price approaches blue gap areas
▶ Psychological Meaning: Buying pressure likely to increase at this price level
• Red Gaps (Resistance Role):
▶ Meaning: Current price is below the gap, making the gap act as resistance
▶ Trading Application: Consider selling opportunities when price approaches red gap areas
▶ Psychological Meaning: Selling pressure likely to increase at this price level
• Gray Gaps (Filled Gaps):
▶ Meaning: Price has completely passed through the gap area, filling the gap
▶ Reference Value: Still valuable as reference for past important reaction zones
▶ Trading Application: Used to confirm trend strength and identify key psychological levels
■ Understanding Color Transitions
• Blue → Red Transition:
▶ Meaning: Price has fallen below the gap, changing its role from support to resistance
▶ Market Interpretation: Breakdown of previous support strengthens bearish signals
▶ Trading Application: Consider potential further decline; check gap bottom as resistance during bounces
• Red → Blue Transition:
▶ Meaning: Price has risen above the gap, changing its role from resistance to support
▶ Market Interpretation: Breakout above previous resistance strengthens bullish signals
▶ Trading Application: Consider potential further rise; check gap top as support during pullbacks
─────────────────────────────────────
◆ Practical Application Guide
■ Basic Trading Scenarios
• Blue Gap Support Strategy:
▶ Entry Point: When price approaches the top of a blue gap and forms a bounce candle
▶ Stop Loss: Below the gap bottom (if price completely breaks down through the gap)
▶ Take Profit: Previous swing high or next resistance level above
▶ Probability Enhancers: Gap aligned with major moving averages, oversold RSI, strong bounce candle pattern
• Red Gap Resistance Strategy:
▶ Entry Point: When price approaches the bottom of a red gap and forms a rejection candle
▶ Stop Loss: Above the gap top (if price completely breaks up through the gap)
▶ Take Profit: Previous swing low or next support level below
▶ Probability Enhancers: Gap aligned with major moving averages, overbought RSI, strong rejection candle pattern
■ Advanced Pattern Applications
• Multiple Gap Cluster Identification:
▶ Several gaps in close price proximity form extremely powerful support/resistance zones
▶ Same-color gap clusters: Very strong single-direction reaction zones
▶ Mixed-color gap clusters: High volatility zones with bidirectional reactions expected
• Gap Sequence Analysis:
▶ Consecutive same-direction gaps: Strong trend confirmation signal
▶ Increasing gap size pattern: Trend acceleration signal
▶ Decreasing gap size pattern: Trend weakening signal
• News/Indicator Release Gap Utilization:
▶ Gaps formed immediately after economic indicators: Measure market shock intensity
▶ Gap color change observation: Track market reinterpretation of news
▶ Gap filling speed analysis: Evaluate news impact duration
• Key Attention Points:
▶ Pay special attention to the chart whenever price approaches gap areas
▶ Gap color changes signal important market sentiment shifts
▶ Areas with multiple concentrated gaps are likely to show strong price reactions
─────────────────────────────────────
◆ Technical Foundation
■ CME Gap Formation Principles
• Key Gap Formation Scenarios:
▶ Weekend Closures (Friday close → Monday open): Most common CME gap formation point
▶ Holiday Closures: Gaps occurring due to CME closures on US holidays
▶ Weekday 1-hour Maintenance: Gaps during daily CME maintenance period (16:00-17:00 CT)
▶ Major Economic Indicator Releases: Gaps from rapid price changes during US employment reports, FOMC decisions, CPI releases, etc.
▶ Significant News Events: Gaps from regulatory announcements, geopolitical events, market shocks, etc.
• Psychological Importance of Gaps:
▶ Zones where price formation did not occur, representing imbalance between buying/selling forces
▶ Gap areas have no actual trading, resulting in accumulated potential orders
▶ Reflect institutional investor positions and liquidity distribution in the CME futures market
■ Support/Resistance Mechanism
• Psychological Level Formation Mechanism:
▶ Unexecuted order accumulation in gap areas: Loss of ordering opportunity at those price levels
▶ Liquidity imbalance: No trading occurred in gap areas, creating liquidity voids
▶ Institutional activity: Institutional participants in CME futures markets pay attention to these gap areas
• Evidence of Support/Resistance Function:
▶ Statistical gap fill phenomenon: Most gaps eventually "fill" (price returns to gap area)
▶ Gap-based reactions: Increased frequency of price reactions (bounces/rejections) when reaching gap areas
▶ Market psychology impact: Influences traders' perceived value and fair price assessment
─────────────────────────────────────
◆ Advanced Configuration Options
■ Visualization Settings
• Show Gap Labels (Default: On)
▶ On: Displays price ranges of each gap numerically for precise support/resistance level identification
▶ Off: Hides labels for visual cleanliness
• Color Settings
▶ Filled Gap Color: Gray tones, shows gaps already traversed by price
▶ Unfilled Gap Color - Support: Blue, shows gaps currently acting as support
▶ Unfilled Gap Color - Resistance: Red, shows gaps currently acting as resistance
■ Data Management Settings
• Filled Gap Storage Limit (Default: 10)
▶ Sets maximum number of filled gaps to retain on chart
▶ Recommended settings: Short-term traders (5-8), Swing traders (8-12), Position traders (10-15)
• Maximum Gap Retention Period (Default: 12 months)
▶ Sets period after which old unfilled gaps are automatically removed
▶ Recommended settings: Short-term analysis (3-6 months), Medium-term analysis (6-12 months), Long-term analysis (12-24 months)
─────────────────────────────────────
◆ Synergy with Other Indicators
• Volume Profile: Greatly increased reaction probability when CME gaps align with Volume Profile value areas
• Fibonacci Retracements: Formation of powerful reaction zones when major Fibonacci levels coincide with gap areas
• Moving Averages: Areas where major moving averages overlap with CME gaps act as "composite support/resistance"
• Horizontal Support/Resistance: Very strong price reactions expected when historical key price levels align with CME gaps
• Market Sentiment Indicators (RSI/MACD): Assess reaction probability by checking oversold/overbought conditions when price approaches gap areas
─────────────────────────────────────
◆ Conclusion
The 52SIGNAL RECIPE CME Gap Support & Resistance Detector is not merely a gap display tool, but an advanced analytical tool that visualizes important support/resistance areas where price may strongly react, using intuitive color codes (blue=support, red=resistance). It detects all types of gaps without omission, whether from weekend and holiday closures, weekday 1-hour maintenance periods, important economic indicator releases, or market shock situations.
The core value of this indicator lies in clearly expressing through intuitive color coding that gaps are not simple price discontinuities, but psychological support/resistance areas that significantly influence future price action. Traders can instantly identify areas where blue gaps act as support and red gaps act as resistance, enabling quick and effective decision-making.
By referencing the color codes when price approaches gap areas to predict possible price reactions, and especially interpreting color transition moments (blue→red or red→blue) as signals of important market sentiment changes and integrating them into trading strategies, traders can capture higher-probability trading opportunities.
─────────────────────────────────────
※ Disclaimer: Like all trading tools, the CME Gap Detector should be used as a supplementary indicator and not relied upon alone for trading decisions. Past gap reaction patterns cannot guarantee the same behavior in the future. Always use appropriate risk management strategies.
═══ 52SIGNAL RECIPE CME Gap Support & Resistance Detector ═══
◆ 개요
52SIGNAL RECIPE CME Gap Support & Resistance Detector는 CME 비트코인 선물 시장에서 발생하는 모든 유형의 가격 갭(Gap)을 자동으로 감지하여 트레이딩 차트에 시각화하는 고급 기술적 지표입니다. 주말과 공휴일 휴장은 물론, 평일 1시간 휴장 시간, 그리고 중요 경제지표 발표나 뉴스 이벤트 시 발생하는 급격한 가격 갭까지 누락 없이 포착합니다.
이 인디케이터의 핵심 가치는 단순히 갭을 표시하는 것을 넘어, 이러한 가격 불연속성이 미래 가격 움직임에 영향을 미치는 강력한 지지(Support)와 저항(Resistance) 영역으로 작용한다는 원리를 시각화하는 데 있습니다. 실제 시장에서 이러한 CME 갭은 높은 확률로 미래에 "매꿔지거나" 중요한 반응 구간으로 기능하여 트레이더에게 귀중한 진입/퇴출 신호를 제공합니다.
─────────────────────────────────────
◆ 주요 특징
• 전방위 갭 감지: 모든 시장 조건에서 발생하는 갭을 감지
- 주말/공휴일 휴장 갭
- 평일 1시간 휴장 시간 갭
- 경제지표/뉴스 이벤트 시 급격한 가격 변동 갭
• 직관적 색상 구분:
- 파란색: 갭이 지지 역할을 할 때(가격이 갭 위에 있을 때)
- 빨간색: 갭이 저항 역할을 할 때(가격이 갭 아래에 있을 때)
- 회색: 이미 매꿔진 갭(가격이 갭 영역을 완전히 통과)
• 실시간 역할 전환: 가격이 갭 위/아래로 이동함에 따라 지지↔저항 역할 전환을 자동으로 색상 변경으로 시각화
• 상태 추적 시스템: 갭이 "매꿔짐(Filled)" 또는 "매꿔지지 않음(Unfilled)" 상태를 자동 추적
• 다이나믹 박스: 갭 영역을 명확한 박스로 표시하고 가격 움직임에 따라 동적으로 색상 변경
• 정밀 레이블링: 각 갭의 가격 범위를 정확히 표시하여 트레이더의 의사결정 지원
• 스마트 필터링: 연속적 갭 감지 문제를 해결하는 개선된 알고리즘으로 누락 없는 갭 추적
• 핵심 활용 포인트:
- 가격이 갭 영역에 접근할 때 특별히 주목하세요
- 갭 색상 변경 시점은 중요한 시장 심리 변화 신호입니다
- 여러 갭이 밀집된 영역은 특히 강한 반응이 예상되는 구간입니다
─────────────────────────────────────
◆ 사용 가이드: 색상으로 이해하는 갭 역할
■ 색상 시스템 해석법
• 파란색 갭 (지지 역할):
▶ 의미: 현재 가격이 갭 위에 있어 갭이 지지선으로 작용
▶ 트레이딩 응용: 가격이 파란색 갭 영역으로 하락 접근 시 매수 기회 고려
▶ 심리적 의미: 매수세력이 이 가격대에서 수요 증가 가능성
• 빨간색 갭 (저항 역할):
▶ 의미: 현재 가격이 갭 아래에 있어 갭이 저항선으로 작용
▶ 트레이딩 응용: 가격이 빨간색 갭 영역으로 상승 접근 시 매도 기회 고려
▶ 심리적 의미: 매도세력이 이 가격대에서 공급 증가 가능성
• 회색 갭 (매꿔진 갭):
▶ 의미: 가격이 갭 영역을 완전히 통과하여 갭이 매꿔진 상태
▶ 참조 가치: 과거 중요 반응 구간으로 여전히 참고 가치 있음
▶ 트레이딩 응용: 추세 강도 확인 및 주요 심리적 레벨 식별에 활용
■ 색상 전환 이해하기
• 파란색 → 빨간색 전환:
▶ 의미: 가격이 갭 아래로 하락하여 갭이 지지에서 저항으로 역할 변경
▶ 시장 해석: 이전 지지선 붕괴로 약세 신호 강화
▶ 트레이딩 응용: 추가 하락 가능성 고려, 반등 시 갭 하단 저항 확인
• 빨간색 → 파란색 전환:
▶ 의미: 가격이 갭 위로 상승하여 갭이 저항에서 지지로 역할 변경
▶ 시장 해석: 이전 저항선 돌파로 강세 신호 강화
▶ 트레이딩 응용: 추가 상승 가능성 고려, 조정 시 갭 상단 지지 확인
─────────────────────────────────────
◆ 실전 활용 가이드
■ 기본 트레이딩 시나리오
• 파란색 갭 지지 전략:
▶ 진입 시점: 가격이 파란색 갭 상단에 접근하여 반등 캔들 형성 시
▶ 손절 위치: 갭 하단 아래(갭 완전히 하향 돌파 시)
▶ 이익실현: 이전 스윙 고점 또는 상방 다음 저항선
▶ 확률 증가 조건: 갭과 주요 이동평균선 일치, 과매도 RSI, 강한 반등 캔들
• 빨간색 갭 저항 전략:
▶ 진입 시점: 가격이 빨간색 갭 하단에 접근하여 거부 캔들 형성 시
▶ 손절 위치: 갭 상단 위(갭 완전히 상향 돌파 시)
▶ 이익실현: 이전 스윙 저점 또는 하방 다음 지지선
▶ 확률 증가 조건: 갭과 주요 이동평균선 일치, 과매수 RSI, 강한 거부 캔들
■ 고급 패턴 활용법
• 다중 갭 클러스터 식별:
▶ 여러 갭이 근접한 가격대에 있다면 더욱 강력한 지지/저항 존
▶ 동일 색상 갭 클러스터: 매우 강력한 단일 방향 반응 구간
▶ 색상 혼합 갭 클러스터: 심한 변동성과 양방향 반응 예상 구간
• 갭 시퀀스 분석:
▶ 연속적인 동일 방향 갭: 강한 추세 확인 신호
▶ 갭 크기 증가 패턴: 추세 가속화 신호
▶ 갭 크기 감소 패턴: 추세 약화 신호
• 뉴스/지표 발표 후 갭 활용:
▶ 경제지표 발표 직후 형성된 갭: 시장 충격 강도 측정
▶ 갭 색상 변화 관찰: 시장의 뉴스 재해석 과정 파악
▶ 갭 매꿈 속도 분석: 뉴스 임팩트의 지속성 평가
• 핵심 주목 포인트:
▶ 가격이 갭 영역에 접근할 때마다 차트를 특별히 주목하세요
▶ 갭 색상이 변경되는 시점은 중요한 시장 심리 변화를 의미합니다
▶ 여러 갭이 밀집된 영역은 가격이 강하게 반응할 가능성이 높습니다
─────────────────────────────────────
◆ 기술적 기반
■ CME 갭의 발생 원리
• 주요 갭 발생 상황:
▶ 주말 휴장 (금요일 종가 → 월요일 시가): 가장 일반적인 CME 갭 형성 시점
▶ 공휴일 휴장: 미국 공휴일에 따른 CME 휴장 시 발생
▶ 평일 1시간 휴장: CME 시장의 일일 정비 시간(16:00~17:00 CT) 동안 발생
▶ 주요 경제지표 발표: 미 고용지표, FOMC 결정, CPI 등 발표 시 급격한 가격 변동으로 인한 갭
▶ 중요 뉴스 이벤트: 규제 발표, 지정학적 이벤트, 시장 충격 등으로 인한 급격한 가격 변화
• 갭의 심리적 중요성:
▶ 가격 형성이 이루어지지 않은 구간으로, 매수/매도 세력의 불균형 영역
▶ 갭 구간에는 실제 거래가 없었기 때문에 잠재적 주문이 누적되는 영역
▶ 기관 투자자들의 선물 포지션과 유동성 분포가 반영된 중요한 가격 레벨
■ 지지/저항으로 작용하는 원리
• 심리적 레벨 형성 메커니즘:
▶ 갭 구간의 미실행 주문 축적: 갭 발생 시 해당 가격대에 대한 주문 기회 상실
▶ 유동성 불균형: 갭 구간에는 거래가 없었으므로 유동성 공백 발생
▶ 기관 투자자 활동: CME 선물 시장의 기관 참여자들은 이러한 갭 영역에 관심
• 지지/저항 작용 증거:
▶ 통계적 갭 필 현상: 대부분의 갭은 미래에 "매꿔짐"(가격이 갭 구간으로 회귀)
▶ 갭 기반 반응: 갭 영역에 도달 시 가격 반응(반등/거부) 발생 빈도 증가
▶ 시장 심리 영향: 트레이더들의 인지된 가치와 공정가격 평가에 영향
─────────────────────────────────────
◆ 고급 설정 옵션
■ 시각화 설정
• 라벨 표시 설정 (Show Gap Labels) (기본값: 켜짐)
▶ 켜짐: 각 갭의 가격 범위를 숫자로 표시하여 정확한 지지/저항 레벨 확인
▶ 꺼짐: 시각적 깔끔함을 위해 라벨 숨김
• 색상 설정
▶ 매꿔진 갭 색상(Filled Gap Color): 회색 계열, 이미 가격이 통과한 갭 표시
▶ 미매꿔진 갭 색상 - 지지(Support): 파란색, 현재 지지 역할을 하는 갭
▶ 미매꿔진 갭 색상 - 저항(Resistance): 빨간색, 현재 저항 역할을 하는 갭
■ 데이터 관리 설정
• 매꿔진 갭 저장 한도 (Filled Gap Storage Limit) (기본값: 10)
▶ 이미 매꿔진 갭을 최대 몇 개까지 차트에 유지할지 설정
▶ 권장 설정: 단기 트레이더(5-8), 스윙 트레이더(8-12), 포지션 트레이더(10-15)
• 최대 갭 보관 기간 (Maximum Gap Retention Period) (기본값: 12개월)
▶ 오래된 미매꿔진 갭을 자동으로 제거하는 기간 설정
▶ 권장 설정: 단기 분석(3-6개월), 중기 분석(6-12개월), 장기 분석(12-24개월)
─────────────────────────────────────
◆ 다른 지표와의 시너지
• 볼륨 프로파일: CME 갭과 볼륨 프로파일의 밸류 영역 일치 시 반응 확률 크게 증가
• 피보나치 리트레이스먼트: 주요 피보나치 레벨과 갭 영역 일치 시 강력한 반응 존 형성
• 이동평균선: 주요 이동평균선과 CME 갭이 겹치는 영역은 "복합 지지/저항"으로 작용
• 수평 지지/저항: 과거 중요 가격대와 CME 갭 일치 시 매우 강력한 가격 반응 예상 가능
• 시장 심리 지표(RSI/MACD): 갭 영역 접근 시 과매수/과매도 확인으로 반응 가능성 판단
─────────────────────────────────────
◆ 결론
52SIGNAL RECIPE CME Gap Support & Resistance Detector는 단순한 갭 표시 도구가 아닌, 가격이 강하게 반응할 수 있는 중요한 지지/저항 영역을 직관적인 색상 코드(파란색=지지, 빨간색=저항)로 시각화하는 고급 분석 도구입니다. 주말과 공휴일 휴장 시간뿐만 아니라, 평일 1시간 휴장 시간, 중요 경제지표 발표, 그리고 시장 충격 상황에서 발생하는 모든 유형의 갭을 누락 없이 감지합니다.
인디케이터의 핵심 가치는 갭이 단순한 가격 불연속성이 아닌, 미래 가격 행동에 중요한 영향을 미치는 심리적 지지/저항 영역임을 직관적인 색상 코드로 명확히 표현하는 데 있습니다. 파란색 갭은 지지 역할을, 빨간색 갭은 저항 역할을 하는 영역을 즉각적으로 식별할 수 있어 트레이더가 빠르고 효과적인 의사결정을 내릴 수 있도록 도와줍니다.
갭 영역에 접근할 때마다 색상 코드를 참고하여 가능한 가격 반응을 예측하고, 특히 색상 전환이 일어나는 순간(파란색→빨간색 또는 빨간색→파란색)은 중요한 시장 심리 변화 신호로 해석하여 트레이딩 전략에 통합한다면, 더 높은 확률의 거래 기회를 포착할 수 있을 것입니다.
─────────────────────────────────────
※ 면책 조항: 모든 트레이딩 도구와 마찬가지로, CME Gap Detector는 보조 지표로 사용되어야 하며 단독으로 거래 결정을 내리는 데 사용해서는 안 됩니다. 과거의 갭 반응 패턴이 미래에도 동일하게 작용한다고 보장할 수 없습니다. 항상 적절한 리스크 관리 전략을 사용하세요.

Gap Finder Pro (incl. Island Gaps)Hello Traders!
Unlock the power of gap trading with Gap Finder Pro , a comprehensive tool designed to identify, analyze, and visualize price gaps in any market. This advanced indicator goes beyond simple gap detection, offering you a wealth of features to enhance your gap trading strategies.
Key Features
Precise gap detection for both up and down gaps
Island gap identification and analysis
Detailed statistics for data-driven decision making
Customizable visual elements for clear chart analysis
Flexible settings to adapt to various trading styles and timeframes (works on daily and intraday charts)
Understanding and Trading Gaps
Price gaps occur when an asset opens at a different price than its previous close, creating a blank space on the chart. Gaps can signal significant market sentiment shifts and often present lucrative trading opportunities. Gap Finder Pro helps you capitalize on these opportunities
Island Gaps: A Powerful Trading Signal
Island gaps, a rare but potent chart pattern, occur when a gap is followed by a period of price consolidation and then another gap in the opposite direction. The indicator automatically detects and highlights these formations, allowing you to spot potential trend reversals or continuation patterns quickly.
Comprehensive Statistics
Make data-driven decisions with the built-in statistics panel. Analyze:
Total number of gaps (up and down)
Average and median gap sizes
Gap fill rates and average time to fill
Percentage of gaps filled within specific timeframes
Breakdown of gap types (standard vs. island)
These statistics empower you to understand market behavior better and refine your gap trading strategies over time.
Trading Strategies
Island Gap Reversals: Capitalize on the powerful reversal signals provided by island gaps.
Breakout Trading: Look for gaps in a V-formation as potential signs of strong trend continuation.
Gap Fill Trading: Use the indicator to identify unfilled gaps and set targets for potential mean reversion trades.
(For example, enter short for a up gap fill if a down candle closes below the previous candle's low.)
Statistical Edge: Leverage the comprehensive statistics to develop gap-based trading systems.
Whether you're a seasoned gap trader or looking to incorporate gap analysis into your trading strategy, Gap Finder Pro provides the tools and insights you need to make informed decisions in any market condition. Elevate your trading with this powerful, all-encompassing gap analysis indicator.

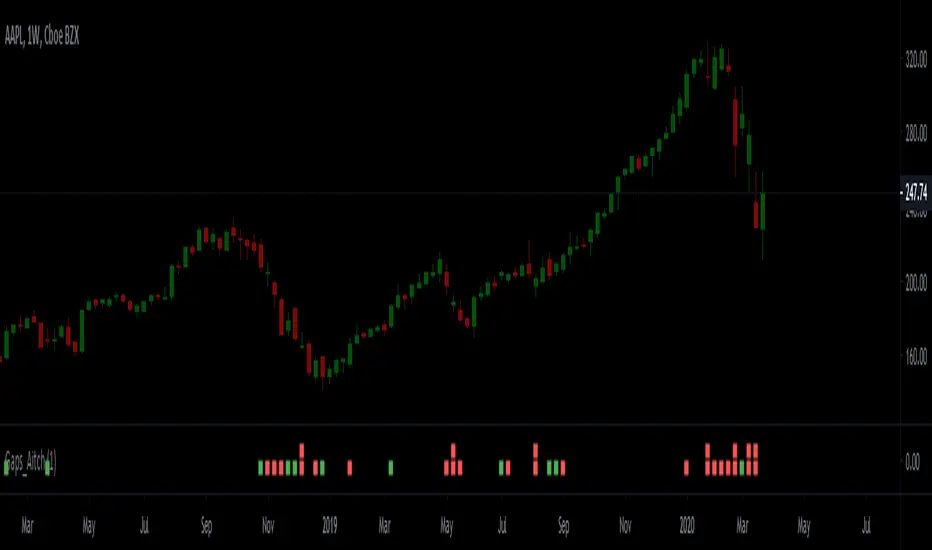
Gap Statistics (Zeiierman)█ Overview
The Gap Statistics (Zeiierman) indicator is crafted to monitor, analyze, and visually present price gaps on a trading chart. Price gaps are areas on a chart where the price jumps up or down from the previous close to the next open, creating a "gap" in the normal price pattern. This script delivers an extensive range of statistics related to these gaps, encompassing their size, direction (whether bullish or bearish), frequency of getting filled, as well as the average number of bars it takes for a gap to be filled. The indicator also visually represents the gaps, making it easier for traders to spot and analyze them.
█ How It Works
Gap Identification: The script identifies gaps by comparing the open price of a bar to the close price of the previous bar. If there is a discrepancy between the two, it is recognized as a gap.
Gap Classification: Once a gap is identified, it is classified based on its size (as a percentage of the previous close price) and direction (bullish or bearish). The gap is then added to a specific category based on its size.
Gap Tracking: The script keeps track of all identified gaps using arrays and user-defined types, storing details like their size, direction, and whether they have been filled.
Gap Filling: The script continuously monitors the price to check if any previously identified gaps get filled. A gap is considered filled if the price moves back into the gap area.
Statistics and Alerts: The script calculates various statistics like the total number of gaps, the number of filled gaps, the average number of bars it takes for a gap to fill, and the percentage of gaps that get filled. It also generates alerts when a new gap is identified or an existing gap gets filled.
█ How to Use
Gaps are often classified into four main types:
Common Gaps: These are not associated with any major news and are likely to get filled quickly.
Breakaway Gaps: These occur at the end of a price pattern and signal the beginning of a new trend.
Runaway Gaps: Also known as continuation gaps, these occur in the middle of a trend and signal a surge in interest in the stock.
Exhaustion Gaps: These occur near the end of a price pattern and signal a final attempt to hit new highs or lows.
The Gap Statistics (Zeiierman) indicator enhances a trader's ability to use gaps in their trading strategy in several ways:
Statistical Analysis: Traders get comprehensive statistics on gaps, such as their size, direction, and how often they get filled.
Performance Tracking: The indicator tracks how many bars it typically takes for a gap to fill, providing traders with an average timeframe for gap closure.
█ Settings
Display Gaps: Choose to display "All Gaps," "Active Gaps," or "None."
Show Gap Size: Toggle on/off the display of the gap size.
-----------------
Disclaimer
The information contained in my Scripts/Indicators/Ideas/Algos/Systems does not constitute financial advice or a solicitation to buy or sell any securities of any type. I will not accept liability for any loss or damage, including without limitation any loss of profit, which may arise directly or indirectly from the use of or reliance on such information.
All investments involve risk, and the past performance of a security, industry, sector, market, financial product, trading strategy, backtest, or individual's trading does not guarantee future results or returns. Investors are fully responsible for any investment decisions they make. Such decisions should be based solely on an evaluation of their financial circumstances, investment objectives, risk tolerance, and liquidity needs.
My Scripts/Indicators/Ideas/Algos/Systems are only for educational purposes!

Gap FinderThe Gap Finder Indicator will allow you to quickly identify gaps on the chart. Gaps in this indicator are defined as the "black space" between candles with the space being as small as $0.01. A gap up is one where the previous candle's high is lower than the current candle's low. A gap down is one where the previous candle's low is higher than the current candle's high.
Features:
Highlight Gap Area will show the price levels for the last found gap.
Show Last Only - will show only the last gap to help declutter the chart.
Basic guidelines for Gap trading:
Wait 3-5 Periods to allow the momentum to settle
Take trade on reversal candle with stop above recent high
Exit for profit when the gap fills.
This indicator will work for all timeframes using the definitions above so good for day traders, swing traders and any other style of trader using gaps in their strategy.

Gap Finder - Aitch-TGap finder finds the following types of gaps:
- Full Gap Up (open price is higher than the previous day's high)
- Partial Gap Up (open price is higher than the previous day's close)
- Full Gap Down (open price is lower than the previous day's low)
- Partial Gap Down (open price is lower that the previous day's close)
The script is fully customizable and can be applied to Forex, futures, stocks and crypto.
How to use it:
Once you have added the script to your chart, go to the script's settings and type in the size of the gap, then move to the style tab and check the types of gaps that you want the script to find. If you wish, you can also edit the rest of the settings to your liking.
Hit the Ok button when your done.
Green and red squares will appear on top and bottom of the indicator pointing out the location of the sharp move.
By default, full gap signals appear on top of the indicator while partial gap signals appear on the bottom of the indicator.
Defaul gap size is 1%.
GAP DETECTORGAP DETECTOR is an indicator displaying price gaps that have never been completely filled (only gaps >= 5 pips are considered).
Each gap is defined by two lines (the lower and upper bound of the gap), and a label giving information on its price range
#Parameters:
length: the number of candles being considered in the indicator (max is 3000).
width: the width of the gap lines.

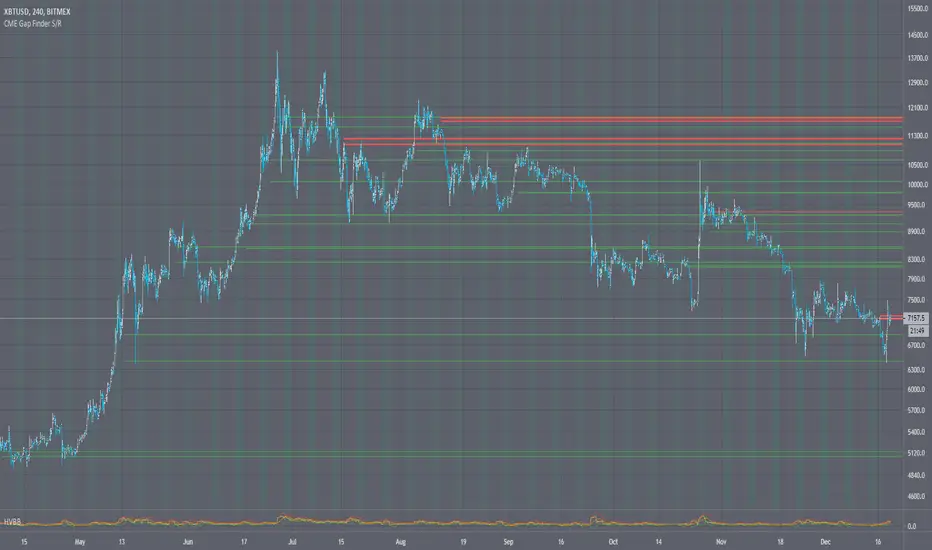
CME Bitcoin Gap Finder Orderblock Support ResistanceCME Bitcoin Gap Finder Orderblock Support Resistance
Intro
I had a backlog of scripts to release, and so everyone is getting some Christmas gifts early!
I have been watching CME gaps and how they relate to BTC for over a year now. I find they make good orderblock support/resistance areas.
Description
There is a limitation to how many lines I can draw with the new pine script functions. So for instance if you want to see the gaps from 2018 I have included a date range selector (similar to how a backtest works). This way you can only display the gaps from the dates ranges you want to see.
There's also the ability to check for gaps on the daily, 12h, 4h, and 1h charts. I recommend using 12H. But know that depending on what period you choose it will effect the size of the gaps, so experiment and see what works for you.
Lastly I included the ability to have background highlights whenever CME is closed on the weekend, just for visual reference.
You can use this indicator on any BTC ticker, and it will show you where the CME gaps are (without having to switch/reference the CME chart).
👍 We hope you enjoyed this indicator and find it useful! We post free crypto analysis, strategies and indicators regularly. This is our 74th script on Tradingview!
💬Check my Signature for other information
Find GapsShow a symbol or/and create an alert if there is a gap between candles. Percentage of gaps can be adjusted.

Gap Trader
Plot the most recent 20 gaps based on custom session info.
The session can be customized with a start time and an end time.
The previous open, high, low, close are only from the price during the session specified.
A gap line will stop printing the moment the gap is filled.
For CME futures, the session must be offset by one hour for Central time. I use the official cash close of 16:15 EST (yes, not 16:00) as this is the TRUE close when options go offline. Every day CME futures take a break between 16:15 - 16:30 EST for settlement, and then again from 17:00 - 18:00 EST.
To offset CME futures you must subtract an hour, the official NYSE hours for futures: 0830-1515, this translates to 9:30 AM EST - 4:15 PM EST.
For information about the probability of a previous day's gap being filled by the NYSE close: www.investiquant.com

Gap-O-MaticGap-O-Matic checks whether there is a gap in a user-defined security or symbol and gives you alerts, targets for the gap and tracks the gap until it has been filled. In addition, you can disable or show plots, and change the gap threshhold to pick how big of gaps you want Gap-O-Matic to alert you to and which it should ignore.
A good use case, for example, is to use Gap-O-Matic to monitor a CME/CBOE such as "BTC1!" while trading a bitmex chart. You wont need to check or chart out gap areas. Gap-O-Matic will automatically draw in the gaps on your chart for you.

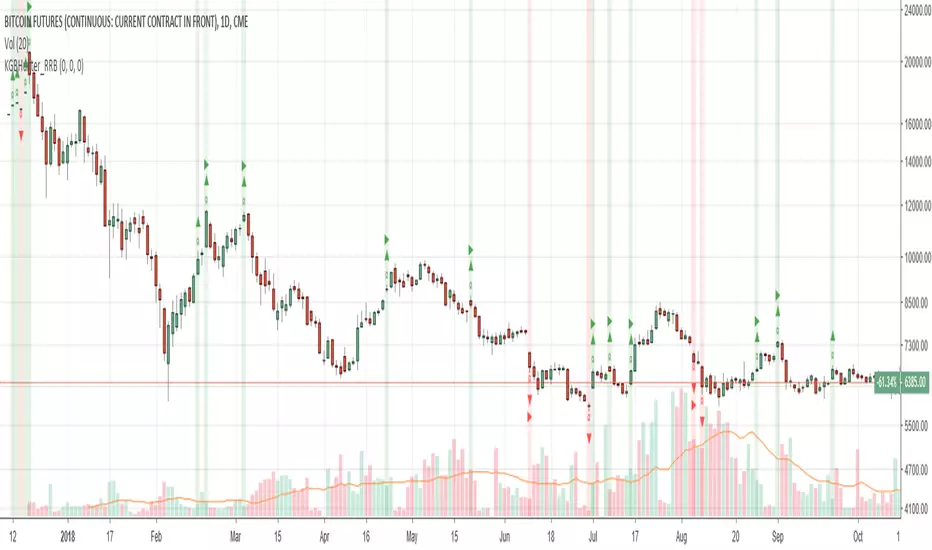
Katana Gaps Bounty Hunter Pro (Show Gaps of All Types) by RRBKatana Gaps Bounty Hunter Pro (KGB Hunter Pro, Gap Exterminator) by RagingRocketBull 2018
Version 1.0
This indicator shows/counts/filters gaps on a chart.
There are several versions: Simple, Pro, Advanced and Zones. This is the Pro version. The Differences are listed below.
- Simple: shows/counts gaps, changes color based on gap dir (2 colors), filters out price gaps within session, large gaps, and high volume gaps
- Pro: +shows all types of gaps, multi color, pro filters (full/partial/overlapping time, price, large, candle, volume, doji, weekend gaps within delta ranges)
- Advanced: +session times mask, show/count gaps only for last N bars, +min/max/filled gaps stats, dark mode
- Zones: +shows gaps as dynamic horiz zones
KGB Hunter Pro Gap Exterminator focuses on showing you all possible types of gaps in multiple colors. Gap theory states that price tends to return and fill the gaps,
so you can use it to collect the bounty. You can apply any combination of complex filters to narrow down search results i.e., find only all:
- type 3 gaps up with allowed wick-candle overlapping of up to 10% and
- gap size larger than 200 and
- with at least one of the candles larger than 100 and
- volume change at least 40 and
- spanning less than 2 bar periods and
- excluding weekend gaps
Features:
- highlights gaps using barcolor and plotchar chars (8 colors x 2 dirs)
- supports all 3 types of gap overlapping: full gap (no overlapping), wick-wick and wick-body overlapping up to a specified % of candle body
- finds all types of gaps with pro filters for price, time, large, volume, timerange, candle size, doji gaps
- individual show/hide flags for each gap/char based on gap type
- can show/hide gaps/chars based on gap dir
- changes color of gaps/chars based on gap dir/type, multi color gap type combos
- displays chars above/below bar based on gap dir
- can show/hide weekend gaps
- counts all filtered gaps
Colors:
Basically There are 2 gap types (Price, Time) x 2 directions (Up, Down) x 2 modifiers (Large, Volume), Volume Gap is a separate class with its own modifiers, so more accurately:
- (Price, Time) x 2 directions (Up, Down) x Large modifier
- (Price Volume, Time Volume) x 2 directions (Up, Down) x Large modifier
using a total of 16+1 colors or 8+1 base colors + transparency modifier
depending on settings you can highlight gaps using any multi color combo from just 1 to all 16 colors (+1 gray color for weekends).
basic gap = 1 base color with normal transparency
price,time = 2 base colors (including basic gap) with normal transparency (+1 color)
* up,down dir = +2 new base colors with normal transparency (including 2 base colors), with a total of 2*2 = 4 price/time base colors (+2 colors)
* large = same 4 base colors with vivid transparency modifier (+4 colors)
* volume = +2 new base colors with normal transparency, a separate class (+2 colors)
* volume * up,down dir = +another 2 new base colors with normal transparency (including 2 volume base colors), with a total of 2*2 = 4 volume base colors (+2 colors)
* volume * large = 4 volume base colors with vivid transparency modifier (+4 colors)
weekend_gap = gray (+1 color)
doji gap, candle gap, timerange gap = no special color, inherits color from parent gap type
for more details, please see the Gap Color Hierarchy comments in code
_________________________________________________________________________
You can find the following gap related terminology in literature: full, partial, extreme, breakaway, runaway/continuation, common, exhaustion gaps.
There are no exact rules to distinguish between them, so this can't be implemented.
When defining a gap it all boils down to how do you plot a gap, which points between adjacent candles do you consider a gap. Different sources apply different methodology
but in practice only 3 types of gap overlapping can exist:
- full gap (no overlapping),
- partial (wick-wick overlapping) and
- extreme partial (wick-body overlapping up to a specified % of a candle body)
All these types are supported in this script. The only possible remaining option is candle-candle overlapping which is not a gap by definition.
Many other script specific subtypes are also supported. Please see description of each gap type below and comments in code.
General display modes
- gap has 3 possible overlapping modes: full gap (no overlapping), wick-wick overlapping, wick-candle overlapping up to a specified % of candle body size (for mode 3 only)
the remaining candle-candle overlapping implies not a gap by definition
full gap mode will find the least amount of gaps, wick-candle - the most
- gap can be either price or time, up or down, and shown above or below the candles (gap chars)
- by definition, a price gap is a smaller subset of a time gap, a gap within current session with a price gap and zero time lag between bars.
Therefore timerange filter is useless for price gaps, but can still be applied.
On the other hand, all price gap filters can be applied to time gaps without any distinction.
- gap can have multiple modifier subtypes: (price|time) * (up|down) * (large? + volume? + doji? + timerange? + weekend?)
i.e. price + large + volume + doji or time + large + volume + timerange + doji + weekend
- the gap is always counted only once no matter how many subtype modifiers it has
- if the gap does not satisfy any of the applied flags/filters it is not shown/counted (no gap bars/chars are shown)
- gap color can depend on a combo of gap type/dir and modifier subtypes or can be shown in a single base color
- char color can only depend on gap dir (not type/modifiers) or can be shown in a single base color
- char position can also depend on gap dir (above/below) the gap candle. Alternatively you can pin chars to the top/bottom of the screen in UI Styles.
- change_by_type = true - uses gap type base colors (2 colors + optional modifiers, up to 8 colors if volume and/or large filters are enabled)
- change_by_dir = true - uses gap dir base colors (2 colors + optional modifiers, up to 8 colors if volume and/or large filters are enabled)
- both change_by_type and change_by_dir = true - uses both gap type and dir base colors (4 colors + optional modifiers, up to 16 colors if volume and/or large filters are enabled)
- both change_by_type and change_by_dir = false - uses a single base gap color (1 color)
- don't need that much colors - disable filters
- highlight bars has priority over individual gap flags, when it is false all gaps are hidden regardless of their corresponding flag settings (does not affect dim weekend gaps)
- show chars has priority over individual gap char flags, when it is false all char flags are hidden regardless of their corresponding flag settings
- price gaps are only shown/counted when show_price_gaps flag is true. The large or volume filters can be used to narrow down results further.
- time gaps are only shown/counted when show_time_gaps flag is true. The large, volume, and timerange filters can be used to narrow down results further.
- doji gaps are only shown/counted when show_doji_gaps flag is true. The doji candle size and other filters can be used to narrow down results further.
- show weekend gaps = true and dim weekend gaps = false - shows/counts weekend gaps
- show weekend gaps = true and dim weekend gaps = true - dims weekend gaps, doesn't show/count weekwend gaps
- show/dim weekend gaps do just that - show the gap if it happens on a weekend, not all weekends
- large gaps are only shown/counted when the large filter is enabled != 0. positive values 5 (>= 5), negative -5 (<=5) are used to switch between <>
- volume gaps are only shown/counted when the volume filter is enabled != 0. positive values 5 (>= 5), negative -5 (<=5) are used to switch between <>
- timerange gaps are only shown/counted when the timerange filter is enabled != 0. positive values 5 (>= 5), negative -5 (<=5) are used to switch between <>
- candle size gaps are only shown/counted when the candle size filter is enabled != 0. positive values 5 (>= 5), negative -5 (<=5) are used to switch between <>
- candle size filter is the only filter with 2 arguments, use_and_for_delta to enable AND condition for the args (OR is the default)
Good Luck! Feel free to explore and learn from the code

Katana Gaps Bounty Hunter (Show Gaps Counter) by RRBKatana Gaps Bounty Hunter (KGB_Hunter) by RagingRocketBull 2018
Version 1.0
This indicator shows/counts/filters gaps on a chart
There are several versions: Simple, Pro and Zones. This is the Simple version. The Differences are listed below.
- Simple: shows/counts gaps, changes color based on gap dir (2 colors), filters out price gaps within session, large gaps, and high volume gaps
- Pro: +shows all types of gaps, multi color, more filters (time gaps, doji, etc)
- Zones: +shows gaps as dynamic horiz zones
Features:
- highlights gaps using barcolor and plotchar chars (2 colors x 2 dirs)
- can show/hide gaps/chars based on gap dir
- changes color of gaps/chars based on gap dir
- displays chars above/below bar based on gap dir
- can filter out price gaps, large gaps, and high volume gaps
- counts all filtered gaps
Good Luck! Feel free to reuse the code and make it your own
Khaos-Hidden-Gaps
This is an indicator that shows Hidden Gaps. It will assist when looking for support and resistance levels, as well as help in understanding trend, thereby improving trading performance.
LEGAL STUFF:
Risk Disclosure
Futures , forex, stock, crypto and derivative trading contains substantial risk and is not for every investor. An investor could potentially lose all or more than the initial investment. Risk capital is money that can be lost without jeopardizing ones’ financial security or life style. Only risk capital should be used for trading and only those with sufficient risk capital should consider trading. Past performance is not necessarily indicative of future results
Hypothetical Performance Disclosure
Hypothetical performance results have many inherent limitations, some of which are described below. no representation is being made that any account will or is likely to achieve profits or losses similar to those shown; in fact, there are frequently sharp differences between hypothetical performance results and the actual results subsequently achieved by any particular trading program. One of the limitations of hypothetical performance results is that they are generally prepared with the benefit of hindsight. In addition, hypothetical trading does not involve financial risk, and no hypothetical trading record can completely account for the impact of financial risk of actual trading. for example, the ability to withstand losses or to adhere to a particular trading program in spite of trading losses are material points which can also adversely affect actual trading results. There are numerous other factors related to the markets in general or to the implementation of any specific trading program which cannot be fully accounted for in the preparation of hypothetical performance results and all which can adversely affect trading results
DAX GAPSIf you are interested in trading gaps in DAX, then DOW plotted in DAX's trading hours, will help you know whether the smoothed candle was a gap or not. Use a different script to plot yesterday's closing price. This will help you see the target for the gap close. Let me know if you find it helpful or not!