Gauss KenJi Robot
Gauss KenJi Trading Robot: Precision and Automation for Traders
The Gauss KenJi robot is a cutting-edge trading solution designed for experienced traders seeking to enhance their decision-making through advanced statistical models and automation. Unlike traditional trading tools that rely on generic indicators prone to false signals, the Gauss KenJi robot offers an innovative approach by utilizing two unique indicators: the Kenji Indicator v.2.0 and the Gauss Indicator .
Kenji Indicator v.2.0
Traditional moving averages and related indicators often fail in flat market conditions, where frequent crossovers lead to confusing signals and false trends. The Kenji Indicator addresses this issue by using a combination of correlation analysis and moving averages to more accurately identify the market’s state. This real-time insight allows for better navigation of local trends, reducing noise and increasing the precision of trade signals.
Gauss Indicator
The Gauss Indicator brings the power of statistical analysis into trading by applying the 3 sigmas rule. It calculates and predicts the likely price ranges for specific time frames (hourly, daily, weekly) with probabilities of 68%, 95%, and 99%. This offers traders an actionable framework for setting stop-loss, take-profit, and identifying key support and resistance levels. By providing a clearer view of potential price movements, the Gauss Indicator improves decision-making, ensuring that traders enter and exit the market at optimal points.
Gauss KenJi Robot: How it Works
The Gauss KenJi robot operates on a statistical algorithm based on the Gaussian function, which uses market volatility as a core indicator of price movements. The robot opens positions in the direction of the trend when the price reaches the predetermined Gauss border. Position sizes are calculated according to the “Initial_lot” parameter, with stop-loss and take-profit levels defined by the “Pips” parameter. Trades are automatically closed either when profit targets or stop-loss limits are reached, or if local trend reversals are detected by the Kenji Indicator.
This highly adaptable algorithm can be applied to any asset class (stocks, forex, crypto, commodities) and any time frame, providing traders with a versatile tool to navigate various markets.
Why Gauss KenJi is Essential for Traders
1. Time Efficiency: The robot operates autonomously, allowing traders to step away from constant chart monitoring while still capitalizing on market movements.
2. Profit Maximization: By leveraging machine learning and advanced statistical models, the robot identifies opportunities faster than human traders, ensuring more profitable trades.
3. Risk Management: The robot strictly adheres to predefined rules, helping traders minimize losses and protect their capital in volatile market conditions.
4. Cross-market Versatility: Whether you’re trading forex, stocks, crypto, or commodities, Gauss KenJi adapts to different markets and time frames, making it a versatile tool for professional traders.
The Gauss KenJi robot is a comprehensive, scientifically driven trading solution designed to eliminate common pitfalls associated with traditional indicators. Its combination of the Kenji Indicator’s trend identification and the Gauss Indicator’s price prediction capabilities makes it an indispensable tool for traders looking to enhance both the precision of their trades and the automation of their strategies. Whether you are aiming for consistent daily profits or optimizing long-term trading strategies, Gauss KenJi offers the efficiency and accuracy required to stay ahead in today’s competitive markets.
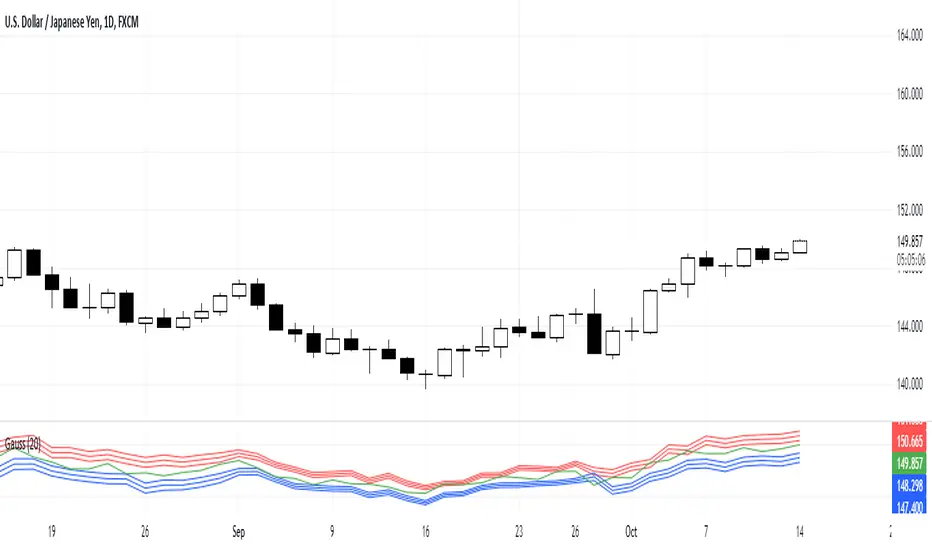
Gauss

Gauss IndicatorGauss Indicator
Class : oscillator
Trading type : any
Time frame : any
Purpose : reversal trading
Level of aggressiveness : any
About Gauss Indicator
Time series forecasting is quite a scientific task, for which specific econometrical models and methods have been developed.
Who is Gauss and Why his Curve is So Important
Johann Gauss was one of the best mathematicians of all times and he gave us a very specific curve (Gaussian Curve) to explain specifics of random variable behavior (so called Normal Distribution)
Gaussian curve has quite interesting property usually called “3 Sigmas Rule”: in a normal distribution: 68%, 95%, and 99.7% of the values lie within one, two, and three standard deviations of the mean, respectively.
But Does It Work in the Financial Markets?
Normal Distribution is extremely typical for price behavior in financial markets: FOREX, stock Market, Commodities, Cryptocurrency market.
How can we forecast future prices based on “3 Sigmas Rule”?
If we know past prices (we actually know), we can calculate Mean and Standard Deviation.
After that following “3 Sigmas Rules” we can calculate the fluctuations range for the present day with a known probability (!).
• If we add 1 sigma to mean we can get the price value that wouldn’t be exceeded with a probability of 68%.
• If we add 2 sigmas to mean we can get the price value that wouldn’t be exceeded with a probability of 95%.
• If we add 3 sigmas to mean we can get the price value that wouldn’t be exceeded with a probability of 99%.
How Can I Get This Information?
Gauss indicator is a practical implementation of “3 sigmas rule” in trading.
Gauss allows to predict the ranges of price fluctuations for the selected time frames (week, day, hour, etc) with certain probabilities: 68%, 95% and 99%.
Gauss can be used to generate Trading signals, Stop-loss parameters, Take-profit parameters, Synthetic Levels (both Support and Resistance).
Actually, ALL information you need to trade.
Structure of the Gauss Indicator
1. Three blue lines – synthetic support lines. They describe 3 different buy zones with certain probabilities of success:
- First blue line (Buy zone #1) - the price today will not fall below this mark with a probability of 68%;
- Second blue line (Buy zone #2) - the price today will not fall below this mark with a probability of 95%;
- Third blue line (Buy zone #3) - the price today will not fall below this mark with a probability of 99%.
2. Three red lines – synthetic resistance lines. They describe 3 different sell zones with certain probabilities of success:
- First red line (Sell zone #1) - the price today will not rise above this mark with a probability of 68%;
- Second red line (Sell zone #2) - the price today will not rise above this mark with a probability of 95%;
- Third red line (Sell zone #3) - the price today will not rise above this mark with a probability of 99%.
3. Green line – shows current price. When it gets close to the red/blue line sell/buy signals are generated.
Trading rules
General rules are as follows: buy at the blue lines, sell at the red lines.
Take-profits for sells are set at the nearest blue line, for buys – at the nearest red line. Stop-losses for sells are set above the last red line, for buys – below the last blue line.
norminvLibrary "norminv"
Description:
An inverse normal distribution is a way to work backwards
from a known probability to find an x-value. It is an informal term and
doesn't refer to a particular probability distribution. Returns the
value of the inverse normal distribution function for a specified value,
mean, and standard deviation.
Reference:
github.com
support.microsoft.com
norminv(x, mean, stdev)
Returns the value of the inverse normal distribution function for a specified value, mean, and standard deviation.
Parameters:
x : float, The input to the normal distribution function.
mean : float, The mean (mu) of the normal distribution function
stdev : float, The standard deviation (sigma) of the normal distribution function.
Returns: float.

One-Sided Gaussian Filter w/ Channels [Loxx]One-Sided Gaussian Filter w/ Channels is a Gaussian Moving Average that is calculated using a Fibonacci weighting function. Keltner channels have been added to show zones of exhaustion. A better name would be "Half Gaussian bell weighted" or "Half normal distribution weighted" indicator, since the weights for calculation of the average (similar to linear weighted average) are taken from a normal distribution curve like function--but only the half of the curve is used for calculation.
Information of the Gaussian distribution can be found here : en.wikipedia.org and once you take a look at the standard normal distribution curve, it will be much clearer what is exactly done in this indicator.
After the Gaussian Filter is applied to the source input, an Ehlers' 2-Pole Super Smoother is applied to reduce noise without significant lag.
Included:
Bar coloring
Signals
Alerts
Loxx's Expanded Source Types

Double Gaussian Awesome Oscillator by KviateqThis is an experimental indicator based on Bill Williams' Awesome Oscillator, however this one is coded using Gaussian Smoothed MAs, and showing both short and long-term trend.
The bright line histogram shows short term trend, the columns show long term trend.
To be used the same way as Bill William's strategy for AO, with added confirmation of longer trend.
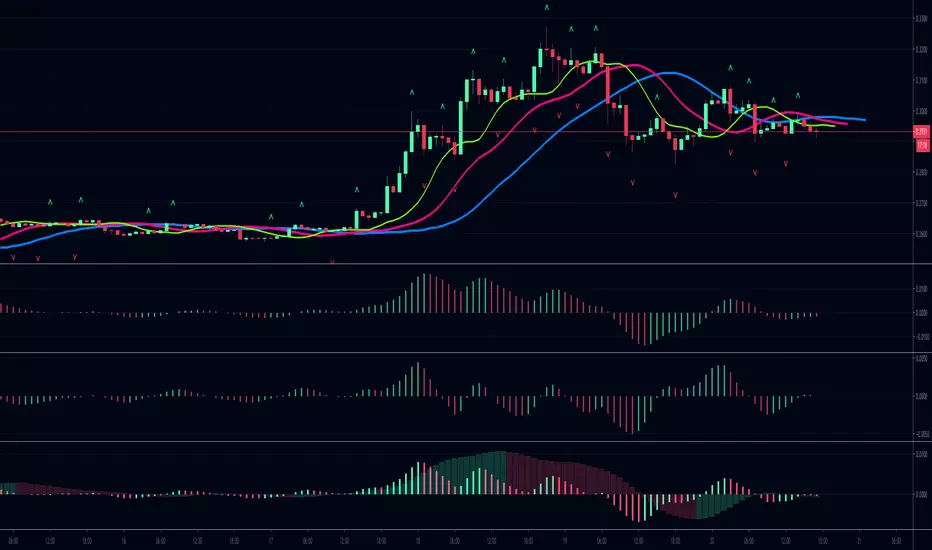
Gaussian Acceleration/Deceleration by KviateqBill Williams' AC (Acceleration/Deceleration), made using Gaussian-smoother Moving Averages and a 5-period EMA instead of the usual SMA.
Since Gaussian MA's are faster reacting than the typical SMAs values have been adjusted accordingly.
See also Gaussian Alligator and GaussianAO for a complete gaussian chaos trading system.
These scripts are made to honor Bill and his amazing work and my humble attempt at contributing to his work

Gaussian Awesome Oscillator by KviateqBill Williams' Awesome Oscillator, made using Gaussian-smoother Moving Averages.
Since Gaussian MA's are faster reacting than the typical SMAs values have been adjusted accordingly.
See also Gaussian Alligator and GaussianACDC for a complete gaussian chaos trading system.
These scripts are made to honor Bill and his amazing work and my humble attempt at contributing to his work

Gaussian Alligator by KviateqBill Williams' Alligator, made using Gaussian-smoother Moving Averages.
Since Gaussian MA's are faster reacting than the typical SMAs values have been adjusted accordingly.
See also GaussianAO and GaussianACDC for a complete gaussian chaos trading system.
These scripts are made to honor Bill and his amazing work and my humble attempt at contributing to his work


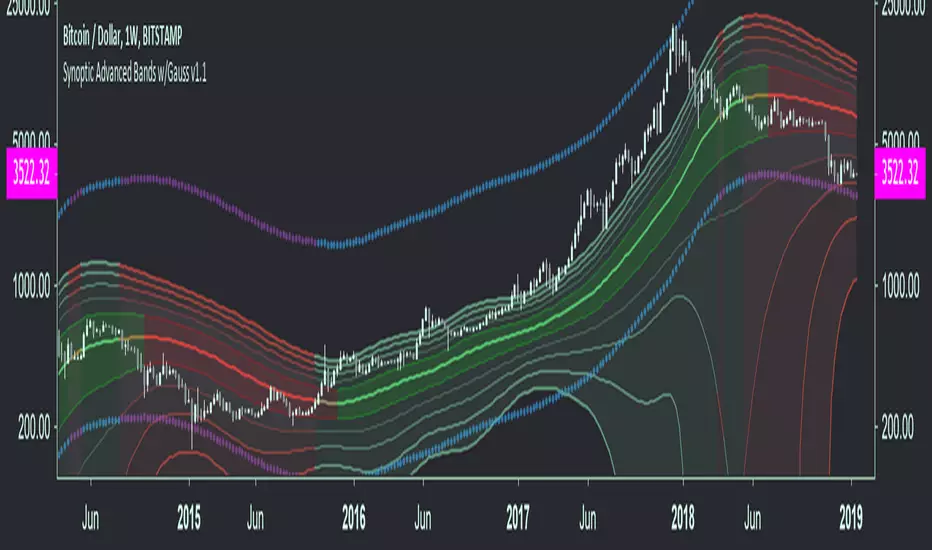
Synoptic Advanced Bands w/GaussAdvanced 9 value band engine with Gaussian option. Includes ALMA, DEMA, EMA, Gauss, HMA, KAMA, LSMA, RMA, SMA, SMMA, TEMA, VWMA, WMA as options for the band engine.
Features:
Three color themes built in, switch between them with a drop down box in the inputs tab, customize them on the style tab.
Change source, length for band engine.
Five band modes, including Bollinger Mode, Custom Mode, Fibonacci Mode, Gaussian Mode, and Normal Mode.
Factor setting for normal (equidistant) and compounding in band calculation.
Offset option
Gaussian core can be shown at all times, even when using a non-Gaussian band engine, and includes reduced lag, and fast response mode, as well as the option to adjust the core multiplier and poles for the Gaussian calculations.
Bollinger settings can be locked to the band settings or set independently for standard deviation.
All custom settings for ALMA, KAMA, LSMA, DEMA, TEMA available including some new ones.
Custom alerts can be set within the inputs tab, then activated through the regular alerts dialog.
40 programmable presets for band settings.
Over 1000 configurations possible for the main settings, many many more if counting minor adjustments.
Great for support/resistance, predicting major moves, trend change/direction, targets, assessing volatility etc.
Access available, please message for more info. If you already have access and need help with configuration, or have a bug to report please get in touch with me.


Gaussian FilterGaussian Filter script.
This indicator was described by John F. Ehlers in his book "Rocket Science for Traders" (2001, Chapter 15: Infinite Impulse Response Filters).

Mean Reversion and Momentum - Updated with gaussiana smoothingMean Reversion and Momentum
Interpretation:
- Divergence means trend reversal
- Parallel movement means trend continuation
Squares above serve as a confirming signal

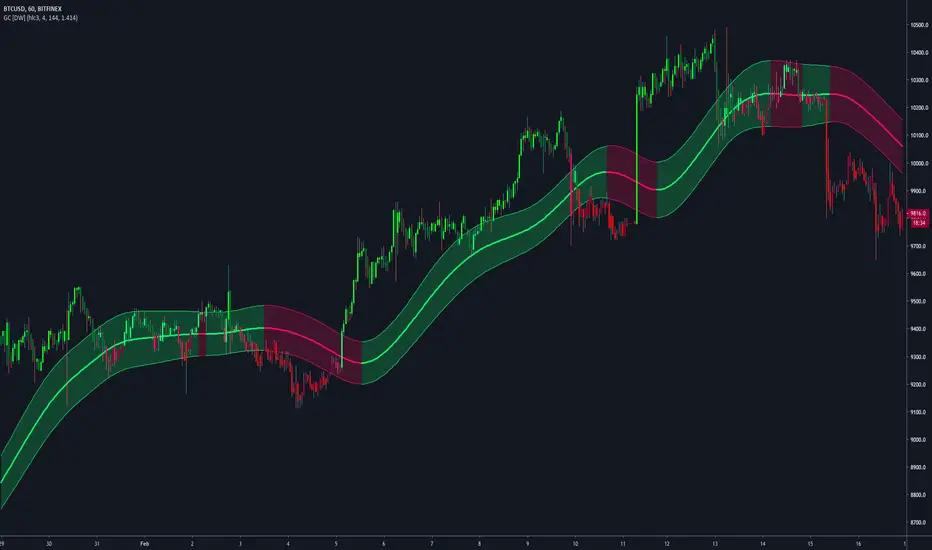
Gaussian Channel [DW]This study is an experiment utilizing the Ehlers Gaussian Filter technique combined with lag reduction techniques and true range to analyze trend activity.
Gaussian filters, as Ehlers explains it, are simply exponential moving averages applied multiple times.
First, beta and alpha are calculated based on the sampling period and number of poles specified. The maximum number of poles available in this script is 9.
Next, the data being analyzed is given a truncation option for reduced lag, which can be enabled with "Reduced Lag Mode".
Then the alpha and source values are used to calculate the filter and filtered true range of the dataset.
Filtered true range with a specified multiplier is then added to and subtracted from the filter, generating a channel.
Lastly, a one pole filter with a N pole alpha is averaged with the filter to generate a faster filter, which can be enabled with "Fast Response Mode".
Custom bar colors are included.
Note: Both the sampling period and number of poles directly affect how much lag the indicator has, and how smooth the output is.
Larger inputs will result in smoother outputs with increased lag, and smaller inputs will have noisier outputs with reduced lag.
For the best results, I recommend not setting the sampling period any lower than the number of poles + 1. Going lower truncates the equation.
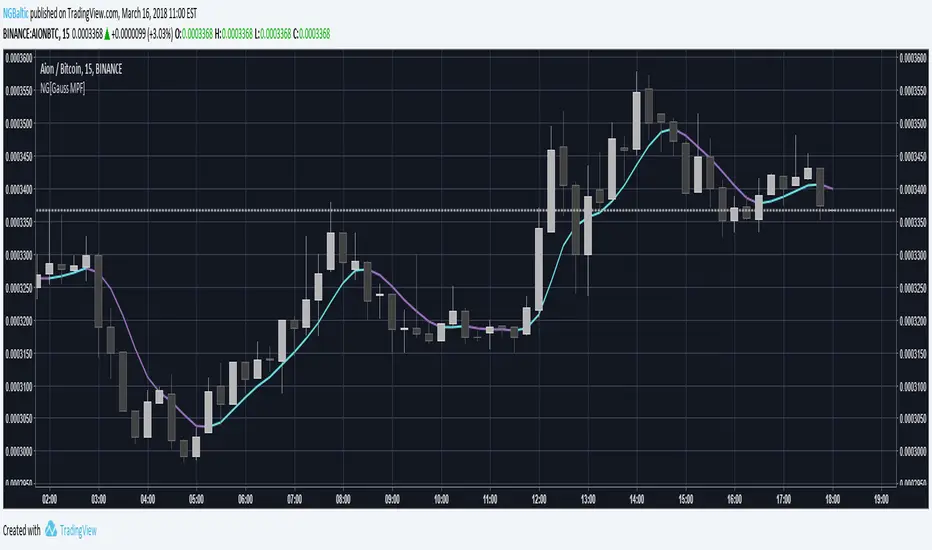
NG [Gaussian Filter Multi-Pole]When smoothing data there is always a trade-off between lag and removal of noise.
Gaussian filter has a consistently low lag and a very smooth curve.
This filter works for poles higher than the 4 (usual usage).
Mathematically maximum poles is 15 after which coefficients are too high to see any difference.
By tuning Lag and number of Poles you can achieve a very smooth MA with least lag possible.
It's just as good as 3rd gen moving averages and can be used as input feed for other indicators.