Gedhusek MomentumSqueezeThis oscillator measures a strength of momentum.
About the indicator:
Unlike the classic momentum indicator, which only measures the distance between two points, this one has a more sophisticated calculation system to better show the reality of the markets. This is reached by including the distance between the highest and lowest point over certain period and an absolute distance of each bar over certain time period. By combining the distance between the highest and lowest price point with an absolute distance into mathematical formula, we get a final value representing the momentum strength.
The next great thing about this oscillator is that its values are relative to the previous ones. Thanks to this, we get a better understanding about the current situation given what has happened in the market before.
General rules:
Value of this indicator ranges from 0 to 100.
If the value is below 50, it means that there is very weak momentum and if the value is above 50, there is strong momentum.
The idea is that these values should oscillate, therefore we can more precisely predict when the momentum is going to increase or decline.
If the current value is below 20, the market has very low momentum and it should increase and if the current value is above 80, there is an extremely high momentum and it should decline.
What is absolute distance and why use it:
Lets say that we have 2 last bars. The first one starts at 100 and closes at 110 and the second one starts at 110 and closes at 105. So the price change would be of 5 points (from 100 to 105). This is not an ideal way because we punish volatile markets with no clear trend.
With an absolute distance, we would deal with given scenario like this. The first bar went from 100 to 110, resulting in distance of 10 points, and the second bar went from 110 to 105, resulting in distance of 5 points. No we add up these distances and we get the absolute distance --> 10+5 = 15
With this type of calculation we get more accurate information about momentum
Inputs:
- Analysis Period - Sets how many bars are going to be used for calculations
Gedhusek

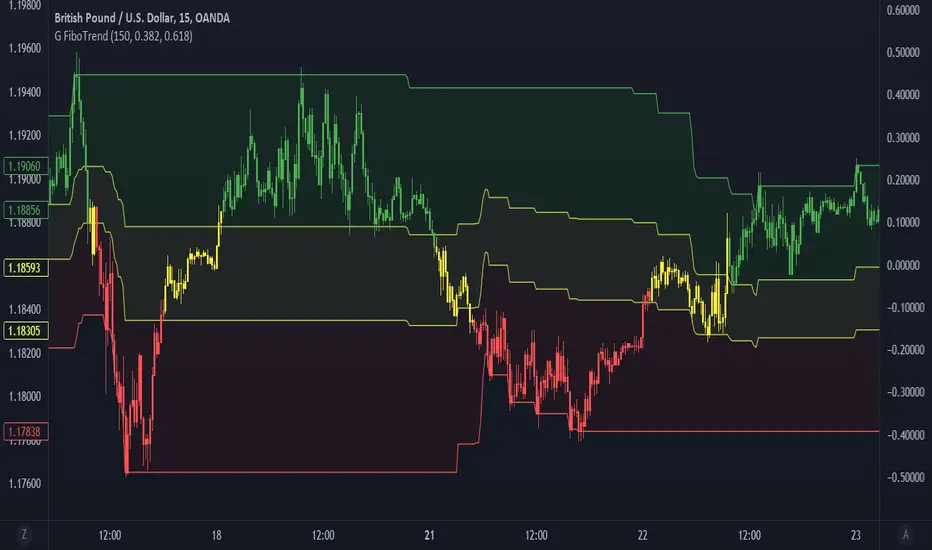
Gedhusek TrendFibonacciThis indicator is a trend filter based on fibonacci retracement levels
How to read:
- There are three filled zones --> red, yellow and green
- If the price is inside of red zone, there is a downtrend on the market
- If the price is inside the yellow zone, there is a sideways trend on the market
- If the price is inside the green zone, there is a uptrend on the market
- Also, candles are going to have a corresponding color based on the current trend
Calculations of the indicator:
1. Calculate distance between maximal and minimal price over the last "x" bars (choose value for "x" in inputs menu under the "Analysis period")
2. Use this distance for calculating two retracement levels (choose retracement levels in inputs menu)
3. These two retracement levels create an area of what is going to be considered as sideways market
Example:
- Lets say we chose Analysis period of 100, Lower Fibonacci Level as 0.382 and Upper Fibonacci Level as 0.618
- Maximum price over the last 100 bars was of 120 and minimum price was 20. That leaves us with the difference of 100 points
- Now we calculate the fibonacci levels --> 100*0.382 = 38.2 and 100*0.618 = 61.8
- The next step is to add the levels to the lowest price point --> 20 + 38.2 = 58.2 and 20 + 61.8 = 81.8
- And now we have our zones. If the price is going to be below the lower fibonacci level (in this case 58.2), we consider it as a bearish trend. If the price is between those fibonacci levels (58.2 and 81.8), we consider it as a sideways trend. And if the price is above the upper fibonacci level (81.8), we consider it as a bullish trend.
Inputs:
- Analysis period --> number of bars within which the system is going to look for max and min price
- Lower Fibonacci Level --> Choose from options and must be lower or the same as "Upper Fibonacci Level"
- Upper Fibonacci Level --> Choose from options and must be higher or the same as "Lower Fibonacci Level"
- Show Filling --> whether you wish to fill the areas with color
- Change Candle Color --> whether you wish to change the color of candles based on current trend.
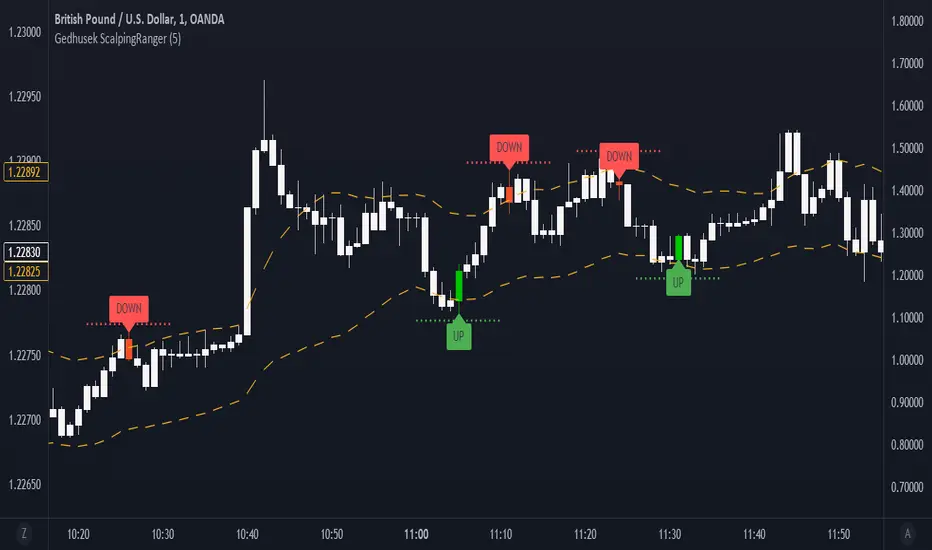
Gedhusek ScalpingRangerThis indicator was designed for finding good entries for scalping the market
How does it work:
- It works on a basis of price running out of its bands and its return
- Once the price is out of bands, the system starts scanning for two patterns --> sudden price reversion and losing of momentum.
- If any of these patterns occur, the indicator waits for a confirmation bar and after that it gives you a signal that the price could be moving upwards or downwards.
- These signals are represented by a label and sudden price change of the current bar
- Also you will see a dotted line above or below the bar that can be used as a potential Stop Loss level
Idea behind the trigger patterns:
Sudden price reversion
- Idea behind this pattern is that the price has a higher success of reversion if there is a fast change of its momentum. This pattern is recognized by measuring the divergence between prior and current price change
- The divergence is measured as correlation between shorter-term price action and longer-term price action. If the correlation is negative and statistically significant, it is counted as a reversion signal (= shorter-time price action goes in the opposite direction of longer-term price action)
Losing of momentum
- The idea behind this pattern is that once there is no strong momentum, there is lower probability of a breakout and start of strong trend
- It is calculated as a difference between current price and previous price. If the difference is minimal, it is taken as a signal that the price lost its momentum and therefore there is higher chance of reversion.
When to use:
- This indicator works well in ranging markets, but slightly less well in trending markets. Therefore look for sideways markets and use the indicator there
- Price action patterns work really well with this indicator, such as Support and Resistance levels, double Tops and Bottoms,...
Inputs:
- This indicator has only one input and that is "Analysis Period". This input declares how many bars and going to be used when finding the patterns of possible price reversion
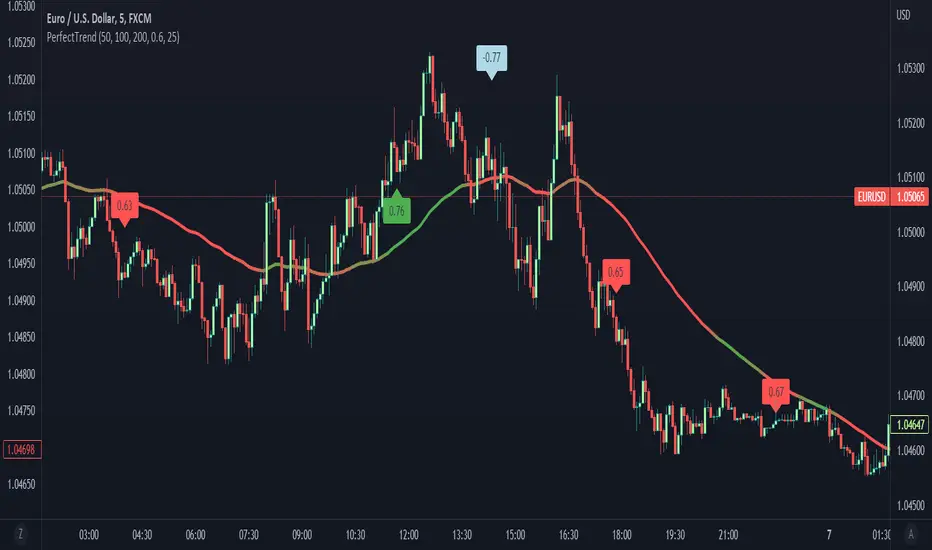
CorrelationTrendThis indicator is a correlation based trend classifier.
How does it work:
- The software measures a correlation between 3 moving averages and the price.
- If there is a significant correlation and the price is moving upwards, the Moving average displayed on the chart is going to be green and if it is moving downwards, it is going to be red. And, if the correlation is not significant, the price is going to have yellow/orange shade.
- In case there is a strong negative correlation (= strong divergence between price and moving average), you will receive a light blue label on the chart. Such events can indicate possible reversals in the market
How to read correlation:
- The correlation value ranges from -1 to 1
- If the value is either bigger than 0.5 or lower than -0.5, the correlation is considered as significant and as the value is closer to 1 or -1, its significancy rises.
Correlation is larger than 0.5 --> means that there is a positive relationship between the direction of price and moving averages (there is a trend)
Correlation is lower than -0.5 --> means that there is a divergence between the direction of price and moving average(possible sudden change of the trend)
What can you see on the chart:
- Moving average--> based on its color you can get a sense of the trend
- Red/Green labels--> after the correlation value surpasses positive Precision trigger (defined in inputs), it creates a label to let you know of such event
- Light blue labels--> after the correlation is lower than negative Precision trigger (defined in inputs), it creates a label to let you know of possible price reversion
- Label on the current bar--> this label displays the current correlation value
Inputs:
- First MA Period = period of the first moving average
- Second MA Period = period of the second moving average
- Third MA Period = period of the third moving average
- Analysis span = number of bars used for computing
- Show flags = set to "true" if you wish to see the labels, otherwise set to "false"
- Show MA = set to "true" if you wish to see the moving average, otherwise set to "false"
Additional info:
- This indicator on its own should not be used as a source of entry signal
- Its main purpose is to give you a sense of the current trend and possible price reversions
Gedhusek MasterReversionThe MasterReversion Indicator works as a scanner for possible price reversals.
How does it work?:
The main feature of this indicator is finding extreme price deviations from its mean. This is reached by calculating the average price deviation from its mean and then comparing it with the current price deviation. This deviation is expressed as a percentage in relation to the historically highest price deviation --> if the maximum deviation is 200 points and the current deviation is 180 points, than the percentage displayed is going to be 90%.
With knowing how extreme the current deviation is, we can do some good decision making about whether the market is ready to reverse to its mean or not.
The next feature of this indicator is classic SuperTrend indicator. This tool is mainly used for identifying shifts in the market trend and in this case it becomes very useful when catching the actual price reversion.
The key idea:
The main idea behind this tool is that the price can be away from moving average, but cant stay that way forever. Therefore its convenient to know when the reversion part might happen
How to use:
Generally, you would want to wait until the current price reaches certain percentage (you can see a label on the latest bar displaying current percentage deviation). After that happens, wait for a sign of pullback. For that you can use the built-in SuperTrend indicator or any other strategy that you like. Your potential Take Profit should be somewhere around the main moving average (it has a white colour) as you are speculating on mean reversion.
[
Settings:
MA Period = Period of a moving average. Price deviations will be relative to this moving average, so as the value is larger, you will catch more significant price deviations and vice versa
Percentage Trigger = Specifies what percentage do you consider as significant.
ATR Period = Settings for a SuperTrend. Specifies a period of an ATR indicator. I like to use values 22 or 34. As the value is higher, the indicator will be generally less sensitive
ATR Multiplier = Also specifies a sensitivity of SuperTrend. As the value is higher, the SuperTrend is going to be less sensitive and vice versa
I would personally encourage you to experiment with the indicator first, so you can decide which inputs are the best ones for your style of trading.
Which markets and Time Frame:
This indicator works best on Forex and can be used on any TF.
It is possible to use it also on other instruments, but the settings has to be adjusted more.

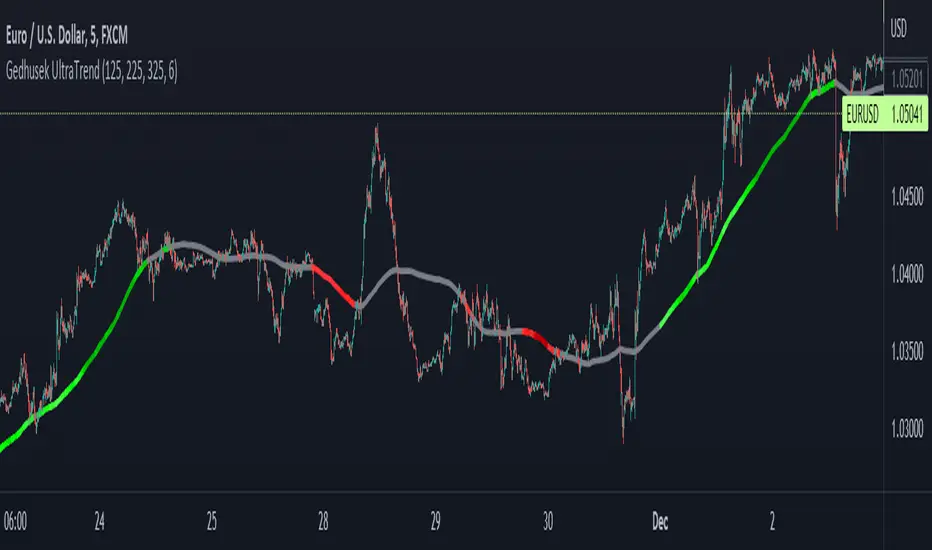
Gedhusek UltraTrendThis indicator serves a purpose of a trend recognizer. It is able to tell you whether the market is bullish, bearish or if the price goes sideways.
Process of determining the trend:
- The indicator uses 3 moving averages to determine the trend
- For each of these averages, there is calculated value change over a certain period. So, if the value of Moving average was 100 and now it is 110, the change is going to be +10
- After these calculations are done, all three of these values are summed up into one
- Based on this value we can determine whether the overall sentiment is bullish or bearish (if the value is larger than 0, the sentiment is bullish and if it is bellow 0, it is bearish)
- One more metric is used when determining the overall trend, and that is the ATR indicator. This indicator represents a certain movement threshold that has to be surpassed in order to have a valid trend
- So all of this can be summed up into this -> if the summed up value of the value shift of 3 moving averages over certain period is larger than ATR value for certain period, the trend is considered as bullish and if this summed up value is lower than ATR value *-1, the trend is considered as bearish. In case the summed value is smaller than ATR value and larger than ATR value *-1, there is no trend.
-----------------------------------------------------------------------------------------
How to use the Indicator:
- The indicator should be used as a tool for giving you a generic feel about the current trend
- It is not a signal providing system
- It can be adjusted for any trading style by changing the Periods in input menu. (As the values are lower, it will give you more short time trend and vice versa)
- It is a great tool to combine with any trend following strategy
-----------------------------------------------------------------------------------------
Which markets and TimeFrame:
- The UltraTrend Indicator works on all of the markets and all of the TF
- I usually use it on 15min and 1H TF, but that is solely my preference
-----------------------------------------------------------------------------------------
Inputs:
First Period = Period of the first MA
Second Period = Period of the second MA
Third Period = Period of the third MA
ATR Period = Period of the ATR