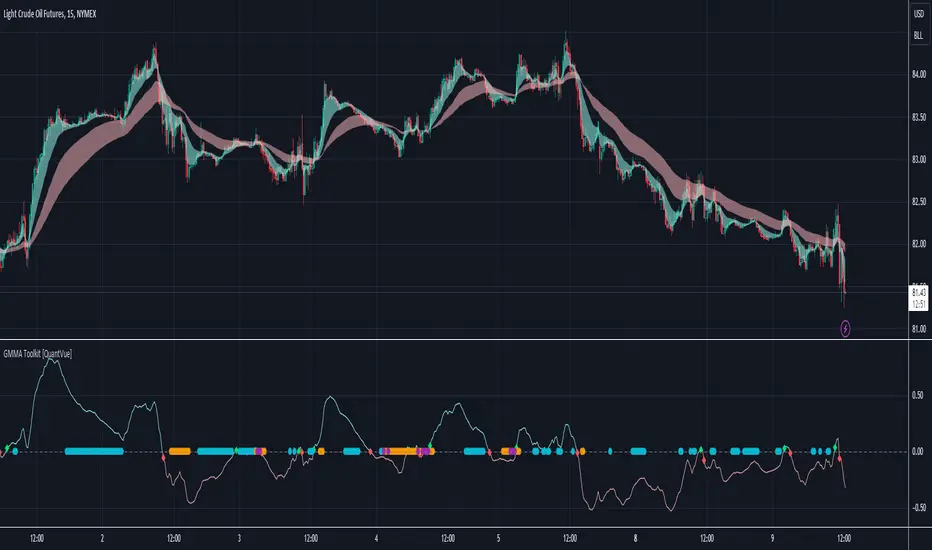
GMMA Toolkit [QuantVue]The GMMA Toolkit is designed to leverage the principles of the Guppy Multiple Moving Average (GMMA). This indicator is equipped with multiple features to help traders identify trends, reversals, and periods of market compression.
The Guppy Multiple Moving Average (GMMA) is a technical analysis tool developed by Australian trader and author Daryl Guppy in the late 1990s.
It utilizes two sets of Exponential Moving Averages (EMAs) to capture both short-term and long-term market trends. The short-term EMAs represent the activity of traders, while the long-term EMAs reflect the behavior of investors.
By analyzing the interaction between these two groups of EMAs, traders can identify the strength and direction of trends, as well as potential reversals.
Due to the nature of GMMA, charts can become cluttered with numerous lines, making analysis challenging.
However, this indicator simplifies visualization by using clouds to represent the short-term and long-term EMA groups, determined by filling the area between the maximum and minimum EMAs in each group.
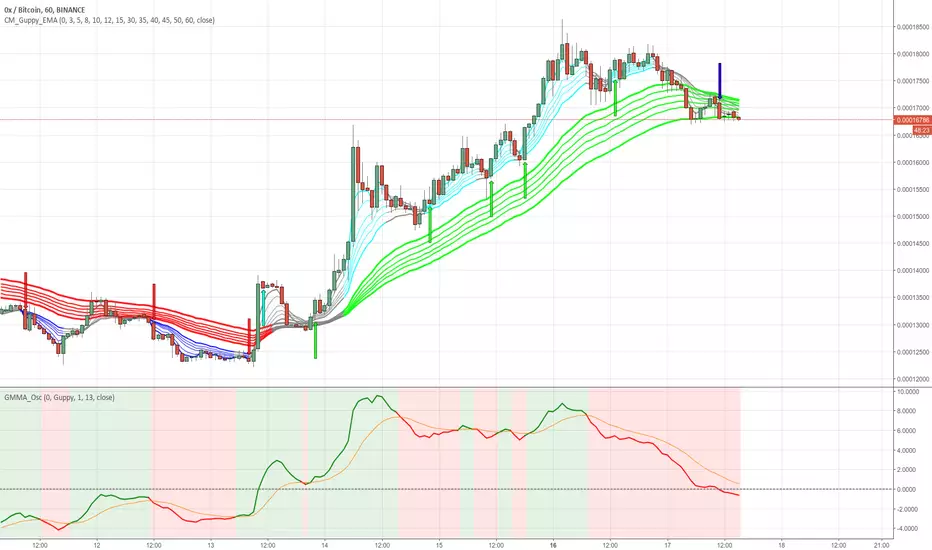
The GMMA Toolkit goes a step further and includes an oscillator that measures the difference between the average short-term and long-term EMAs, providing a clear visual representation of trend strength and direction.
The farther the oscillator is from the 0 level, the stronger the trend. It is plotted on a separate panel with values above zero indicating bullish conditions and values below zero indicating bearish conditions.
The inclusion of the oscillator in the GMMA Toolkit allows traders to identify earlier buy and sell signals based on the GMMA oscillator crossing the zero line compared to traditional crossover methods.
Lastly, the GMMA Toolkit features compression dots that indicate periods of market consolidation.
By measuring the spread between the maximum and minimum EMAs within both short-term and long-term groups, the indicator identifies when these spreads are significantly narrower than average by comparing the current spread to the average spread over a lookback period.
This visual cue helps traders anticipate potential breakout or breakdown scenarios, enhancing their ability to react to imminent trend changes.
By simplifying the visualization of the Guppy Multiple Moving Averages with clouds, providing earlier buy and sell signals through the oscillator, and highlighting periods of market consolidation with compression dots, this toolkit offers traders insightful tools for navigating market trends and potential reversals.
Give this indicator a BOOST and COMMENT your thoughts below!
We hope you enjoy.
Cheers!
Gmma
Ratio Chart with GMMA■About this indicator
This indicator divides the selected stocks by any stocks you specify and plots the result in a new pane.
At the same time, it plots the GMMA against the result of the division.
This allows you to see the relative chart and trend of the selected stock and the arbitrary stock.
Quote Symbol: Specify the denominator of the division. The default is TOPIX. Feel free to change it.
EMA Days: 5 to 30 days are indicated in green, and 75 to 200 days in red. Change the number of days and color freely.
Explanation of Effective Usage
It is recommended to enter an index for stocks specified in the Quote Symbol.
By entering the index, you can check the superiority of the selected issue and the index at a glance.
Example: By dividing AAPL by SP500, you can see on the chart whether AAPL is stronger or weaker relative to SP500.
(Similar concept to the Relative Strength Comparison RSC.)
At the same time, by plotting GMMA, you can confirm the trend of strength or weakness of the selected issue divided by the index. This is useful for swing trading and mid- to long-term trading.
The greater the distance between the short-term and long-term EMAs of the GMMA, the more the selected stocks outperform the index, and when the short-term and long-term EMAs cross, the trend ends and the stock underperforms the index.
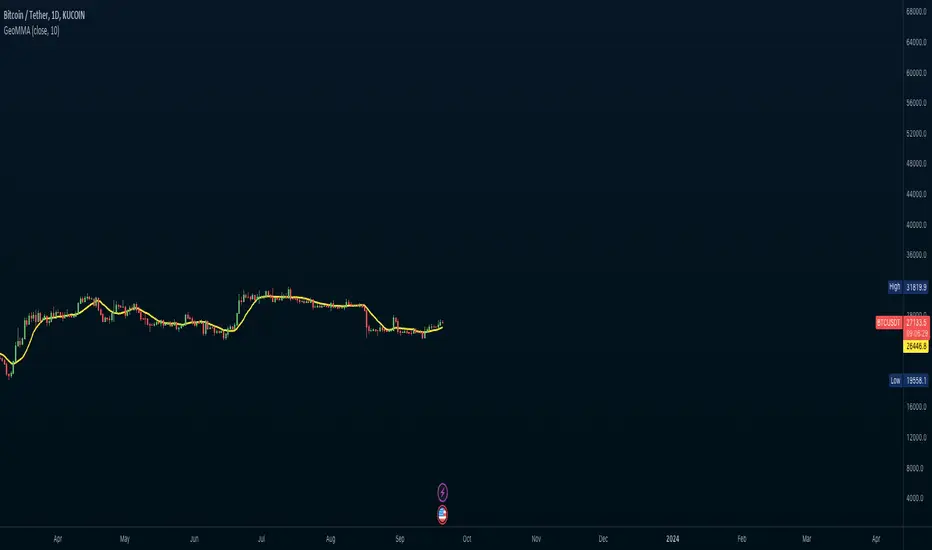
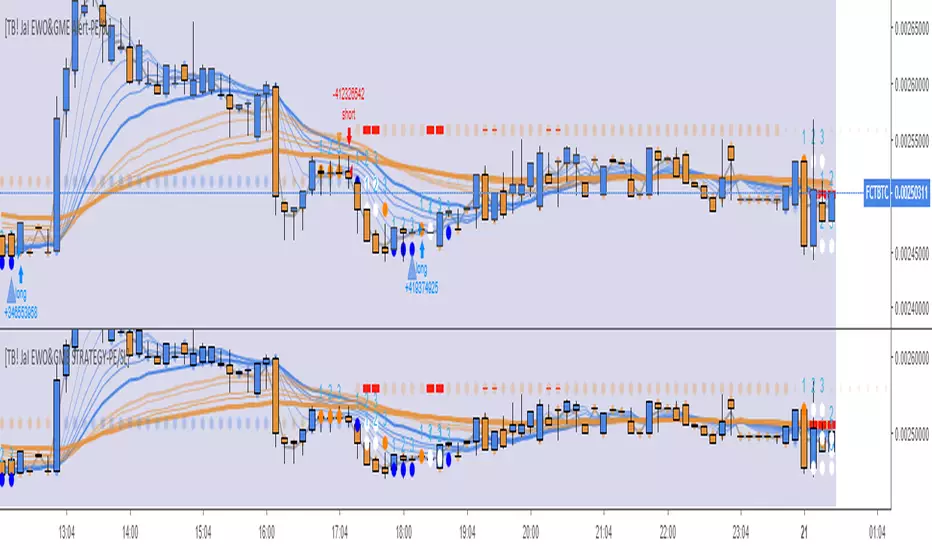
■About the Chart
The screen below shows a chart plotted using this indicator.
For comparison with the regular chart, the upper screen shows only the GMMA plotted for the selected stocks.
From the red circle in the lower screen, a trend begins where the selected stocks outperform the index, and the trend ends at the blue circle.
When the trend ends, the selected stocks will underperform the index and it can be determined that it is more efficient to invest in another stock.
■このインジケーターについて
このインジケーターは選択している銘柄を、指定した任意の銘柄で割り算し、その結果を新規ペインにプロットします。
同時に、割り算の結果に対してGMMAをプロットします。
これにより選択した銘柄と、任意の銘柄の相対チャートとトレンドを把握することが出来ます。
Quote Symbol:割り算の分母を指定します。デフォルトはTOPIXです。自由に変更して下さい。
EMA日数:5~30日が緑、75~200日を赤で表記しています。日数と色は自由に変更して下さい。
■有効な使い方の説明
Quote Symbolで指定する銘柄は、指数を入力することを推奨します。
指数を入力することによって、選択した銘柄と指数の優位性を一目で確認出来ます。
例)AAPLをSP500で割ることで、SP500に比べてAAPLが相対的に強いのか、弱いのかをチャートで把握できます。
(相対力比較RSCと似たような考え方です。)
同時にGMMAをプロットすることで、選択した銘柄÷指数の強弱のトレンドを確認できます。これはスイングトレードや中長期トレードに役立ちます。
GMMAの短期EMAと長期EMAの距離が開いていくほど、指数より選択した銘柄がアウトパフォームしていると考えられ、短期EMAと長期EMAが交わるとトレンドは終了し、指数をアンダーパフォームします。
■チャートについて
下の画面がこのインジケーターを使用してプロットしたチャートです。
通常のチャートとの比較のため、上画面には選択した銘柄にGMMAだけをプロットしたものを表示しています。
下の画面の赤い丸から、選択した銘柄が指数をアウトパフォームするトレンドが始まり、青い〇でトレンドは終了します。
トレンドが終了した場合、選択した銘柄は指数をアンダーパフォームするので、別の銘柄に投資する方が効率的と判断できます。

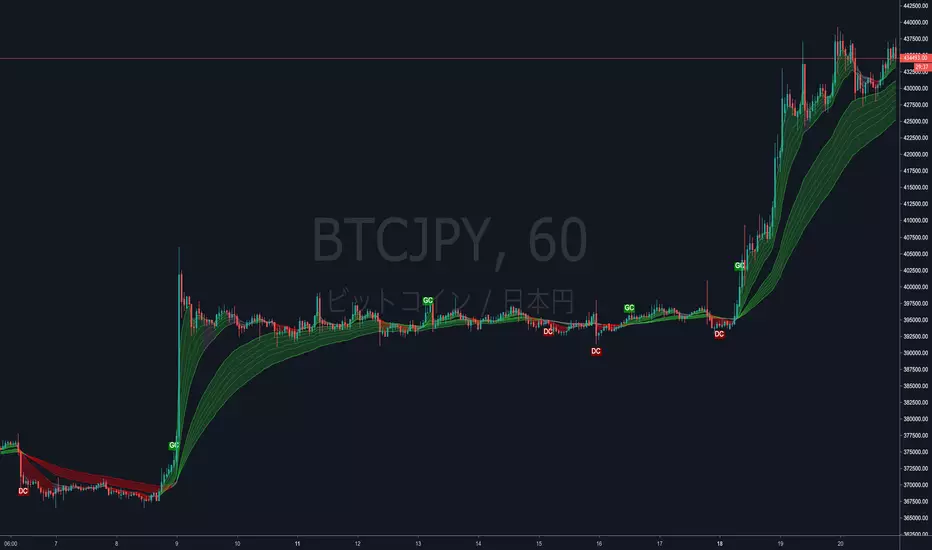
Geometrical Mean Moving AverageThe geometric moving average is a type of moving average that calculates the geometric mean of the previous n-periods of the price time series. Unlike the simple moving average that uses the arithmetic mean to continuously calculate the moving average as new price data comes in, the geometric moving average uses the geometric mean formula to get the moving average of the price data as new ones come in.
Why use a geometric moving average?
The geometric moving average differs from the simple moving average in how it is calculated. Most importantly, the geometric mean takes into account the compounding that occurs from period to period.
How can you use a geometric mean moving average?
You can use the GMMA just as you would use any other moving average indicator. You can use it to identify the direction of the trend, and in this case, it can also serve as a support level during an uptrend or a resistance level during a downtrend.
Drawbacks with a geometric moving average
Just like other moving average indicators, the GMA has limitations. Some of them are as follows:
It lags because it uses past price data.
It is pretty useless when the price action is choppy or moving predominantly sideways. During such periods, it can give multiple false signals.
GMMAs v2.0 CRYPTO [badshah_e_alam]Hello Traders ,
The GMMAs v2.0 CRYPTO strategy stands for gap modified moving averages designed for cryptos. This is a non Repainting Indicator.
This strategy version is a advanced and modified to one of my previously published indicator named as "gap modified moving average".
I am using my Modified Moving Average indicator for a while. I always wanted to add some more information to moving
averages and made some modification to Moving averages.
The additional Information I have added to the Moving Average helps it to act more quickly based on the price of that
particular asset.
How is strategy gives signals?
when the GMMA'w cross over or cross under the GMMA'y than a trade is taken depending on the filter status.
Info about the settings :
The default setting is for 11m ETHUSD , it works with other cryptos and other timeframe as well . For other timeframes it need to be fine tuned and need little change.
The first category is for the selection of Moving average to be modified and the source to be used for that moving average .
I have added seven moving averages to choose between. SMA works good for me , you can choose and play with other MAs.
following are the option to choose MAs
1.EMA
2.SMA
3.HMA
4.RMA
5.WMA
6.VWMA
7.SWMA
Next option in setting is GMMA'y and GMMA'w :
these two settings define the length and lookback period of the MA you have choosed above.
The length is similar to the length of the moving average chosen to be modified.
The lookback option will look for that number of bars for the modification.
GMMA'w is more sensitive than the GMMA'y. So make sure that the setting input of the GMMA'y is significantly larger than the
GMMA'w.
FILTER:
I have added TradingView inbuilt SUPERTREND as a filter in the strategy, it works very good in filtering out false trades
you can enable/disable it in the settings.
EXIT strategy:
The exit Strategy is based on ATR, Take profit and SL are decided by the ATR in the SL/TP setting option. You can change the RR ratio in the setting.
The backtest settings are as follow:
Initial capital:10k
Initial Commission = 0.000
Initial Pyramiding = 0
Reference :
Thanks to pinecoders and Tradingview community.
my previous gap modified moving average version is :https://in.tradingview.com/script/e3WestBa-Gap-Modified-Moving-Average/
watermark added from:
color gradient framework picked from :https://in.tradingview.com/script/hqH4YIFa-Color-Gradient-Framework-PineCoders/
DISCLAIMER
Any and all liability for risks resulting from investment transactions or other asset dispositions carried out by the user based on information received or a market analysis is expressly excluded by me.
All the information made available here is generally provided to serve as an example only, without obligation and without specific recommendations for action. It does not constitute and cannot replace investment advice. We therefore recommend that you contact your personal financial advisor before carrying out specific transactions and investments.
Do your own research and Risk management before taking any trade.

MTF GMMA with Display Timeframe ControlJapanese below / 日本語説明は下記
Multi time frame GMMA indicator that shows GMMA of the current timeframe and GMMA of upper time frame(MTF GMMA).
One of the GMMA’s advantages is to visualize trends showing multiple MAs of short term and long term. By providing both of MTF GMMA and the current timeframe’s GMMA, traders can grasp trends having upper timeframe’s perspectives.
How is it different from other MTF indicators?
Problems with other MTF GMMA indicators are;
-If you set higher timeframe GMMA , it will also be shown on further higher timeframes.
i.e. If you set 4hour GMMA on 1 hour or lower time frame charts, it will also appear on daily and weekly chart, which is not necessary.
To tackle these problems, this indicator has incorporated “display timeframe control” functions as follows.
-To show MTF GMMA on timeframe lower than the upper timeframe you set as MTF timeframe.
For example, if you select daily timeframe for MTF GMMA , the GMMA will be shown only on 4 hour or lower timeframes(1H, 30M, 15M, 5M, 1M).
Functions:
-One upper timeframe can be selected from monthly, weekly, daily, 4hour, 1hour, 30mins, 15mins and 5mins for MTF GMMA
-MA type can be selected from SMA/EMA
-MA period can be configured but common for current timeframe GMMA and MTF GMMA
-Both of current timeframe/MTF GMMA can be disabled when not necessary by ticking checkbox
How to use?
A suggested use of GMMA with MTF GMMA is trend following while price is above the current timeframe GMMA and MTF GMMA(buy the dips and sell the rips) and aim trend reversal when the current timeframe GMMA crosses MTF GMMA
Sample chart
1 hour chart with 1 hour GMMA(blue and yellow) and 4 hour GMMA(MTF GMMA, green)
——————————————————————————————
上位足のGMMA(MTF GMMA)と現在タイムフレームのGMMAの2つのGMMAを表示することのできるインジケーターです。
GMMAの一つのメリットは短期・長期のMAを複数表示することでトレンドを容易に可視化できることですが、上位足のGMMAを合わせて表示することで上位足の目線を保ったままトレンドを把握することができます。
他のマルチタイムフレームGMMAインジケーターとの違い
他のマルチタイムフレームGMMAのインジケーターでは、上位足のGMMAを表示すると、さらにその上位足でもそのGMMAが表示され、チャートが見にくくなるという問題に直面します。
例: 4時間足のGMMAを下位足で表示可能な様に設定すると、日足や週足でも表示されチャートが見にくくなる。
この問題に対して、このインジケーターでは、
・上位足のGMMAを表示する時間軸を制御することで上位足で不必要な情報を表示させない。
という機能を加えることでこの問題を解決しています。
具体的には、マルチタイムフレーム用に選択した上位足のタイムフレームより小さいタイムフレームでのみ上位足のGMMAが表示されるようになっています。
例えば、上位足として日足を選択した場合、日足のGMMAは4時間足、1時間足、30分足、15分足、5分足、1分足にのみ表示されます。
機能
-上位足のタイムフレートとして、月足、週足、日足、4時間足、1時間足、30分足、15分足、5分足を選択可能
-MAタイプはSMA/EMAから選択可能
-MAの期間は設定可能ですが、現在タイムフレームGMMAとMTF GMMAで共通
-現在タイムフレームGMMAとMTF GMMAは不要な時はチェックボックスで非表示可能
使い方
使い方の一つの例として、価格が現在タイムフレームGMMAとMTF GMMAの上にある間はトレンドフォロー(押し目買い/戻り売り)を、現在タイムフレームGMMAとMTF GMMAがクロスした時はトレンド転換を狙うということが挙げられます。
サンプルチャート
1時間足に4時間足のGMMA表示(青と黄色: 1HのGMMA, 緑: 4HのGMMA)

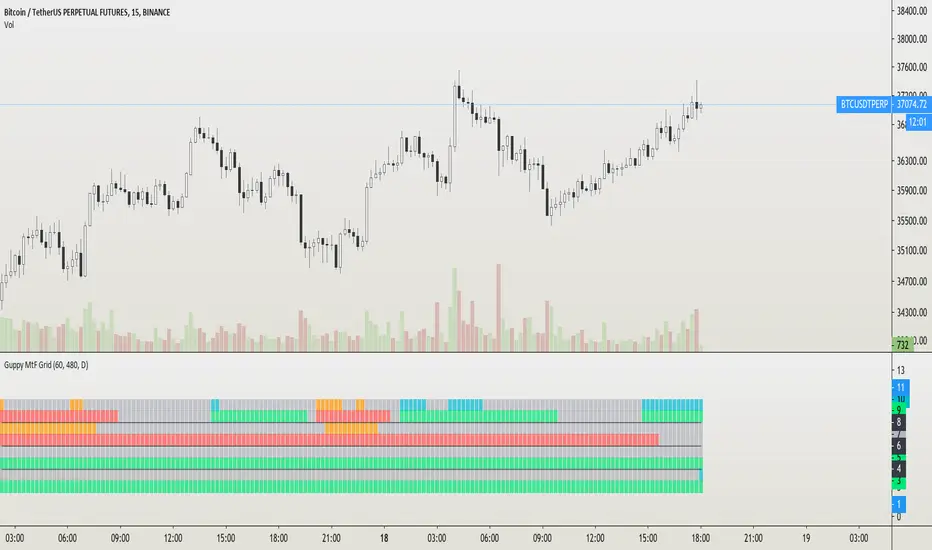
Guppy MtF GridGuppy moving averages on a grid for multi timeframe usage.
Configuration options are choosing the timeframe.
First row: current timeframe
Second, third, and fourth row: your own timeframe choice
Explanation of the Guppy moving average system:
www.investopedia.com
[blackcat] L2 Guppy Color BandLevel: 2
Background
The Guppy Multiple Moving Average (GMMA) is a technical indicator that identifies changing trends, breakouts, and trading opportunities in the price of an asset by combining two sets of moving averages (MA) with different time periods. There is a short term group of MAs and a long term group of MAs.
Function
This script incoporates GMMA as a mid-term support/resistance levels which can indicates re-entry or entry signal. Short-term fast line and slow line are used to provide short term entries. Above GMMA, one can long and xlong, while under GMMA one can short or xshort.
Key Signal
a1~a7 ---> Guppy color band
fastline --> short term fast line
shortline --> slow term slow line
safeline --> bull bear boundary
Pros and Cons
Pros:
1. easy observe price trend
2. it provides entry signal
3. it provides bull bear boundary
Cons:
Your feedbacks are welcome
Remarks
Courtesy of @LunaOwl " Rainbow Color Gradient" for GMMA color band in this script
Readme
In real life, I am a prolific inventor. I have successfully applied for more than 60 international and regional patents in the past 12 years. But in the past two years or so, I have tried to transfer my creativity to the development of trading strategies. Tradingview is the ideal platform for me. I am selecting and contributing some of the hundreds of scripts to publish in Tradingview community. Welcome everyone to interact with me to discuss these interesting pine scripts.
The scripts posted are categorized into 5 levels according to my efforts or manhours put into these works.
Level 1 : interesting script snippets or distinctive improvement from classic indicators or strategy. Level 1 scripts can usually appear in more complex indicators as a function module or element.
Level 2 : composite indicator/strategy. By selecting or combining several independent or dependent functions or sub indicators in proper way, the composite script exhibits a resonance phenomenon which can filter out noise or fake trading signal to enhance trading confidence level.
Level 3 : comprehensive indicator/strategy. They are simple trading systems based on my strategies. They are commonly containing several or all of entry signal, close signal, stop loss, take profit, re-entry, risk management, and position sizing techniques. Even some interesting fundamental and mass psychological aspects are incorporated.
Level 4 : script snippets or functions that do not disclose source code. Interesting element that can reveal market laws and work as raw material for indicators and strategies. If you find Level 1~2 scripts are helpful, Level 4 is a private version that took me far more efforts to develop.
Level 5 : indicator/strategy that do not disclose source code. private version of Level 3 script with my accumulated script processing skills or a large number of custom functions. I had a private function library built in past two years. Level 5 scripts use many of them to achieve private trading strategy.

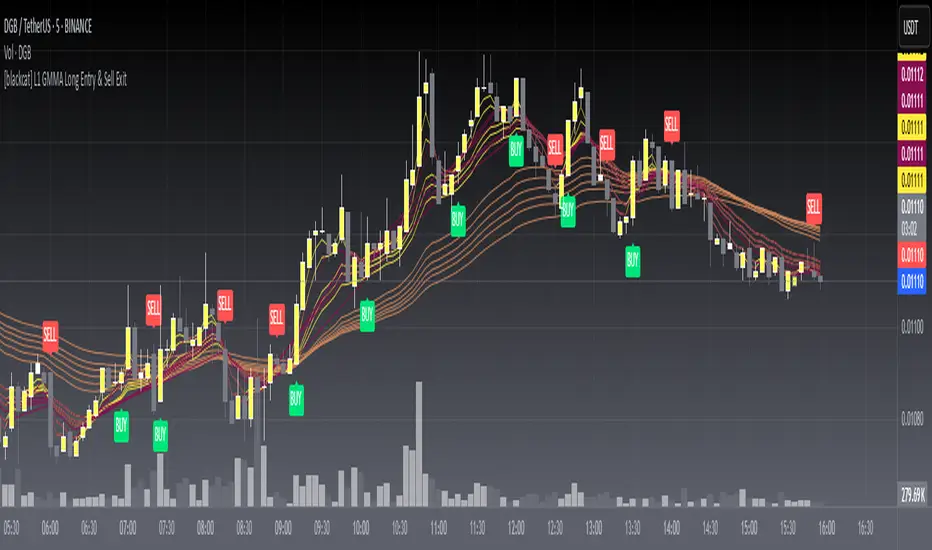
[blackcat] L1 GMMA Long EntryLevel: 1
Background
The Guppy Multiple Moving Average (GMMA) is a technical indicator that identifies changing trends, breakouts, and trading opportunities in the price of an asset by combining two sets of moving averages (MA) with different time periods. There is a short term group of MAs and a long term group of MAs.
Function
L1 GMMA Long Entry classify short-mid term GMMA cluster and long term GMMA cluster with key Fibnocci numbers. Long entry signal is generated with GMMA cluster relationship.
Key Signal
Long entry 1~6 ---> Long entry signal generated with GMMA cluster relationship.
Pros and Cons
Pros:
1. easy observe price trend
2. it covers short, middle and long term trend analysis
Cons:
1. Only long entry signal is disclosed here
2. No complex trading strategy is used yet
Remarks
NA
Readme
In real life, I am a prolific inventor. I have successfully applied for more than 60 international and regional patents in the past 12 years. But in the past two years or so, I have tried to transfer my creativity to the development of trading strategies. Tradingview is the ideal platform for me. I am selecting and contributing some of the hundreds of scripts to publish in Tradingview community. Welcome everyone to interact with me to discuss these interesting pine scripts.
The scripts posted are categorized into 5 levels according to my efforts or manhours put into these works.
Level 1 : interesting script snippets or distinctive improvement from classic indicators or strategy. Level 1 scripts can usually appear in more complex indicators as a function module or element.
Level 2 : composite indicator/strategy. By selecting or combining several independent or dependent functions or sub indicators in proper way, the composite script exhibits a resonance phenomenon which can filter out noise or fake trading signal to enhance trading confidence level.
Level 3 : comprehensive indicator/strategy. They are simple trading systems based on my strategies. They are commonly containing several or all of entry signal, close signal, stop loss, take profit, re-entry, risk management, and position sizing techniques. Even some interesting fundamental and mass psychological aspects are incorporated.
Level 4 : script snippets or functions that do not disclose source code. Interesting element that can reveal market laws and work as raw material for indicators and strategies. If you find Level 1~2 scripts are helpful, Level 4 is a private version that took me far more efforts to develop.
Level 5 : indicator/strategy that do not disclose source code. private version of Level 3 script with my accumulated script processing skills or a large number of custom functions. I had a private function library built in past two years. Level 5 scripts use many of them to achieve private trading strategy.
Triple GMMAAdded a third band to GMMA.
In addition, many kinds of moving averages can be used
GMMAに第三の帯を追加しました。
おまけで多数の種類の移動平均が使えます

EVGMMAI changed the EMA of GMMA to EVMA. You can also change to another type of MA.
I added a bundle of lines of 100, 120, 140, 160, 180, 200 as super long-term.
GMMAのEMAをEVMAに変更してみました。他の種類のMAにも変更できます。
超長期としてさらに100,120,140,160,180,200の線の束を追加してみました。

Fibo Guppy Multi MA RevisedThis is Guppy MA i customized for myself based on two scripts of GMMA from JustUncleL and NeoButane.
Its features are:
1. Besides standard EMA you can chose all kinds of exotic moving average types ike ALMA (my favorite), HullMA, ZeroLag EMA, VWMA, KAMA etc...
2. Two types of coloring scheme - depends on volatility try one that's best fit.
3. Multiple sets of predefined lengths: standard Guppy 3-60, Fibonacci based lengths 3-610, Fibo 5-987 and Custom (user defined lengths)

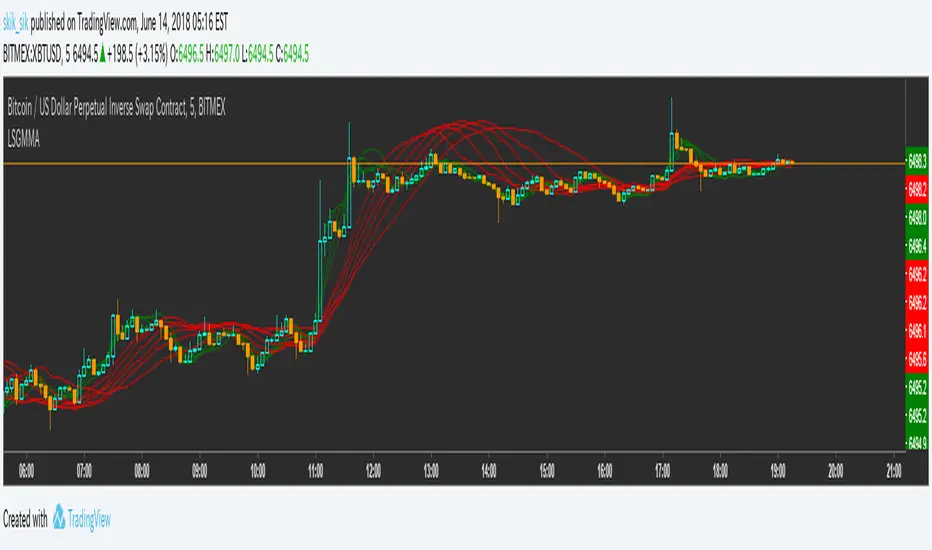
BitMEX Volatility Guppy [NeoButane]Guppy Multiple Moving Averages based on volatility moving averages.
Coloring rules from ChrisMoody's Guppy.
Guppy: www.investopedia.com
Volatility index moving average: etfhq.com
BitMEX volatility indexes: www.bitmex.com


[Strategy]TB!Just an Indicator [EWO& Guppy Made Easy]]Backtesting for TB! Just an Indicator + the merger of EWO & Guppy
Triple guppy w/ up/down colours - squattterThe trend is your friend.
Works well on 2hr TF which shows 30+60 ema from 8hr and Daily TFs.
Use a higher TF momentum indicator such as TRIX to confirm.


MA Study: Different Types and More [NeoButane]A study of moving averages that utilizes different tricks I've learned to optimize them. Included is Bollinger Bands, Guppy (GMMA) and Super Guppy.
The method used to make it MtF should be more precise and smoother than regular MtF methods that use the security function. For intraday timeframes, each number represents each hour, with 24 equal to 1 day. For daily, 3 is 3 day, for weekly, 4 is the 4 weekly, etc. If you're on a higher timeframe than the one selected, the length will not change.
Log-space is used to make calculations work on many cryptos. The rules for color changing Guppy is changed to make it not as choppy on MAs other than EMA. Note that length does not affect SWMA and VWAP and source does not affect VWAP.
A short summary of each moving average can be found here: medium.com
List of included MAs:
ALMA: Arnaud Legoux
Double EMA
EMA: Exponential
Hull MA
KAMA: Kaufman Adaptive
Linear Regression Curve
LSMA: Least Squares
SMA: Simple
SMMA/RMA: Smoothed/Running
SWMA: Symm. Weighted
TMA: Triangular
Triple EMA
VWMA: Volume Weighted
WMA: Weighted
ZLEMA: Zero Lag
VWAP: Vol Weighted Average
Welles Wilder MA


GMMA Oscillator v1 by JustUncleLOn request, here is my version of the Guppy GMMA Oscillator (and SuperGuppy Oscillator) to match with my Guppy and Super Guppy indicators.
Description:
The Guppy Multiple Moving Average (GMMA) is a technical indicator that displays two sets of moving averages. The first set contains six exponential moving averages that use faster periods to monitor the trading activity of short-term traders. The second set contains six exponential moving averages that use slower periods to monitor the trading activity of long-term investors.
The GMMA Oscillator is a technical indicator developed by Leon Wilson. The oscillator line, which percentage difference between the Fast and Slow GMMA sets. The second line is the signal line and it is simply the exponential moving average of the oscillator line.
As with many trend following indicators, a bullish signal occurs when the oscillator line crosses above the signal line and a bearish signal when the oscillator line crosses below the signal line.
Options:
Select between Guppy MMA or SuperGuppy MMA calculated Oscillator.
Option to apply smoothing to the Oscillator line (recommendation 3)
Option to change Signal line period length
Option to use Anchor Time frame to match the Guppy or SuperGuppy chart
Option to show coloured Bullish/Bearish trading Zones
Crossover alerts are also generated to be picked up by the TradingView's Alarm Sub-system.
Super Guppy LogGeometric mean is introduced to the moving averages better capture parabolic, long lasting trends.
Options to plot hlc3 of price, switch off log, and switch to Hull MA.
How to trade Guppy: www.investopedia.com
Original Guppy by ChrisMoody:
Super Guppy by FritzMurphy:
Log-space ideas by fskrypt: tradingview.com/u/fskrypt
Log-space EMAs:
Regular EMAs:

Least Squares Guppy Multiple Moving Average名前のとおり
GMMAの説明は自分でお探しくだいさい
As the name implies
Please explain GMMA by yourself
Arnaud Legoux Guppy Multiple Moving Average名前のとおり
GMMAの説明は自分でお探しくだいさい
As the name implies
Please explain GMMA by yourself
