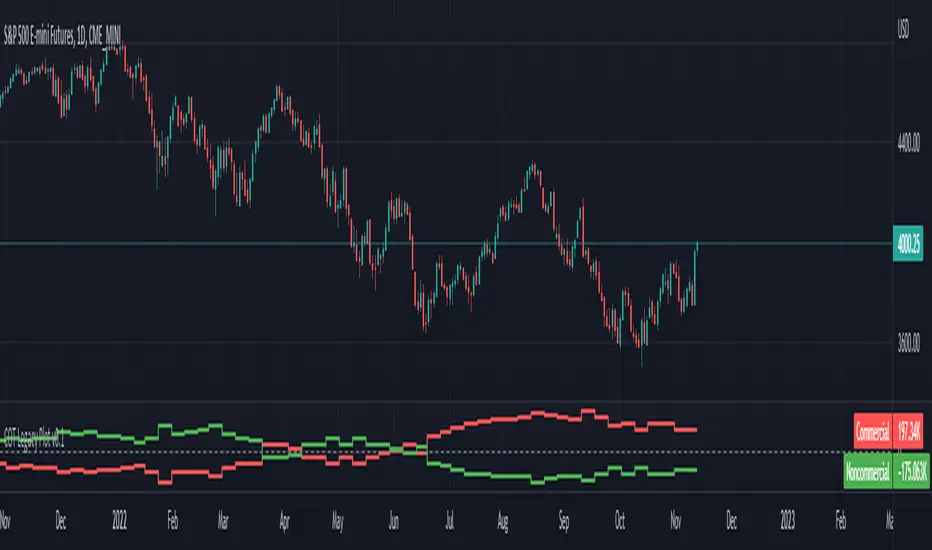
ILM CFTC COT Legacy PlotUse this indicator on Daily Timeframe
Please refer to the below link for CFTC Disaggregated COT
www.cftc.gov
This script is very similar to COT Financial Plot indicator except that it plots the data for Futures in Legacy buckets Commercial vs. Non-Commercial
Gold
In Chart Currency TickersQuick View of Multiple Currencies & Gold Price on Chart
In Chart Currency Tickers will help quick view of Multiple Currencies (Up/Down points & Percentage), you can change symbols on settings as per your requirement
മെയിൻ കറൻസികളും സ്വർണവിലയും റിയൽ ടൈം മോണിറ്റർ ചെയ്യുന്നതിനും മാർക്കറ്റ് സെന്റിമെൻറ് അറിയുന്നതിനും അതിനനുസരിച്ച് ട്രേഡിങ്ങ് ഡിസിഷൻ എടുക്കുന്നതിനും നിങ്ങളെ സഹായിക്കുന്നു
Happy Trading to All..!!!
Asif Kerim Naduvilaparambil

Money Supply Index (MSI) by zdmreThe primary objective of the states monetary policy is to maintain price stability with sustainable maximum economic growth. In anticipation of higher inflation , the Central Banks raise short-term interest rate thereby to reduce money supply. Conversely, the Central Banks reduce short-term interest rate to inject additional money into the economy in apprehension of unleashing recessionary forces. The stock markets usually respond negatively to interest rate increases and positively to interest rate decreases. The linkages between money market and stock market a wealth effect due to a change in money supply disturbs the equilibrium in the portfolio of investors.
This index indicates the long-run and short-run dynamic effects of broad money supply (M2) on U.S. stock market (this symbol is optional (Bitcoin, Gold or Oil or other markets etc.)).
#DYOR

Sovereign Gold Hodlers Script for comparing nations and their gold, with options including:
Default Comparing the Price of Gold
Use Relative Valuations price / prior price
Measure Reserves/Price
GDP/Gold Price
GDP/Gold Reserves
Given the state of the world I thought it'd be good do see where countries stand, how much real money they hold. I think gold is going to play an increased role in trade between economies in the near future.

CHN BUY SELLCHN BUY SELL is formed from two RSI indicators, those are RSI 14 and RSI 7 . I use RSI 14 to determine the trend and RSI 7 to find entry points.
+ Long (BUY) Signal:
- RSI 14 will give a "BUY" signal, then RSI 7 will give entry point to LONG when the candle turns yellow.
+ Short (SELL) Signal:
- RSI 14 will give a "EXIT" signal, then RSI 7 will give entry point to SHORT when the candle turns purple.
+ About Take Profit and Stop Loss:
- With Gold, I usually set Stop Loss and Take Profit at 50 pips
- With currency pairs, I usually keep my Stop Loss and Take Profit at 30 pips
- With crypto, I usually keep Stop Loss and Take Profit at 1.5%
Recommended to use in time frame M15 and above .
This method can be used to trade Forex, Gold and Crypto.
My idea is formed on the view that when the price is moving strongly, the RSI 14 will tell us what the current trend is through a "BUY" or "EXIT" signal. When RSI 14 reaches the oversold area it will form a "BUY" signal and when it reaches the overbought area it will give an "EXIT" signal. I believe that when the price reaches the oversold or overbought area, the price momentum has also decreased and is about to reverse.
After receiving a signal from RSI 14, my job is to wait for an Entry signal from RSI 7. When RSI 7 reaches the overbought area, a yellow candle will appear and that's when we enter a LONG order. When the RSI 7 reaches the oversold area, a purple candle will appear and that's when we enter a SHORT order.

Metals:Backwardation/ContangoMETALS: Gold , Silver , Copper ( GC , SI, HG)
Quickly visualize carrying charge market vs backwardized market by comparing the price of the next 2 years of futures contracts.
Carrying charge (contract prices increasing into the future) = normal, representing the costs of carrying/storage of a commodity. When this is flipped to Backwardation (contract prices decreasing into the future): its a bullish sign: Buyers want this commodity, and they want it NOW.
Note: indicator does not map to time axis in the same way as price; it simply plots the progression of contract months out into the future; left to right; so timeframe DOESN'T MATTER for this plot
There's likely some more efficient way to write this; e.g. when plotting for Gold ( GC ); 21 of the security requests are redundant; but they are still made; and can make this slower to load
TO UPDATE(once a year will do): in REQUEST CONTRACTS section, delete old contracts (top) and add new ones (bottom). Then in PLOTTING section, Delete old contract labels (bottom); add new contract labels (top); adjust the X in 'bar_index-(X+_historical)' numbers accordingly
This is one of three similar indicators: Meats | Metals | Grains
-If you want to build from this; to work on other commodities ; be aware that Tradingview limits the number of contract calls to 40 (hence the 3 seperate indicators)
Tips:
-Right click and reset chart if you can't see the plot; or if you have trouble with the scaling.
-Right click and add to new scale if you prefer this not to overlay directly on price. Or move to new pane below.
--Added historical input: input days back in time; to see the historical shape of the Futures curve via selecting 'days back' snapshot
updated 15th June 2022
© twingall

MACD Scalper AnalysisThis is a scalper analysis movement designed around MACD and 200 EMA
The rules are simple:
For long we check if the close of the candle is above the ema200 and we have a crossover between macd and signal
Once this happens we analyse the next candle, if its close higher than open , we can consider it a win and if its close lower than open we consider a lose.
For short we check if the close of the candle is below the ema200 and we have a crossunder between macd and signal
Once this happens we analyse the next candle, if its close higher than open , we can consider it a loss and if its close lower than open we consider a win.
Once we have all of this we analyse the average percentage movement and establish if the specific asset or timeframe is worthy for us.
At the same time it can give a good idea if we can go with a divergence strategy, like for example we have a short entry, but we will actually go long and viceversa.
If you have any questions let me know !

Macro EMA Correlation
This script is useful to see correlation between macroeconomic assets, displayed in different ema line shown in percentage to compare these assets on the same basis. Percentage will depend on the time frame selection. In the higher timeframe you will see higher variation and in small timeframe smaller variation.
You can select the timeframe who suit your trading style. The 1h and 4h fit well for longer trend swing trade and the lower time frame 15m, 5m, 1m are good for scalping or daily trading.
The following asset are available:
Bitcoin
Ethereum
Gold
Crypto total market cap excluding bitcoin (total2)
United state 10-year government bond (US10Y)
Usdt dominance show the concentration of usdt hold. For example, when trader are fearful they sell their crypto position to keep more usdt in their portfolio (USDT.D)
The USD/JPY pair the dollar usd versus the Japanese Yen one of the most forex traded pair.
You can clic on parameter to select the asset you want to analyse.
The main correlation observed are:
bitcoin negatively correlated with the usdt dominance.
bitcoin negatively correlated with the usd/jpy pair
bitcoin is positively correlated to eth, total2 (altcoin)
bitcoin positively correlated with gold
bitcoin is mostly negatively correlated to us10y
The basis of correlation is that positively correlated asset goes in the same direction and that the negatively correlated goes in opposite direction.
So, the idea is to use these information to see trend reversing.
Example 1: when bitcoin and usdt dominance are extended in opposite direction we look for a possible retracement toward 1% wich is the middle base.
Example 2 : when bitcoin make a move we look for ethereum and total 2 to follow

Volatility Risk Premium GOLD & SILVER 1.0ENGLISH
This indicator (V-R-P) calculates the (one month) Volatility Risk Premium for GOLD and SILVER.
V-R-P is the premium hedgers pay for over Realized Volatility for GOLD and SILVER options.
The premium stems from hedgers paying to insure their portfolios, and manifests itself in the differential between the price at which options are sold (Implied Volatility) and the volatility GOLD and SILVER ultimately realize (Realized Volatility).
I am using 30-day Implied Volatility (IV) and 21-day Realized Volatility (HV) as the basis for my calculation, as one month of IV is based on 30 calendaristic days and one month of HV is based on 21 trading days.
At first, the indicator appears blank and a label instructs you to choose which index you want the V-R-P to plot on the chart. Use the indicator settings (the sprocket) to choose one of the precious metals (or both).
Together with the V-R-P line, the indicator will show its one year moving average within a range of +/- 15% (which you can change) for benchmarking purposes. We should consider this range the “normalized” V-R-P for the actual period.
The Zero Line is also marked on the indicator.
Interpretation
When V-R-P is within the “normalized” range, … well... volatility and uncertainty, as it’s seen by the option market, is “normal”. We have a “premium” of volatility which should be considered normal.
When V-R-P is above the “normalized” range, the volatility premium is high. This means that investors are willing to pay more for options because they see an increasing uncertainty in markets.
When V-R-P is below the “normalized” range but positive (above the Zero line), the premium investors are willing to pay for risk is low, meaning they see decreasing uncertainty and risks in the market, but not by much.
When V-R-P is negative (below the Zero line), we have COMPLACENCY. This means investors see upcoming risk as being lower than what happened in the market in the recent past (within the last 30 days).
CONCEPTS :
Volatility Risk Premium
The volatility risk premium (V-R-P) is the notion that implied volatility (IV) tends to be higher than realized volatility (HV) as market participants tend to overestimate the likelihood of a significant market crash.
This overestimation may account for an increase in demand for options as protection against an equity portfolio. Basically, this heightened perception of risk may lead to a higher willingness to pay for these options to hedge a portfolio.
In other words, investors are willing to pay a premium for options to have protection against significant market crashes even if statistically the probability of these crashes is lesser or even negligible.
Therefore, the tendency of implied volatility is to be higher than realized volatility, thus V-R-P being positive.
Realized/Historical Volatility
Historical Volatility (HV) is the statistical measure of the dispersion of returns for an index over a given period of time.
Historical volatility is a well-known concept in finance, but there is confusion in how exactly it is calculated. Different sources may use slightly different historical volatility formulas.
For calculating Historical Volatility I am using the most common approach: annualized standard deviation of logarithmic returns, based on daily closing prices.
Implied Volatility
Implied Volatility (IV) is the market's forecast of a likely movement in the price of the index and it is expressed annualized, using percentages and standard deviations over a specified time horizon (usually 30 days).
IV is used to price options contracts where high implied volatility results in options with higher premiums and vice versa. Also, options supply and demand and time value are major determining factors for calculating Implied Volatility.
Implied Volatility usually increases in bearish markets and decreases when the market is bullish.
For determining GOLD and SILVER implied volatility I used their volatility indices: GVZ and VXSLV (30-day IV) provided by CBOE.
Warning
Please be aware that because CBOE doesn’t provide real-time data in Tradingview, my V-R-P calculation is also delayed, so you shouldn’t use it in the first 15 minutes after the opening.
This indicator is calibrated for a daily time frame.
----------------------------------------------------------------------
ESPAŇOL
Este indicador (V-R-P) calcula la Prima de Riesgo de Volatilidad (de un mes) para GOLD y SILVER.
V-R-P es la prima que pagan los hedgers sobre la Volatilidad Realizada para las opciones de GOLD y SILVER.
La prima proviene de los hedgers que pagan para asegurar sus carteras y se manifiesta en el diferencial entre el precio al que se venden las opciones (Volatilidad Implícita) y la volatilidad que finalmente se realiza en el ORO y la PLATA (Volatilidad Realizada).
Estoy utilizando la Volatilidad Implícita (IV) de 30 días y la Volatilidad Realizada (HV) de 21 días como base para mi cálculo, ya que un mes de IV se basa en 30 días calendario y un mes de HV se basa en 21 días de negociación.
Al principio, el indicador aparece en blanco y una etiqueta le indica que elija qué índice desea que el V-R-P represente en el gráfico. Use la configuración del indicador (la rueda dentada) para elegir uno de los metales preciosos (o ambos).
Junto con la línea V-R-P, el indicador mostrará su promedio móvil de un año dentro de un rango de +/- 15% (que puede cambiar) con fines de evaluación comparativa. Deberíamos considerar este rango como el V-R-P "normalizado" para el período real.
La línea Cero también está marcada en el indicador.
Interpretación
Cuando el V-R-P está dentro del rango "normalizado",... bueno... la volatilidad y la incertidumbre, como las ve el mercado de opciones, es "normal". Tenemos una “prima” de volatilidad que debería considerarse normal.
Cuando V-R-P está por encima del rango "normalizado", la prima de volatilidad es alta. Esto significa que los inversores están dispuestos a pagar más por las opciones porque ven una creciente incertidumbre en los mercados.
Cuando el V-R-P está por debajo del rango "normalizado" pero es positivo (por encima de la línea Cero), la prima que los inversores están dispuestos a pagar por el riesgo es baja, lo que significa que ven una disminución, pero no pronunciada, de la incertidumbre y los riesgos en el mercado.
Cuando V-R-P es negativo (por debajo de la línea Cero), tenemos COMPLACENCIA. Esto significa que los inversores ven el riesgo próximo como menor que lo que sucedió en el mercado en el pasado reciente (en los últimos 30 días).
CONCEPTOS :
Prima de Riesgo de Volatilidad
La Prima de Riesgo de Volatilidad (V-R-P) es la noción de que la Volatilidad Implícita (IV) tiende a ser más alta que la Volatilidad Realizada (HV) ya que los participantes del mercado tienden a sobrestimar la probabilidad de una caída significativa del mercado.
Esta sobreestimación puede explicar un aumento en la demanda de opciones como protección contra una cartera de acciones. Básicamente, esta mayor percepción de riesgo puede conducir a una mayor disposición a pagar por estas opciones para cubrir una cartera.
En otras palabras, los inversores están dispuestos a pagar una prima por las opciones para tener protección contra caídas significativas del mercado, incluso si estadísticamente la probabilidad de estas caídas es menor o insignificante.
Por lo tanto, la tendencia de la Volatilidad Implícita es de ser mayor que la Volatilidad Realizada, por lo cual el V-R-P es positivo.
Volatilidad Realizada/Histórica
La Volatilidad Histórica (HV) es la medida estadística de la dispersión de los rendimientos de un índice durante un período de tiempo determinado.
La Volatilidad Histórica es un concepto bien conocido en finanzas, pero existe confusión sobre cómo se calcula exactamente. Varias fuentes pueden usar fórmulas de Volatilidad Histórica ligeramente diferentes.
Para calcular la Volatilidad Histórica, utilicé el enfoque más común: desviación estándar anualizada de rendimientos logarítmicos, basada en los precios de cierre diarios.
Volatilidad Implícita
La Volatilidad Implícita (IV) es la previsión del mercado de un posible movimiento en el precio del índice y se expresa anualizada, utilizando porcentajes y desviaciones estándar en un horizonte de tiempo específico (generalmente 30 días).
IV se utiliza para cotizar contratos de opciones donde la alta Volatilidad Implícita da como resultado opciones con primas más altas y viceversa. Además, la oferta y la demanda de opciones y el valor temporal son factores determinantes importantes para calcular la Volatilidad Implícita.
La Volatilidad Implícita generalmente aumenta en los mercados bajistas y disminuye cuando el mercado es alcista.
Para determinar la Volatilidad Implícita de GOLD y SILVER utilicé sus índices de volatilidad: GVZ y VXSLV (30 días IV) proporcionados por CBOE.
Precaución
Tenga en cuenta que debido a que CBOE no proporciona datos en tiempo real en Tradingview, mi cálculo de V-R-P también se retrasa, y por este motivo no se recomienda usar en los primeros 15 minutos desde la apertura.
Este indicador está calibrado para un marco de tiempo diario.

Scalping Trading System bot Crypto and StocksThis is a trend trading strategy scalping bot that can work with any type of market. However I concluded my tests so far with Crypto, Stocks and Forex, and with optimizations always could be found some profitable settings.
Indicators
SImple Moving Average
Exponential Moving Average
Keltner Channels
MACD Histogram
Stochastics
Rules for entry
long= Close of the candle bigger than both moving averages and close of the candle is between the top and bot levels from Keltner. At the same time the macd histogram is negative and stochastic is below 50.
short= Close of the candle smaller than both moving averages and close of the candle is between the top and bot levels from Keltner. At the same time the macd histogram is positive and stochastic is above 50.
Rules for exit
We exit when we meet an opposite reverse order.
This strategy has no risk management inside, so use it with caution !

Full Swing Gold Vwap Macd SMO StrategyThis is a full strategy designed for gold market using 12h timeframe chart.
Its components are:
VWAP monthly
SMO oscillator
MACD histogram
Rules for entry:
For long: when enter when close of the candle is above vwap monthly, current histogram is higher than the previous one and SMO oscillator is above 0
For long: when enter when close of the candle is below vwap monthly, current histogram is lower than the previous one and SMO oscillator is below 0
Rules for exit:
We exit the trade if we get a reverse condition.
We also exit the trade based on a risk management system, both for SL and TP using % movements.
If you have any questions let me know !

{Gunzo} Stock to Flow (Gold, Silver, Dollar, Bitcoin)This indicator displays the Stock to Flow (S2F) ratio for popular commodities (Gold, Silver, Dollar, Euro, Bitcoin, Ethereum) in order to
compare them and determine which ones could be a good Store of Value (SoV).
OVERVIEW :
Stock to Flow is a popular indicator used to predict commodities scarcity. It evaluates the total stock of a commodity against the total amount that can be produced during a year. This model supposes that if scarcity is increasing, the price is going to increase.
This model has been used over the last years on Bitcoin to determine if the asset was undervalued or overvalued, and even make prediction models on the future price.
This script is going to focus on the Stock to Flow ratio (total stock/amount produced) to compare the following assets over time :
Mining resources (mined) for Gold and Silver
Cryptos assets (mined) for Bitcoin and Ethereum
FIAT currencies (banknotes printed) for Dollar and Euro
CALCULATION :
The calculation of the Stock to Flow ratio evaluates the total stock of a commodity produced against the production made for a specific year. The data is calculated on a yearly basis, then interpolated to get monthly or daily values.
DATA ORIGIN :
The main information needed to calculate the Stock to Flow ratio is the "yearly production" of a commodity. I tried to retrieve that information from the most reliable sources :
for Gold from research on www.gold.org
for Silver from research on www.silverinstitute.org
for Ethereum from research on etherscan.io
for Bitcoin from data source "QUANDL:BCHAIN/TOTBC" from www.quandl.com
for Dollar from research on www.federalreserve.gov
for Euro from research on www.ecb.europa.eu
SETTINGS :
Smoothing for interpolated data : Smoothing factor for assets that are calculated yearly and then interpolated (Gold, Silver, Dollar, Euro, and Ethereum)
Smoothing for non interpolated data : Smoothing factor for assets that are calculated daily and not interpolated (Bitcoin)
Display asset names : Display assets names in a colored rectangle on the right side of the chart
Display asset values : Display assets Stock to Flow ratio in a colored rectangle on the right side of the chart
Display key events for assets : Display important events for the assets at the bottom of the chart using the same color as the assets lines (for example Orange diamond is a Bitcoin halving). Please refer to the script code for the details of all events.
USAGE :
This script can be used on any asset available on TradingView as the data used is either static or external.
However I recommend using it the Gold asset from currency.com as the depth of the chart will be bigger (since 1980s).
It is recommended to used this script on the monthly timeframe as the chart data is calculated yearly and then interpolated.

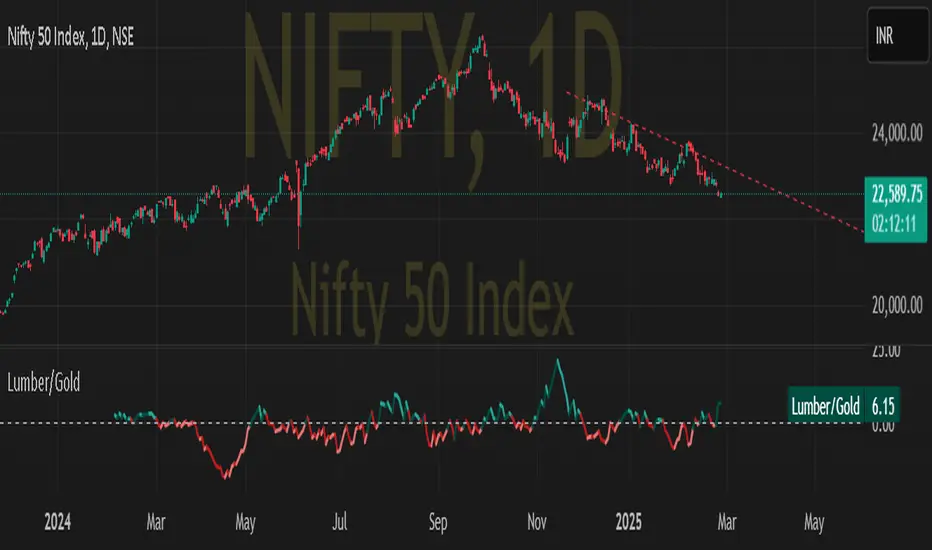
Lumber to Gold ratioDISCRIPTION:-
Lumber to gold ratio helps to predict up upcomming market correction as investors are flocking towards safe heaven.
USE CASE SCENARIO:-
If the ratio is above the zero horizontal line it is a risk of scenario
If the ratio plunge below zero it might show imminent market correction.
Sideways detection bollinger bandsSideways detection indicator using Bollinger bands .
In this case we take the original ratio between lower and upper and we smooth it even harder in order to get a better idea about the accuracy of the trend.
If the initial ratio is not between 0 and 1 and the smooth ratio is higher than our selected value, we get an idea if we are a in trending market or not.
Of course using it as a standalone has no usage, and it has to be combined with other tools like moving average, oscillators and so on.
IF you have any questions let me know

SWING for GOLD / BITCOIN Hey everyone
I want to share my swing trading system with you.Based on two moving averages coupled to RSI
The options
Shows current trends and entries for trades. Average trade retention 15-20 days
Entries for trades with a crossover of two lines
The percentage of successful test deals XAU/USD for 2010-2021: 69%

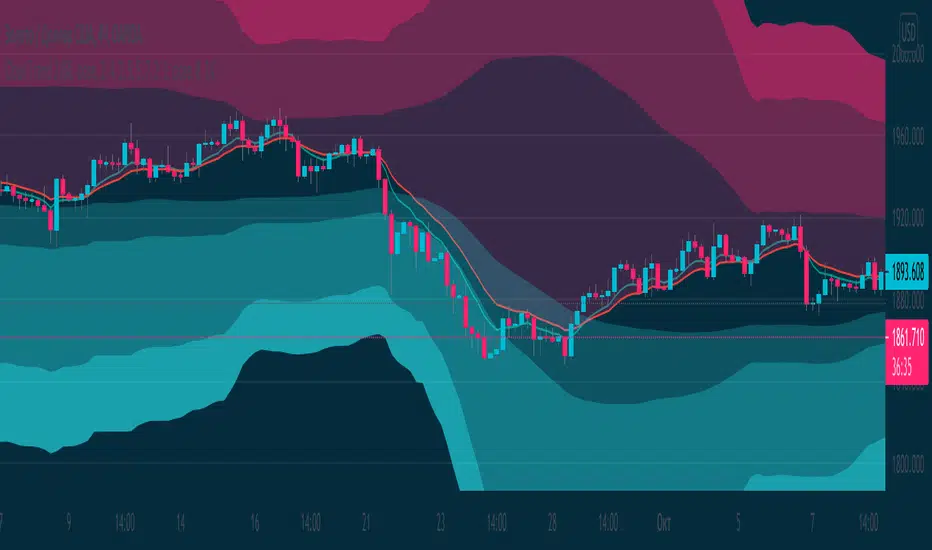
[RickAtw] ZONE Trend 3█ OVERVIEW
This indicator tracks current trends. Trends are determined by the zones created for them, the brighter the zone, the higher the probability of a market reversal.
█ FEATURES
The indicator adapts to any market.
You can set your own values for your system
Any timeframe can be used
You can increase the number of zones
█ HOW TO USE
If the market starts to enter the red zone, open buy and hold until the second or third zone.
If the market moves towards the blue zone, we sells and hold until the next zone.
█ The author of the work
Rick Atwood
Swing or scalping GOLD [RickAtwood] Swing or scalping - automatically determine the currently active trends. Various moving averages are used. It is also designed for any type of trader from scalping to swing.
The key 3 moving averages are designed to identify support and resistance. If the price bounces off them, boldly open and place a stop of 10-20 pips(currency pairs)
Functional
buy ---> green candles
sell ----> red candles
There are alerts for buy and sell based on crossovers
If the price is above the cloud then buy. If the price is below the cloud then sell. The main thing is to open deals only at the very beginning when the price starts to leave the cloud. Also, your stops will be minimal.
When testing this system, we opened 750 trades manually. Success rate of 71% for currency pairs and for gold
P.s If you have any questions about how to open, how to close deals. Always write to me, I will help you) Success to all.

T3 Gold Sniper [RickAtw]Gold Sniper based on support and resistance looks for a sniper entry for trades. Used together with EMA
Key signal
Buy ------> Green Line
Sell ------> Red Line
Functional
The system was made for gold and everything is tuned for it.
I am a professional investor and I test each system for how long. If the system makes an income, it gets to my page. Use it for gold, cryptocurrencies and pairs AUD/USD GBP/USD
[RickAtw] T2 Trend Signal GOLDTrend gold signal Ema strategy
The system finds the best entries for a trade. Use in gold, all numbers have been customized for it.
Functional
T2 trend gold is the second version of my trading system. Be sure to check out the first part! This system gives a signal earlier.
Key signals
Buy -----> Blue triangle to buy
Sell -----> Red triangle to sell
Remarks
I personally tested this system on my own trading and it helps me find entries for deals. The main thing is, if consolidation has begun, turn off the system, because the trading range is small at this moment, use oscillators
Thanks to everyone who supports me. Good luck to you friends
Buy - Take Profit OR Stop Loss % BasedScript looks back for a certain period of time and than enter when price close above that look back period ema. Once enter it does not care for how many times price cross above or below. Once entered, it will either hit percenatage based take profit of stop loss.

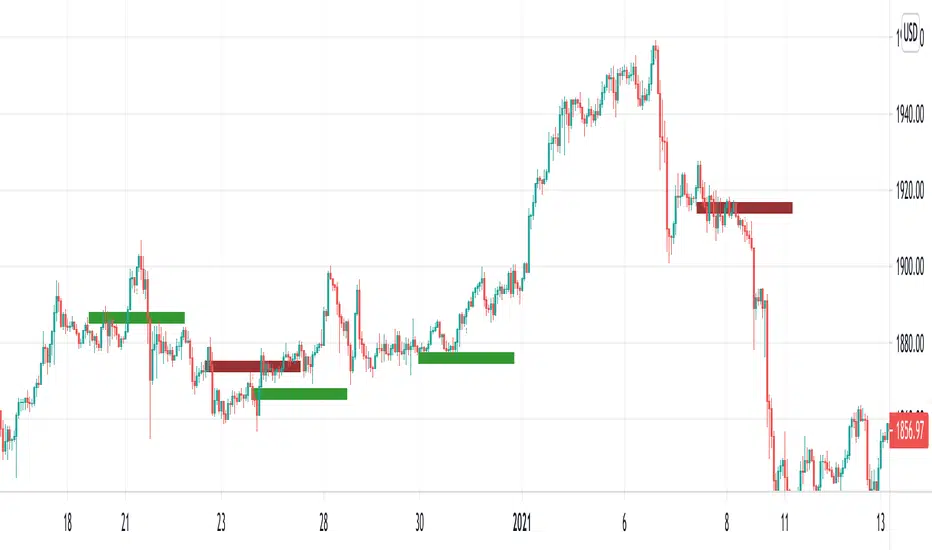
gold price levels denominated in usd/gramsPlots the gold price (USD) for the quantities (grams) identified as support or resistance in the indicator settings. Default values are:
75 gold grams
300 gold grams
500 gold grams
1000 gold grams
5000 gold grams
More context: The purchasing power of Bitcoin

Total Inflation ModelMeasure of the total economy wide inflation of the US Dollar.
Total Inflation = growth rate of money supply / economic output

XAGUSD Long/Short Signal ~ By: Sarp GokdagAbout the Oscillator :
The Rex Oscillator is a study that measures market behavior based on the relationship of the close to the open, high and low values of the same bar. The theory behind the Rex Oscillator is that a big difference between the high and close on a bar indicates weakness. Conversely, wide disparity between the low and close indicates strength. The difference between open and close also indicates market performance.
The True Value of a Bar (TVB) gives us an indication of how healthy the market is. It is possible to have a negative close and a positive TVB, and vice versa. This indicates that the market is building strength on the opposing side of the trend. The Rex Oscillator is a moving average of the TVB, indicating the inertia of the market. When the Rex Oscillator turns positive in a bearish trend, a reversal is indicated. Likewise, Rex turning negative in a bull market indicates a reversal to the downside.
When the Rex Oscillator turns positive in a bearish trend, a reversal is indicated. Likewise, Rex turning negative in a bull market indicates a reversal to the downside.
The REX Strategy goes long when the REX line of the REX Oscillator crosses above the Signal line and Short when the REX line crosses below the Signal line. The strategy is a reversal strategy through the use of the 'Cover and go Long' and 'Close and go Short' Actions. The REX Oscillator properties of Period' and Signal' can be changed for testing purposes using the available Rex1 'Factor.'
The blue line indicates the difference between the Rex MA and the Signal.
If the blue line crosses above "0", go Long.
If the blue line crosses below "0", go Short.
To achieve best results from this strategy, set your chart range minimum 4hrs, max 1 Day.
The above references an opinion and is for information purposes only. It is not intended to be investment advice. Seek a duly licensed professional for investment advice.
