Trading With Colors7 hours ago
Hello friends. This is simply a moving average ribbon, per se. The values for the colored ribbon can have their length calculated to fit their chosen resolution on the current one. This solved problems for me, but it was my own solution. Maybe I'll learn something new from sharing this.
To everybody else who is learning as well, this script essentially serves to introduce other time-frame moving averages. This intends to helps traders find the scope of relevance and not get lost in the current time-frame.
Besides the colored moving averages (2 sets, different resolutions, great zoomed in our out), I included optional check-boxes to allow comparison of sets of moving averages at will, so that the most important to the individual trader can be compared and selected specifically.
I kept the default options set to keep it clean. It likely won't be the only indicator on one's chart, so it's naturally best to reduce indicator noise from one, as to not subtract from the benefit of the other indicators.
I integrated tons of acquired knowledge into this, so I hope somebody finds a missing piece to their collection or a solution to a coding problem within. I also hope this provides a new insight and helps others on their path to financial freedom.
Best wishes.
PS: I left some old code in comments in case it helps to understand the evolution of my code. I'll update this again once it works on the Daily. You might figure it out before I do, in wish case, do share :)
Gradient

[LunaOwl] Rainbow Color Gradient作品: 色彩漸變-彩虹帶
This script is about rainbow color gradient, there are 35 colors from red to purple. The color changes with the time series, from light to dark, and then to light, repeat. Maybe it's visually beautiful. Compared to practicality, I prefer to use it as a color gradient reference. for the later works.
色彩漸變彩虹帶,從紅到紫有35種色調,隨著時間序列進行而變化,由淺到深再到淺,或許視覺上很美。
相比於實用性,我覺得應該當成色彩漸層的參考,對於以後作品可以使用上。
--------------------------*
The changing process of the rainbow (resolution = 63).
彩虹帶的時序變化過程,分辨度是63格,充滿 (✪ω✪) 圖表藝術!

Fill Strength Gradient [BigBitsIO]This script plots two moving averages but is mostly designed to highlight a fill strength gradient. The fill strength gradient shows a more opaque fill based on the current percentage difference of the current difference to the maximum difference in two MAs in a trend.
Citation: PinceCoders - Slight modification on color functions

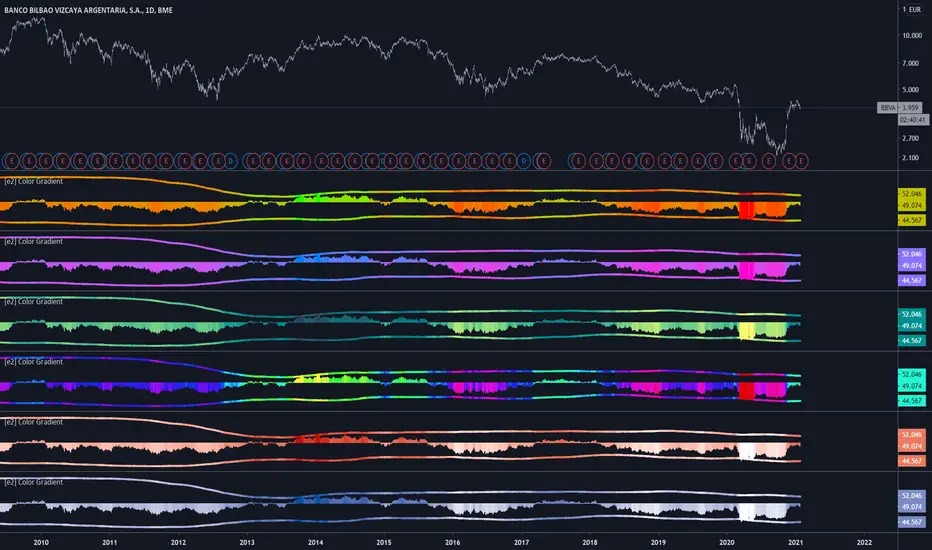
[e2] Color Gradient Function20 step red/green gradient function
The color gradient function allow colorize any source in 5% steps.
Define the source, minimum and maximum value (constant or , for example, bb (or any other channel)).
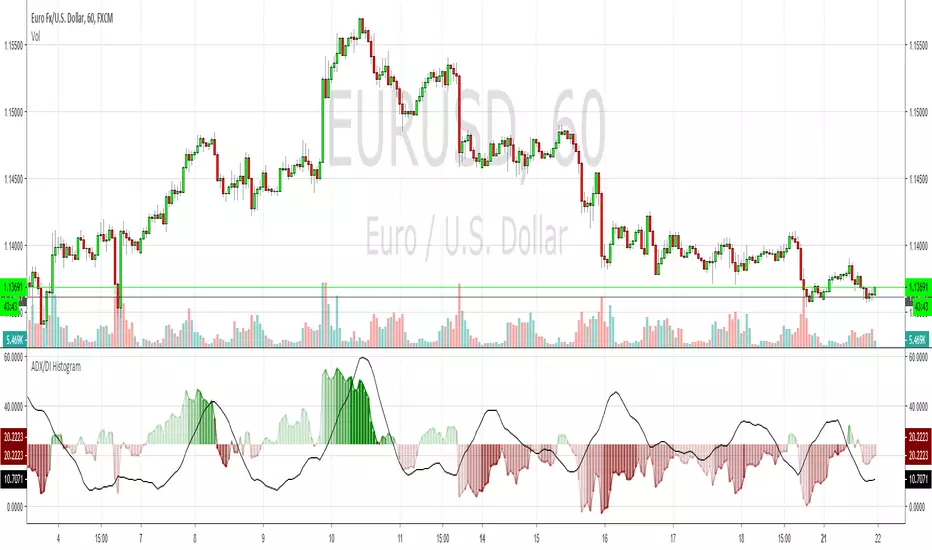
ADX & DI HistogramThis bad boy shows the same info as a normal ADX & DI but I've endeavoured to remove a lot of the confusion. I also added red/green colour gradients to show how much ADX is trending, the darker the colour, the stronger the trend. This should help to avoid the upsidedowniness and confusion I've always found with the original. I made this a while ago and have made a few changes recently but I can't remember where I go the basic ADX code from, so credit to whoever that was. Enjoy
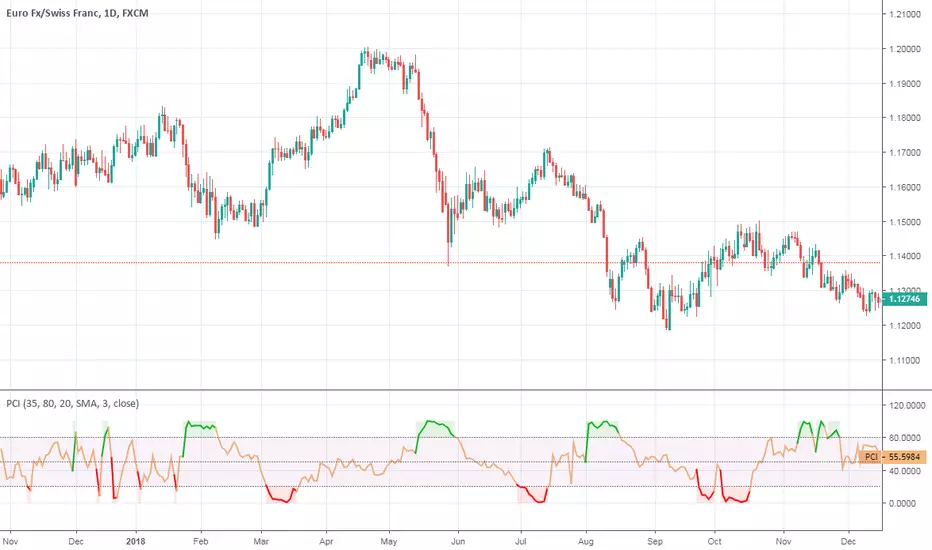
Phase Change IndexPhase Change Index script.
This indicator was developed and described by M. H. Pee (Stocks & Commodities V.22:5 (28-37): Phase Change Index).
Other indicators of M. H. Pee: